©IJRASET: All Rights are Reserved
294
A Study on the Export Performance of Indian
Engineering Goods
Suruchi D. Mitra1, Utkarsh Kulkarni2, Dr. Meenal Pendse3 1, 2, 3
School of Management - PG under Faculty of Management, MIT World Peace University, Kothrud, Pune, Maharashtra 411038
Abstract: Engineering is one of the largest segments in the Indian industry. Being closely associated with other sectors engineering sector has become one of the most important sectors in India. It enjoys many advantages in terms of manufacturing costs, technology, investments etc. Due to significant investments in power projects and infrastructure development, this sector has witnessed tremendous growth in recent years. Due to its comparative advantage in technology, manufacturing costs and innovation, India has become one of the attractive sectors to receive foreign investments in this sector. Thus, the engineering goods sector in India has now become one of the most dynamic industries in Indian exports. This paper is an attempt to analyze the export performance of engineering goods in India.
Keywords: Engineering goods, export performance, EEPC, growth, trade, Export promotion schemes.
I. INTRODUCTION
The Indian engineering industry has witnessed a remarkable growth in the past few years as a result of increased investment in infrastructure development and industrial production. India has a diversified industrial machinery and capital base competent of catering to complex requirements and demands for an entire range of the same.
India on its quest to become a global superpower has made significant steps towards the development of its engineering sector. India exports its engineering gods mostly to the US and Europe, which accounts for over 60 percent of the total exports. Recently, India’s engineering exports to Japan and South Korea has also increased with a rise to the shipments to these two countries. With the Indian Aviation industry paving its way to become the third largest across the globe and Indian ports heavily investing in infrastructure, engineering in India holds great scope and necessity, especially in the next decade which is crucial in determining positions of many nations with regard to engineering expertise.
The major goods exported from India are metal products, iron and steel products, non-ferrous metals, industrial and electrical machinery, auto and auto parts, transport equipments, aircrafts and spacecrafts, ships and boats, miscellaneous items.
The export of engineering goods contributes a high percentage to the growth of Indian GDP. The Government should focus on the products which are being exported in a huge quantity. If the policies are framed on the basis of clusters like heavy engineering and light engineering products then the Government will be able to give more attention to the sector.
II. RESEARCH METHODOLOGY
This study is based on secondary data which has been gathered from reports and some online databases such as the Centre Monitoring Indian Economy, Economic Survey, Indian Brand Equity Foundation and Engineering Export Promotion Council India. This paper is the analysis of the comparative study made between the exports performance of engineering goods in India between the period of last two fiscal years. The growth and declined figures both have been studied to draw the respective conclusion for the same.
III. ANALYSIS OF INDIAN ENGINEERING EXPORTS AND IMPORTS
A. India's Engineering Exports Scenario
Indian Engineering exports came back to growth path in May 2019 with 4.7 percent Y-O-Y growth after 7.7 percent Y-O-Y decline in April 2019.
Engineering exports in May 2019 was recorded at US$ 7.25 billion as against US$ 6.93 billion in the same month last fiscal. Cumulative engineering exports however witnessed 1.55 percent decline as the extent of decline in April 2019 was higher than the extent of growth in May 2019.
©IJRASET: All Rights are Reserved
295
Out of 33 engineering panels, 17 panels recorded growth in exports during April-May 2019 over the same period last year while for May 2019, the number increased to 20.
During April-May 2019, 12 out of top 25 countries recorded positive growth in engineering exports from India over the same period last year.
B. India's Engineering Imports Scenario
India’s Engineering imports during January 2019 were valued at US$ 9236.01 million compared to US$ 8959.49 million in January 2018 registering 3.1 percent in dollar terms.
The share of engineering imports in India's total merchandise imports is estimated at a higher 22.5 percent in January 2019 as against 21.8 percent in January 2018.
C. Engineering Exports
Indian Engineering exports came back to growth path in May 2019 with 4.7 percent Y-O-Y growth after 7.7 percent Y-O-Y decline in April 2019.
Engineering exports in May 2019 was recorded at US$ 7.25 billion as against US$ 6.93 billion in the same month last fiscal. Cumulative engineering exports however witnessed 1.55 percent decline as the extent of decline in April 2019 was higher than the extent of growth in May 2019.
Share of engineering exports in total merchandise exports was 24.2 percent during May 2019, while it was 24.5 percent when cumulative values of both of them were taken into consideration.
Out of 33 engineering panels, 17 panels recorded growth in exports during April-May 2019 over the same period last year while for May 2019, the number increased to 20.
During April-May 2019, 12 out of top 25 countries recorded positive growth in engineering exports from India over the same period last year.
The monthly engineering figures for 2019-20 vis-à-vis 2018-19 are depicted below as per the latest availability of figure:
Table1: Engineering Exports (US$ million)
Month 2018-19 2019-20 Growth (%)
April 7020.54 6485.24 -7.72
May 6928.08 7253.86 4.70
April – May 13948.62 13732.08 -1.55
(Source: DGCIS, Govt. of India.)
Figure 1 below depicts the monthly trend in engineering exports during Fiscal 2019-20 in comparison to fiscal 2018-19.
Figure1: Trend in Monthly Engineering Exports (In US$ billion)
©IJRASET: All Rights are Reserved
296
D. Correlation between Manufacturing Production and Engineering Exports
Engineering sector is an important component of the broader manufacturing sector and the share of engineering production in overall manufacturing output is quite significant. Now, as production and exports are directly correlated, some correlation between manufacturing production growth and engineering export growth is very likely to exist. Hence, a broad analysis of industrial production, especially of manufacturing sector is effective in the context of engineering export analysis as manufacturing has 77.63% weightage in India’s industrial production.
During the first and second month of fiscal 2018-19, both engineering exports and manufacturing moved in the same direction. Growth accelerated for both in April 2018. During May 2018, both engineering exports and manufacturing growth slowed down. However, these two moved in opposite directions in each month between June and August 2018. During June and July, manufacturing growth surged but engineering exports growth moderated, while in August, just the reverse happened. Again the next four months saw both of them moving in the same direction. In September 2018, engineering exports declined and manufacturing growth slowed down. October 2018 witnessed rebound in engineering exports to growth path and acceleration in manufacturing growth. In November 2018, both manufacturing output and engineering exports declined over the same month last fiscal while In December 2018, decline in engineering export slowed down considerably and manufacturing came back to growth path. The month of January 2019 witnessed slowdown in manufacturing growth over December 2018 but engineering export came back to growth path after declining in the previous two months. During February 2019, engineering export growth was marginally up but manufacturing growth slipped to negative while in March, manufacturing growth remained unchanged but engineering growth accelerated substantially.
The new fiscal 2019-20 saw engineering exports growth and manufacturing growth moving in the opposite direction in Apr 2019. Manufacturing growth accelerated while engineering exports dropped to negative. The manufacturing Index in the Index of Industrial Production (IIP) stood at 126.6 in April 2019 as against 140.3 in March 2019, 129.2 in February 2019, 135.5 in January 2019, 135.8 in December 2018, 126.8 in November 2018, 133.9 in October and 131.6 in September 2018.
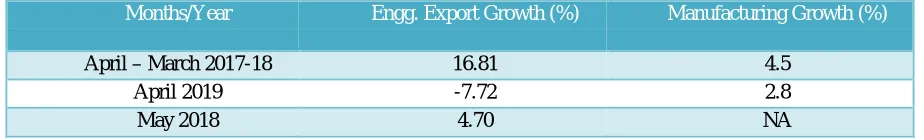
[image:3.612.76.538.411.481.2]The growth rates in Engineering Exports and the Growth rate of Manufacturing in the country during the current fiscal in shown in Table 2 below:
Table 2: Engineering exports growth vis-à-vis manufacturing growth (2019-20)
Months/Year Engg. Export Growth (%) Manufacturing Growth (%)
April – March 2017-18 16.81 4.5
April 2019 -7.72 2.8
May 2018 4.70 NA
(Source: Department of Commerce and CSO)
E. Impact of Exchange Rate
How has the exchange rate changed in May 2019 vis-à-vis May 2018? In order to find it out, we look at the monthly average exchange rate for both May 2019 and May 2018. The table below provides the same:
Table 3: Average exchange rate
May Average exchange rate 1 USD to INR
2018 67.53
2019 69.77
(Source: Calculated from RBI archive)
During May 2019, the official exchange rate of rupee vis-à-vis the US Dollar depreciated by 3.33 percent over May 2018. The pace of year-on-year depreciation maintained the trend of slowing down further in May 2019 compared to April 2019 (5.56 percent) and March 2019 (6.86 percent).
©IJRASET: All Rights are Reserved
297
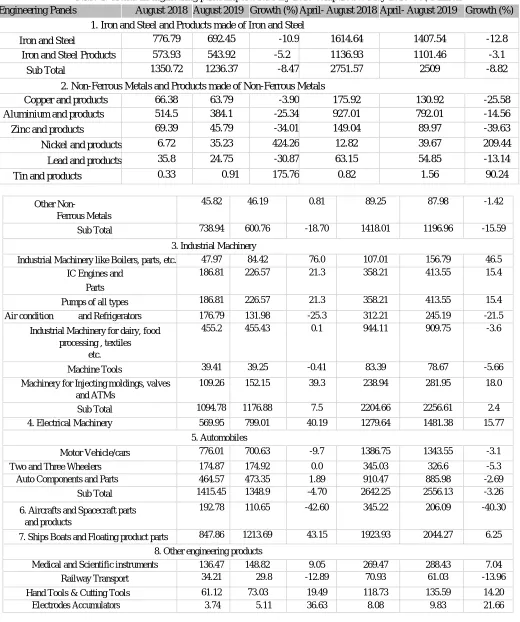
Table 4: Trends in engineering panel Exports for May 2019 compared to May 2018 US$ Million
Engineering Panels August 2018 August 2019 Growth (%) April- August 2018 April- August 2019 Growth (%) 1. Iron and Steel and Products made of Iron and Steel
Iron and Steel 776.79 692.45 -10.9 1614.64 1407.54 -12.8
Iron and Steel Products 573.93 543.92 -5.2 1136.93 1101.46 -3.1
Sub Total 1350.72 1236.37 -8.47 2751.57 2509 -8.82
2. Non-Ferrous Metals and Products made of Non-Ferrous Metals
Copper and products 66.38 63.79 -3.90 175.92 130.92 -25.58
Aluminium and products 514.5 384.1 -25.34 927.01 792.01 -14.56
Zinc and products 69.39 45.79 -34.01 149.04 89.97 -39.63
Nickel and products 6.72 35.23 424.26 12.82 39.67 209.44
Lead and products 35.8 24.75 -30.87 63.15 54.85 -13.14
Tin and products 0.33 0.91 175.76 0.82 1.56 90.24
Other Non-
Ferrous Metals
45.82 46.19 0.81 89.25 87.98 -1.42
Sub Total 738.94 600.76 -18.70 1418.01 1196.96 -15.59
3. Industrial Machinery
Industrial Machinery like Boilers, parts, etc. 47.97 84.42 76.0 107.01 156.79 46.5
IC Engines and
Parts
186.81 226.57 21.3 358.21 413.55 15.4
Pumps of all types 186.81 226.57 21.3 358.21 413.55 15.4
Air condition and Refrigerators 176.79 131.98 -25.3 312.21 245.19 -21.5
Industrial Machinery for dairy, food processing , textiles
etc.
455.2 455.43 0.1 944.11 909.75 -3.6
Machine Tools 39.41 39.25 -0.41 83.39 78.67 -5.66
Machinery for Injecting moldings, valves and ATMs
109.26 152.15 39.3 238.94 281.95 18.0
Sub Total 1094.78 1176.88 7.5 2204.66 2256.61 2.4
4. Electrical Machinery 569.95 799.01 40.19 1279.64 1481.38 15.77
5. Automobiles
Motor Vehicle/cars 776.01 700.63 -9.7 1386.75 1343.55 -3.1
Two and Three Wheelers 174.87 174.92 0.0 345.03 326.6 -5.3
Auto Components and Parts 464.57 473.35 1.89 910.47 885.98 -2.69
Sub Total 1415.45 1348.9 -4.70 2642.25 2556.13 -3.26
6. Aircrafts and Spacecraft parts and products
192.78 110.65 -42.60 345.22 206.09 -40.30
7. Ships Boats and Floating product parts 847.86 1213.69 43.15 1923.93 2044.27 6.25
8. Other engineering products
Medical and Scientific instruments 136.47 148.82 9.05 269.47 288.43 7.04
Railway Transport 34.21 29.8 -12.89 70.93 61.03 -13.96
Hand Tools & Cutting Tools 61.12 73.03 19.49 118.73 135.59 14.20
©IJRASET: All Rights are Reserved
298
Accumulator and Batteries 34.5 35.42 2.67 59.26 70.29 18.61
Bicycle & Parts 28.96 33.72 16.44 60.93 66.32 8.85
Cranes Lifts & Winches 34.53 41.85 21.20 70.62 88.73 25.64
Office Equipment 5.21 16.3 212.86 10.62 29.55 178.25
Other Construction Machinery 167.26 136.82 -18.20 307.81 261.19 -15.15
Prime Mica & Mica Products 2.72 2.66 -2.21 4.55 6.67 46.59
Other misc. items 208.88 244.07 16.85 402.34 464.01 15.33
Sub total 717.6 767.6 6.97 1383.34 1481.64 7.11
Total engineering exports 6928.08 7253.86 4.70 13948.62 13732.08 -1.55
(Source: Department of Commerce, Government of India)
F. Some Factors That Need To Be Noted Are
Unlike last month, during May 2019, exports of engineering goods (panel wise) increased by around 4.7% to US$ 7253.86 million compared to US$ 6928.08 million in May 2018. Out of 33 engineering panels, 20 panels sharing almost 60 percent of the products, recorded positive growth in exports in May 2019 over the same month last year while the remaining 13 panels conceded decline in exports. In cumulative terms however, 16 panels conceded negative growth in exports and exports of total engineering goods in April-May 2019 fell by 1.55 percent compared to April-May 2018.
Iron and Steel figures continued to drop by 10.9 percent during May 2019 with an overseas shipment recording US$ 692.45 million from US$ 776.79 million in the same month last year. Products of Iron and Steel also recorded negative exports by 5.2 percent during May 2019 falling to US$ 543.92 million from US$ 692.45 million during the same period last in May 2018. In fact the decline was greater than April 2019 when it was around 1 percent. In cumulative terms too, overall iron and steel and its products experienced an 8.82 percent drop in exports compared too same period last year.
©IJRASET: All Rights are Reserved
299
2018. In total, the non- ferrous metals together experienced an 18.7 percent drop in exports in May 2019 compared to that of May 2018. In cumulative terms too, the movement reflected the monthly trend with all panels except ‘Tin and its products’ and ‘Nickel and its products’ experiencing a y-o-y drop in exports in May 2019. In cumulative terms too, ‘Zinc and its products’ experienced the maximum decline while ‘Nickel and its products’ remained the highest gainer. Overall, exports of non-ferrous metals fell down by 15.59 percent in April-May 2019 compared to April-May 2018.
Industrial machinery panel as a whole recorded positive growth of around 7.5 percent in May 2019 compared to May 2018. ‘Industrial Boilers’ recorded the highest y-o-y growth at 76 percent followed by ‘Machinery for injecting moulds, valves and ATMs’ (39.3 percent). ‘Air Condition Machinery and parts’ and ‘Machine tools’ are the only two sectors in this panel which recorded y-o-y decline with ‘the former experiencing the highest decline at 25.3 percent. In cumulative terms too ‘Industrial boilers’ experienced the maximum y-o-y rise at 46.5 percent. ‘Air Condition Machinery and parts’ and ‘Machine tools’ experienced a negative growth in April-May 2019 compared to the same period last fiscal. In cumulative terms, the overall panel experienced a 15.77 percent rise in exports.
Exports of ‘Electrical Machinery and equipment’ experienced rise in exports in both monthly and cumulative terms. The exports increased by 40.19 percent in May 2019 when compared to May 2018. On the other hand, exports rose by 15.77 percent in April-May 2019 compared to the same period last fiscal.
The panel ‘Automobiles’ recorded 4.7 percent negative growth during May 2019, moving down from US$ 1415.45 million in May 2018 to US$ 1348.9 million in May 2019. The decline was accounted for by the drop in y-o-y exports of ‘Motor vehicles/cars’ by 9.7 percent. While ‘Two and three wheelers’ and ‘Auto components’ experienced an increase in monthly terms, in cumulative terms they experienced a decline in exports along with Motor vehicles/cars. Overall the panel experienced a 3.26 percent decline in exports in April-May 2019 compared to the same period last fiscal.
Exports of 'Aircrafts and Spacecraft parts and products' recorded decline in both monthly (42.6 percent drop) and cumulative (40.30 percent drop) terms. On the other hand, ‘Ship, Boats and Floating Bodies’ exhibited positive growth in exports in both monthly (43.15 percent rise) and cumulative (6.25 percent rise) terms.
Some other miscellaneous sectors such as ‘Office equipment’, ‘Electrodes Accumulators’, ‘Hand Tools & Cutting Tools’ ‘Bicycle & Parts’, ‘Cranes Lifts & Winches’ and ‘Medical and Scientific instruments’ experienced growth in exports in both monthly and cumulative terms. Exports of ‘Office equipment’ grew from US$ 5.21 in May 2018 to US$ 16.3 in May 2019 registering a 212 percent growth. In cumulative terms (April- May 2019), its exports increased by 178.25 percent compared to the same period last fiscal. ‘Railway transport’ and ‘Other Construction Machinery’ experienced negative growths in both monthly and cumulative terms. Exports of ‘Railway transport’ declined by 12.89 percent in May 2019 compared to May 2018 and 13.96 percent in April-May 2019 compared to April-April-May 2018. Exports of ‘Other Construction Machinery’ experienced y-o-y decline of 18.20% and 15.15 percent in May 2019 and April-May 2019 respectively.
G. Products with negative growth in May 2019 compared to May 2018
In our view, the revival in exports compared to last month is due to healthy increase in exports of ‘industrial Machinery’, ‘Electrical machinery’ and ‘Automobiles’. However, exports in both ferrous and non-ferrous primary products continued to experience a y-o-y decline in May 2019 and in cumulative terms (April-May 2019). Some heavy ticket exports products which have shown drastic fall both monthly as well as on cumulative basis are:
1) Exports of primary steel fell by 10.9% in May 2019 and 12.8% in April-May 201
2) Exports of Copper and Copper products fell by 3.9% in May 2019 and 25.58% in April-May 2019 3) Exports of Aluminium and its products fell by 25.34% in May 2019 and 14.56% in April-May 2019 4) Exports of Zinc and products fell by 34.01% in May 2019 and 39.63% in April-May 2019
5) Exports of Lead and its products fell by 30.87% in May 2019 and 13.14% in April-May 2019
©IJRASET: All Rights are Reserved
300
Figure 2
IV. REASONS FOR THE FALL
A. Iron and Steel
There was a fall in the exports by 10.9 % (i.e. US$ 692.45 million) in May 2019 vis-à-vis May 2018 (US$ 776.79 million). In cumulative terms it declined by 12.8 percent in April-May 2019 vis-à-vis April-May 2018. Steel exports in May 2019 declined by 3% when compared to April 2019. Protectionist measures by US and EU, two of the largest steel buyers, have caused fear of cross dumping of products in the other markets by steel giants including China, Korea and Japan thereby increasing competition for the Indian steel exporters. The global price trends showing 10 to 15% drop in Chinese steel prices have worsened the situation further for the Indian steel exporters. Recent reports have revealed that China’s crude steel output has hit a record high in May 2019 when compared to April 2019 and May 2018. Between January 2018 and May 2019, china’s steel output increased by 10.2% when compared to the same period last year. Rising output couples with falling prices of Chinese steel will remain a key cause of concern for the Indian exporters. Decline in exports was witnessed in some of India’s biggest export destinations including Germany (-26.4%), UK (-51.7%), France (-31.9%), Italy (-43%), Belgium (-37.2%), Korea (-35.3%) in the month of May 2019 compared to May 2018. While exports to US increased marginally (2.9%), the ongoing protectionist policy and the withdrawal of the US GSP effective from June 5, 2019 will affect Indian steel exporters in the country. Exports to China exhibited a healthy growth of 53.4% in May 2019 when compared to May 2018 which is a positive news. However, in the face of growing crude output in China and also as a retaliatory measure, the country has adopted protectionist measures in the form of antidumping duties on some US and EU steel pipes and tubes. Whether such restrictions on US and EU exporters create a conducive environment for Indian steel exporters in China remains to be seen in the near future. On the other hand, India has also put retaliatory tariffs on a 28 items imported from USA which also has products from iron and steel. This is expected to have a declining impact on India’s steel import.
As mentioned in earlier versions Government intervention is needed for reducing steel prices in India so that the steel industry could compete with their global counter parts. High logistic, finance cost, power cost, cess are making Indian steel industry commercially non-competitive. These areas need emphasis from the Government to ensure competitiveness of the industry in the global market. As a suggestive measure EEPC India proposed recently in a meeting that there could be a passbook scheme through which steel companies may be asked to supply steel to MSME exporters registered with EEPC to get steel at the export prices. The other way is to use the Advance Authorization Scheme route by allowing Indian MSME units to purchase steel at the FOB price of Indian Steel companies and payment be made EEPC accounts for MSME exporters.
Slump in ferrous and non-ferrous metal exports during May 2019
v/s May 2018
Iron and Steel
Products of Iron & Steel
Copper and products
Zinc and products
©IJRASET: All Rights are Reserved
301
B. Copper and Copper Products
There was a fall in the exports by 3.9 % (USD 63.79 million) in May 2019 vis-à-vis May 2018 (US$ 66.38 million). Copper exports in May 2019 declined by 5% when compared to April 2019.
Major fall in export during April 2019 observed in Qatar (97.1%), Korea (17.2%), Nepal (-28.6%), Bangladesh (-54.8%) and Malaysia (-36.2%). The shutdown of the 400 KT, Tuticorin smelter of Sterlite which accounted for 40% of the country’s copper smelting capacity has been a key factor behind falling domestic refined copper production and falling exports.
Domestic industry relies heavily on imports of copper concentrate from far off countries, particularly from South Africa in a big way for production of refined copper. Recent reports by the industry however show that China has stepped up domestic copper production (increase of almost 8% in 2018) due to which the country’s demand for copper concentrate has increased drastically thereby creating pressure on the concentrate market. As per reports, China’s import of copper concentrate increased by 13.7% in 2018 compared to 2017. Simultaneously, the copper concentrate production is expected to see a deficit in 2019 due to reduced production in several regions. For instance, Grasberg in Indonesia, world’s second largest copper mine is having major production problems due to changes in rules by the government. On the other hand Chile’s Codelco, the world’s top copper mine reported an 18% y-o-y drop in its first quarter copper production. Therefore, rising copper concentrate demand by Chinese and globally falling production of the same is creating issues for Indian copper producers. Also imposition of export tax by Indonesia is also making our imports expensive. Indonesia is a FTA partner of India under India – ASEAN FTA and the Government should take up this issue at G2G level. Additionally the 2.5% duty on the copper concentrate is leading to inverted duty structure. Government could consider removal of this duty in order to help the industry becoming globally competitive.
Noting with concern over 60 percent fall in copper and copper product exports in March 2019 and 39% in April 2019, EEPC India suggested the Government to develop internationally compatible standards and bring a Copper scrap policy like the Steel scrap policy in order to prevent import of inferior and hazardous material.
C. Aluminium and Aluminium Products
There was a fall in exports by 25.34% in May 2019 (US$ 384.1 million) when compared to May 2018 (US$ 514.5 million). Fall in exports have been witnessed in USA (14.6%), UK (38.5%), Japan (37.3%), Germany (3.2%), Italy (63.7%), etc.
In a recent report by the Aluminium industry, it has been mentioned specifically that the industry is suffering from non-competitive energy costs and severe coal shortages which has put pressure on production. There is also a persistent rise in imports of aluminium from other countries. Additionally, in view of the slew of protectionist measures adopted by the US encourages dumping in other markets thereby increasing competition for Indian exporters.
The industry maintains that while Aluminium is a very important sector for India almost next to iron and steel, they have not been provided adequate support by the Ministry as has been in the case of steel. The industry has requested for rationalisation of input costs of critical raw materials of the Aluminium value chain. The industry has also sought for an increased import duty on import of aluminium products to create a competitive ground for domestic producers.
D. Zinc and Zinc Products
There was a fall in the exports by 34.01 % (i.e. USD 45.79 million) in April 2019 vis-à-vis April 2018. Exports fell mainly in Korea (-54.3%), Germany (-35.1%), Bangladesh (-23.5%), Malaysia (-90%), Kenya (-26.6%) and Saudi Arabia (-65.5%).
There has been a drop in integrated production of zinc by Hindustan Zinc Ltd for the full fiscal 2018-19 by 12%. The shortfall in production has led to reduced allocation for exports in order to meet domestic demand. In addition, lower international prices have also contributed to the reduction in the value of exports.
Engineering exports also in recent months have been faltering. In this context, the sudden withdrawal of GSP by USA which is already effective from 5th June will be detrimental for Indian exporting community. Withdrawal of GSP will definitely have adverse impact on the products (833 engineering products out of 1900 total products) exported from India under GSP programme which are mostly manufactured by Indian MSMEs. The government should provide some fiscal support for affected products especially for the labour intensive MSME sector.
E. Top 25 Destinations for Indian Engineering Exports
©IJRASET: All Rights are Reserved
302
Table-5: Engineering exports country wise, (2018-19) (Values in US$ million)
Country May
2018
May 2019 Growth (%)
April- May 2018-19
April- May 2019-20
Growth (%)
UAE 782.95 1014.27 29.54 1385.78 1362.02 -1.71
GERMANY 261.82 273.81 4.58 557.41 515.22 -7.57
NEPAL 269.30 222.99 -17.20 518.41 449.26 -13.34
U K 227.49 243.35 6.97 421.25 431.27 2.38
CYPRUS 1.14 0.97 -14.90 2.07 351.62 16910.23
ITALY 202.03 166.02 -17.82 404.16 336.85 -16.66
THAILAND 115.22 155.60 35.04 209.20 281.35 34.49
SOUTH AFRICA
142.94 133.45 -6.64 457.20 246.70 -46.04
FRANCE 121.52 125.62 3.38 221.83 232.42 4.77
SAUDI ARAB 87.43 114.07 30.47 271.53 201.12 -25.93
JAPAN 121.63 90.08 -25.93 211.95 169.74 -19.91
TURKEY 192.78 86.50 -55.13 375.56 164.66 -56.16
Top 25 5182.09 5669.73 9.41 10461.38 10630.63 1.62
Countries Total
Grand Total 6928.08 7253.86 4.70 13948.62 13732.08 -1.55
Share % Total Engineering Exports
74.80 78.16 75.00 77.41
Note: Red font indicates negative growth (Source: Department of Commerce, Government of India)
The country wise engineering export figures for May 2019 show the following facts:
Engineering exports moderately embarked its journey of growth by registering positive monthly growth in May 2019 over May 2018 in 12 out of 25 countries, an improvement over last month performance.
U S A 902.51 1036.51 14.85 1862.72 1931.90 3.71
SINGAPORE 192.22 501.12 160.69 483.06 783.79 62.26
MALAYSIA 59.84 150.90 152.16 158.30 464.42 193.37
BANGLADESH 198.51 206.11 3.83 437.34 442.78 1.24
MEXICO 252.17 208.34 -17.38 496.84 400.85 -19.32
KOREA RP 178.53 183.83 2.97 365.60 340.25 -6.93
CHINA 115.79 172.04 48.59 301.76 316.83 4.99
INDONESIA 152.14 119.35 -21.55 277.41 266.00 -4.11
NIGERIA 112.90 117.35 3.94 196.20 237.69 21.15
VIETNAM 54.86 104.70 90.84 123.81 204.24 64.96
BELGIUM 253.26 79.23 -68.71 386.29 177.69 -54.00
BRAZIL 89.25 88.98 -0.30 162.54 166.96 2.72
©IJRASET: All Rights are Reserved
303
Among the ASEAN countries under the top 25 engineering exports destinations, Malaysia recorded the highest growth during April-May 2019 over April-April-May 2018. Baring Indonesia, all the other four countries – Singapore, Malaysia, Thailand and Vietnam recorded positive cumulative growth during April-May 2019 over April-May 2018.
India’s engineering exports to Cyprus recorded the highest positive cumulative growth during April-May 2019 over April-May 2018.
Among European nations falling under the top 25 engineering exports destinations, exports to France and UK recorded positive growth during April-May 2019 over April-May 2018.
India’s engineering exports to China recorded positive monthly growth as well as positive cumulative growth during April-May 2019 over April-May 2018, after a prolonged hiatus.
India’s engineering exports to its top 25 nations accounted for 77.4 per cent of India's total engineering exports in April-May 2019, which is higher than its share in the April-May 2018.
India's engineering exports to its top 25 destinations during April-May 2019 over April-May 2018 recorded a positive growth compared to the negative growth in India’s total global engineering exports during the same period.
F. Import Analysis of Engineering Goods
India’s Engineering imports during May 2019 were valued at US$ 8875.24 million compared to US$ 8535.98 million in May 2018 registering growth to the extent of 4 percent in dollar terms.
Cumulative engineering imports during Apr-May 2019-20 was recorded at US$ 17 billion as against US$ 16.7 billion during the same period last fiscal registering a cumulative growth of 2.1 percent.
Engineering imports for the year 2018-19 was recorded at US$ 104.2 billion as against US$ 93.9 billion during 2017-18 and US$ 81.83 billion in 2016-17 registering a cumulative growth of 10.9 and 11.6% respectively.
The share of engineering imports in India's total merchandise imports in May 2019 is similar to that during May 2018 estimated at 19.6%.
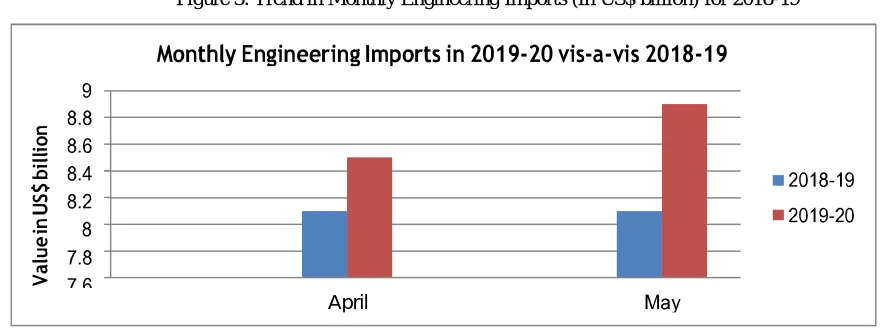
[image:10.612.73.536.445.508.2]The monthly engineering import figures for fiscal May 2019 vis-à-vis May 2018 is depicted below as per the latest availability of figure:
Table 6: Engineering Imports (US$ Million)
Months 2018-19 2019-2020 Growth (%)
April 8139.45 8143.84 0.1
May 8536.0 8875.2 4.0
(Source: Department of Commerce, Government of India)
[image:10.612.72.512.559.723.2]Figure 3 below depicts the monthly trend in engineering imports for May 2019 and May 2018
Figure 3: Trend in Monthly Engineering Imports (In US$ billion) for 2018-19
©IJRASET: All Rights are Reserved
304
G. Trend in two-way Engineering Trade
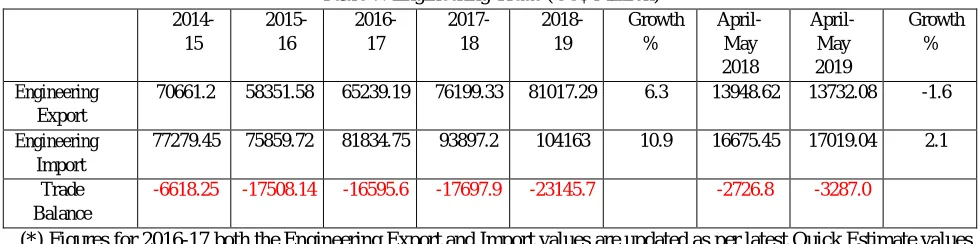
[image:11.612.61.550.139.261.2]We now present the trend in two way yearly trade for the engineering sector from 2014-15 to 2018-19 as well as the first two months of the current fiscal 2019-20 depicted in the table below:
Table 7: Engineering Trade (US$ Million)
2014- 15 2015- 16 2016- 17 2017- 18 2018- 19 Growth % April- May 2018 April- May 2019 Growth % Engineering Export
70661.2 58351.58 65239.19 76199.33 81017.29 6.3 13948.62 13732.08 -1.6
Engineering Import
77279.45 75859.72 81834.75 93897.2 104163 10.9 16675.45 17019.04 2.1
Trade Balance
-6618.25 -17508.14 -16595.6 -17697.9 -23145.7 -2726.8 -3287.0
(*) Figures for 2016-17 both the Engineering Export and Import values are updated as per latest Quick Estimate values
V. CONCLUSION
Both India’s merchandise and engineering exports came back to growth path in May 2019 with 3.93% and 7.7% y-o-y growth respectively. The growth is on account of significant increase in exports of industrial machinery, electrical machinery, etc. This is positive news especially given the grim situation in global trade. As already mentioned in the earlier reports in its World Trade Outlook quarterly report, WTO projected global merchandise exports growth to fall from 3.9% in 2018 to 3.7% in 2019. This is on account of the US-China tariff war, protectionist policies adopted by several countries including European nations and growing geopolitical disputes in the Middle East. The impact of protectionist policies adopted by both EU and US is expected to increase cross-dumping in other regions and create further pressure on Indian exporters. The impact is already witnessed in the slowing exports of ferrous and non-ferrous metals. Additionally the withdrawal of US GSP from Indian exports is expected to create further issues for Indian exporters especially in iron and steel. Therefore the Indian government and exporters have to remain cautious. Apart from global factors, several domestic factors have also affected India’s export performance. High cost of procuring inputs at the domestic front is affecting the profitability of the exporters. Moreover, domestic issues such as the shutdown of the Sterlite factory have affected the production and consequently export of various products. The frequent fluctuation in Rupee due to the continuing global disputes is also a cause of concern for the exporters. The exporters and manufacturers also require better credit flow to ward off financial constraints in their operation.
A. Summary on Global Trends
After showing somewhat optimistic performance in the first quarter (Q1) of 2019, global economic activity has been losing pace after as apprehended, reflecting further slowdown in trade and manufacturing activities. Among the developed economies, US saw its best first quarter in last four years with 3.2 percent growth supported by higher government spending, increase in private investment and a lower trade deficit. Economic activity in the Euro area has remained weak with 1.5 percent year-on-year growth in Q1 due to muted industrial activity and weak business confidence. Leading indicators point to a further slowdown in the Euro area in Q2. However, the outlook is clouded by uncertainty relating to Brexit. Economic activity has slowed in many emerging market economies during Q1 of 2019, the Chinese economy grew at the same pace as in the previous quarter, but that was slightly better than expectations. However, data on industrial production and retail sales suggest that the growth momentum may weaken in Q2. Economic activity in South Africa contracted in Q1 led mainly by a sharp decline in manufacturing activity. Brazil’s economy contracted in Q1 for the first time since 2016 and there are fears that it could return to recession.
REFERENCES
[1] R. Vidhya1 , R. Rahna2 , M. Ulaganatha Prabhu3 , Export Performance Of Engineering Goods From India, Intercontinental Journal of Finance Research Review, Volume 5, Issue 4, April 2017.
[2] Dr. A. Muthswamy, S. Karpagalakshmi, A Study on Production and Export Performance of Engineering Goods Exports in India, INDIAN JOURNAL OF
APPLIED RESEARCH, Volume 5, Issue 6, June 2015. [3] www.eepc.org