1339
©IJRASET: All Rights are Reserved
Seismic Performance of T-Beam Short Span Bridge
Aysha Afeeza
1, Shaik Kabeer Ahmed
2, Dr. G.P. Chandradhara
31P.G Student, 2Assitant Professor, Department of Civil Engineering, NMAM Institution of Technology, Nitte, Udupi, India
3Professor, Department of Civil Engineering, Sri Jayachamarajendra College of Engineering, Mysore, India
Abstract: The This paper deals with modeling a single span and two span bridge in CSi bridge software, which contains the same length, and doing their analytical comparaison by seeing into parameters like displacement, shear force, time period etc.
Keywords: Static analysis; Shear force; Displacement; Top and bottom stresses ; T beam bridge ;CSi bridge software.
I. INTRODUCTION
Buildings structure have higher degree of redundancy generally inbuilt in their structural system, which mobilizes load paths, where bridges have higher or lower redundancy. Earthquake can find structural weaknesses easily and imply more damage to it. The failure of one structural component or connection between the elements in bridges is more likely to cause collapse of the bridge structure unlike in buildings. In present study, The static analysis is performed on the bridge structure to determine response of the structure on changing span. The introduction of this paper will explain the nature of the problem, previous work, purpose, and the contribution of the paper. And the contents of all section may be provided to understand easily about the paper.
A. Type of Analysis
1) Nonlinear Static Analysis: This analysis used to find out the strength of the structure, drift capacity of already built structure and the seismic demand of the new or existing structure subjected to selected earthquake and also used for checking the feasibility of new structural design as well. The lateral load is increased gradually with the distribution pattern with the translational direction of new or existing Structure. It is displaced till target displacement is reached or structure collapses. Once the elastic limit is reached the structure is further loaded which results in formation of cracks, plastic hinge and failure of the structural components. The relation between base shear VS displacement is plotted. This curve is also called as pushover curve or capacity curve. The main objective behind plotting of capacity curve is to determine performance point for a desired seismic demand
2) Non linear Dynamic Analysis: The time-history analysis presents the precise response of a structure as a function of time, and is determined by using a step by step numerical integration of the equation of motion. The high response can be obtained from the maximum value of the response-history plot.
3) Response Spectra: Response spectra is plotted between maximum response of SDOF system subjected to earthquake ground motion and frequency. It can also seen as the maximum response of SDOF system for a given damping ratio. And it also helps in finding out the peak structural response under linear range, which is used for obtaining lateral forces developed in structure due to the earthquake thus facilitates in earthquake – resistant design of structures.
B. Literature Review
The study of Nasim shatarat and Adel Assaf says that ,a response spectrum analysis and Time history analysis is done, for a bridge in Washington to checkout its service life and also to suggest some retrofitting techniques. The results shows that, some of its cross beams needs to be retrofitted. [1]
The paper made by Amit saxena and Dr.Savita Maru compares T-beam bridge and Box girder bridge interms of their serviceability. Which finally proves, T- beam bridge more serviceable ,economical and efficient. [2]
A study has been done by Rajeev Sharma, In which he has analyzed an existing bridge from Ghaziabad on hindon river. This area is very much vulnerable to earthquake. After the study it is concluded that the bridge structure under seismic vibrations is safe. [3]
C. Objectives
1) To find out shear performance of single span and double span bridge and to determine the more feasible one.
2) To find out displacements in both the bridges and to understand which is more flexible.
1340
©IJRASET: All Rights are Reserved
II.METHODOLOGY
Two models of T Beam Bridge of 12m span are made by using CSi bridge; one is with a single span and another one is with double span. Static analysis is performed on both the models and they are checked and compared for the parameters like displacement, time period, shear force and top and bottom stresses etc.
[image:2.595.34.462.203.764.2]A. Material And Geometrical Parameters
Table.1 Material and geometrical parameters
Span 12 m Carriage way width 3.5 m Pedestrian width 1 m Width of crash barrier 0.6 m Live load IRC AA Wheel
Thickness of wearing coat 80 mm l/d ratio As per IS 456 2000 clause 23.2.1 Abutment size 4m deep 2m wide
Concrete 40 MPa Steel Fe 500 MPa
B. Models
III. RESULTS AND DISCUSSIONS
Table.2 Moments and displacements
A. Displacement Verses Time period 1) Dead load Case
[image:2.595.200.390.621.733.2]1341
©IJRASET: All Rights are Reserved
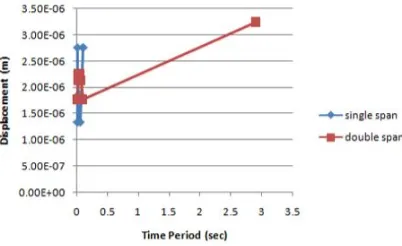
For dead load case Time period verses Displacement curve illustrates that (Fig 3), Single span bridge Displaces more when compared with double span bridge but the displacement is negligible
If we look into time period parameter, Double span bridge shows more flexibility when compared with single span bridge.
[image:3.595.199.400.179.302.2]2) Moving Load Case
Fig. 4 Displacement verses Time period (Moving load)
In moving load case (Fig 4), Performance of double span bridge is much better when compared with single span bridge. Double span bridge imparts good flexibility and stiffness property.
[image:3.595.199.402.579.697.2]B. Shear force Verses Displacement 1) Dead Load Case
Fig. 5 Shear force verses Displacement (Dead load)
In Dead load case (Fig 5), both single span bridge and double span bridge performs well. Comparatively, single span bridge carries higher shear force.
2) Moving load case
Fig. 6 Shear force verses Displacement (Moving load)
1342
©IJRASET: All Rights are Reserved
C. Stress Verses Distance Along Span
1) Dead Load Case: Top stresses are more in single span bridge when compared with double span bridge (fig 7). Same is not valid for bottom stresses; they are more in double span bridge than single span bridge (Fig 8).
[image:4.595.197.404.179.299.2]2) Moving Load Case: In moving load case also, top stresses are more in single span bridge and comparatively less in double span bridge (Fig 9). Here also, bottom stresses are more in double span bridge (Fig 10)
[image:4.595.189.436.330.454.2]Fig. 7 Top stress verses distance along span (Dead load)
Fig. 8 Bottom stress verses distance along span (Dead load)
Fig. 9 Top verses distance along span (Moving load)
[image:4.595.192.408.488.582.2] [image:4.595.195.405.614.729.2]1343
©IJRASET: All Rights are Reserved
IV. CONCLUSION
A. Shear performance of double span bridge is better than single span bridge.
B. Double span bridge is more flexible since we are getting higher time period value.
C. Single span bridge displaces more than double span bridge.
D. Stresses in the top portion i.e., in the deck slab is the major concern, and for both dead and moving load combinations double span bridge shows lesser stresses than single span bridge.
E. Comparatively, Double span bridge performed well in all the areas of concern than single span bridge.
REFERENCES
[1] Seismic behaviour and capacity / demand analysis of a simply supported multi span precast bridge by Nasim Shatarat and Adel assaf .[1]
[2] Comparative study of the analysis and design of T-beam Girder and box Girder super structure by Amit saxena , Dr .Savita Maru.[2] [3] Non linear static analysis of RC bridge by Rajeev Sharma.[3]
[3] IRC:5-2015 code of standard specifications and code of practice for road bridges. [4] IRC: 6-2016 code of loads and loads combination.