Structural Changes and Stability Switching by Indentation Simulation
in Amorphous Metals
Masaomi Nishimura
+1, Yosuke Iwasaki
+2and Masahiro Arai
Department of Mechanical Systems Engineering, Shinshu University, Nagano 380-8553, Japan
We have attempted to reveal the deformation mechanism of amorphous metals by local lattice instability analysis, based on the positive definiteness of the atomic elastic stiffness coefficients,B¡ij. In our previous study, changes in inhomogeneous structure are explained by the observation of the stability-switching or transition between detB¡ij>0and detB¡ij<0. In this study, we have performed the indentation simulation on a binary amorphous metal, and discussed the inelastic deformation in the amorphous metal by Voronoi polyhedra analysis and the stability-switching of local lattice instability. The indentation simulation predicts that rearrangements of atoms occur not only on structures below the indentation point but also inside the amorphous metal structure. These structural changes produce a significant volume change in the Voronoi polyhedra, the stability-switching based on local lattice instability analysis, and a local volume reduction evaluated within scales of a few hundred atoms. [doi:10.2320/matertrans.M2012191]
(Received May 21, 2012; Accepted August 6, 2012; Published October 11, 2012)
Keywords: local lattice instability analysis, molecular dynamics simulation, amorphous metal, indentation, stability switching
1. Introduction
To discuss the deformation mechanism, we need to understand the elementary processes of deformation, e.g., dislocation motion in crystals. Amorphous metals have short-and mid-range order such as an icosahedral atomic cluster.13)
These atomic scale structures play important roles in the formation and deformation of amorphous metals. The plastic deformation theory of amorphous metals, such as the free volume theory4) and Shear Transformation Zones,5) is
proposed on atomic scales. Thus, we should discuss the structural changes at an atomic scale to understand the elementary processes of deformation in amorphous metals.
We have performed the deformation simulation on amorphous metals using molecular dynamics (MD) and discussed the deformation at atomic scale based on the local lattice instability analysis (LLIA).6)The LLIA describes the positivity of the atomic elastic stiffness coefficients, B¡ijkl, or the second-order derivatives of atomic energy.7) In our previous report,8) we investigated changes in the atomic stability of all atoms in monatomic amorphous metals during uniaxial tension. The local structural relaxation under tension produces a simultaneous positive and negative switching of atomic stability. It is suggested that we could evaluate the origin and scale of deformation by observing the stability-switching. However, it is difficult to observe the elementary deformation process because local deformations occur everywhere under homogeneous deformations such as tension. In this study, we have performed indentation simulations on amorphous metals by the MD method, and discussed details of inelastic deformation based on LLIA and Voronoi polyhedra analysis.
2. Local Lattice Instability Analysis
Wang et al. have proposed the evaluation of lattice
stability at finite strain and temperature on the basis of the positive definiteness of elastic stiffness coefficients.9,10)
The elastic stiffness or stressstrain coefficients are written as11)
Bijkl @@·ij¾
kl
¼Cijklþ12ð·il¤jkþ·jl¤ikþ·ik¤jlþ·jk¤il2·ij¤klÞ;
ð1Þ where¤ijis Kronecker’s delta. Under the isothermal process, the stress,·ijand the elastic coefficients,Cijkl, are defined as
·ij¼V1 @@F©
ij
; Cijkl¼V1 @
2F
@©ij@©kl
: ð2Þ
Here F is the Helmholtz free energy and V is the crystal volume at equilibrium. Note that the differentiation in eq. (2) is for the infinitesimal virtual strain,©ij, at equilibrium under an external load. In this study, the stress and elastic coefficient are evaluated using only the Born term12)because the thermal fluctuation is negligibly small at very low temperature. TheBijklcombines the stress and actual strain, ¾ij, from the load-free reference state. In the linear elasticity region,Bijkl is identical toCijkl but is not equivalent in the nonlinear elasticity or finite strain region. That is, Bijkl represents the gradient at the stressstrain surface in the six-dimensional strain space, whether the system is linearly or nonlinearly elastic. Thus we can easily imagine the physical meaning of Wang’s stability criteria; it is the point where the crystal loses deformation resistance. The symmetric part of the tensor of eq. (1),Bsymijkl ðBijklþBlkjiÞ=2, dominates the lattice stability.9,10)The symmetric tensorBsymijkl is represented by the 6©6 matrix,Bij(i,j=16), in the Voigt notation.11) Thus the instability criterion could be written as detBij<0. In the system based on only the two-body interaction such as the Lennard-Jones potential, the total energy of the system, Etot, is expressed by
Etot¼12
XN
¡
XN
¢ð6¼¡Þ
ºðr¡¢Þ; ð3Þ
+1Corresponding author, E-mail: nishimu@shinshu-u.ac.jp
+2Graduate Student, Shinshu University
whereºrepresents the two-body term between atom¡and¢ separated with the scalar distancer¡¢. In this study,Fof the Helmholtz free energy in eq. (2) is approximated by Etot of
the total energy because the system temperature is very low. Differentiation of the potential form of eq. (3) yields derivations of the atomic stress, ·¡ij, and the atomic elastic coefficients,C¡ijkl.
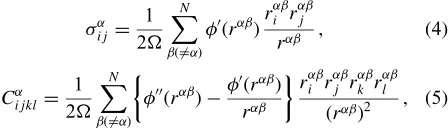
·¡
ij¼21 XN
¢ð6¼¡Þ
º0ðr¡¢Þr¡¢i r¡¢j
r¡¢ ; ð4Þ
C¡
ijkl¼21 XN
¢ð6¼¡Þ
º00ðr¡¢Þ º0ðr¡¢Þ
r¡¢
r¡¢
i r¡¢j r¡¢k r¡¢l
ðr¡¢Þ2 ; ð5Þ where ³ is the atomic volume and r¡¢i is the i-component of the position vector from atom ¡ to ¢. The prime on º indicates the derivative of the function. Thus we can calculate the atomic elastic stiffness coefficients,B¡ijkl, at any time and configuration in the simulation, using eqs. (1), (4) and (5). The symmetric part ofB¡ijklis also used for stability analysis, so that we denote the local instability condition as detB¡ij<0 (i,j=16), according to the Voigt notation.
3. Simulation Procedure
A binary amorphous metal is prepared by the usual melt-quench simulation under the periodic boundary condition in all directions. The interatomic potential adopted is the Lennard-Jones potential of Ni and Al.13)The total number of
atoms is 194,400 and the composition of Ni and Al is set to 75 : 25. An initial structure for the indentation is made by relaxation over 500 ps under the periodic boundary condition in only they-axis direction, or a through-thickness direction of sheet-like simulation cell. Figure 1 shows a schematic of the indentation simulation. An ideal cylindrical indenter is pushed into the amorphous metal down to 1 nm with a constant speed of 0.01 nm/ps by the displacement control. Then the indenter is pulled up with the same displacement rate after a holding interval of 100 ps at the maximum depth. A reaction force acts on each atom within the ideal cylindrical indenter. Only atoms within the cylindrical area interact with the ideal indenter according to the potential function14)ofVðrÞ ¼AðRrÞ3, whereAis a force constant,
R is the indenter radius andris the distance from the atom to the central axis of the cylindrical indenter. The radius of the indenter is 2.5 nm and the force constant is set to 0.5 µN/nm2. We have performed two indentation simulations along thexandzaxis as shown in the schematics on the right hand side of Fig. 1. Atoms within a distance of 1 nm at the opposite surface from the indentation point are restricted in planar motion as a fixed end of the amorphous metal. The temperature is maintained at 10 K during the simulations by the velocity scaling method. During the indentation, the atomic elastic stiffness coefficients, B¡ij, of all atoms are evaluated by eqs. (1), (4) and (5). The atomic volume, ³, in eqs. (4) and (5) is defined by the average volume in the equilibrium state in this study. Though magnitudes of atomic stress,·ij, and atomic elastic coefficients,Cijkl, vary with³, the difference in magnitude does not affect the criterion with the positivity of detB¡ij in the LLIA.
4. Results and Discussion
[image:2.595.114.484.70.234.2]4.1 Potential energy and indentation force
Figure 2 shows changes in the potential energy and the reaction force acting on the ideal indenter. The reaction force is evaluated from the sum of all axial components in the indentation direction of the interaction forces between the ideal indenter and the atoms. Vertical dashed lines show the holding interval at maximum depth; the indenter is pushed down for 110 ps and pulled up after 210 ps. Reaction forces in Figs. 2(a) and 2(b) arise owing to contacts between the indenter and surface atoms at approximately 10 ps and increase according to the increase in deformation by the indentation thereafter. These increases are linear at the early stage and discontinuous at the closing stage of the indentation loading. Forces show the peak at the end of the loading time. The oscillation of force arises after the peak, while the reaction force is not removed during the holding interval. These residual forces are caused by the elastic deformation. There is little change in potential energy at the early loading stage. The potential energies then increase and also show a peak at the end of the loading. During the holding interval, the potential energy decreases on the anterior half and oscillates on the posterior half. The oscillations also remain
R
fixed end
32.0nm
2.0nm
33.5nm
Indentation along x axis
Indentation along z axis x
y z
z
x z
x
[image:2.595.67.291.374.438.2]after the decrease in potential energy by removal of the indenter. These oscillations in potential energy correspond with those of the force; we regard these oscillations as the effect of an elastic wave. Potential energies after these simulations are different according to the indentation direction as shown on the right-hand edge of Figs. 2(a) and 2(b). This is caused by a difference in structure below the indenter because changes in potential energies below the indenter vary widely according to the indentation direction.
4.2 Volume changes of Voronoi polyhedra
Figure 3 shows snapshots of atoms during the indentation along thexaxis. These atoms are described according to the volume variation of the Voronoi polyhedron from the initial structure. The volume variation is further depicted by monochrome dots. Atoms shown with monochrome dots have a change in Voronoi volume, V¡, of more than 0.2©10¹3nm3, jV¡V¡
0j > 0.2©10¹3nm3. Atoms of
jV¡V¡
0j < 0.2©10¹3nm3 are not shown. The Voronoi polyhedron is determined using the nearest neighbor atoms to
the central atom. We can regard the Voronoi volume as an atomic volume of atom¡. Thus, the structural changes occur around the atoms shown by monochrome dots in these
figures because the Voronoi volume changes significantly owing to the rearrangement of nearest neighbor atoms. At the initial structure where t=0 ps, all atoms are not shown because their volume variation is zero. Atoms just below the indentation point change Voronoi volume in Fig. 3(b) where t=40 ps. That is, rearrangement of atomic structure begins from the indentation loading. Outer circumferential atoms also change their Voronoi volumes because the Voronoi polyhedron is not accurately defined around surfaces. Wefind many atoms that have changed Voronoi volumes significantly inside the amorphous metals in addition to the area just below the indentation point in Figs. 3(c) where t=80 ps and 3(d) where t=110 ps. Because these changes occur irregularly and collectively, the potential energy and indentation force during the indentation loading show discontinuous changes as shown in Fig. 2(a). During the holding of the indenter at maximum depth, significant changes of Voronoi volume also
0 0.01 0.02 0.03 0.04 0.05 0.06 0.07 0.08 0.09
-2.3806 -2.3805 -2.3804 -2.3803 -2.3802 -2.3801 -2.3800 -2.3799 -2.3797 -2.3796
F
o
rce,
P
/ N
μ
(b) Indentation on Ni75Al25 along z axis
(a) Indentation on Ni75Al25 along x axis
Potential
ener
gy per
atoms,
E
100 200 300
Loading Holding Unloading
Etot /N
P
Time, t / ps 0
100 200 300
Loading Holding Unloading
Time, t / ps
Etot /N
P
-2.3798
/
N
/ eV
tot
Fig. 2 Changes in potential energy and indentation force.
(a) t = 0 ps (b) t = 40 ps (d) t = 110 ps
(f) t = 180 ps (e) t = 150 ps
x
0.2 1
(c) t = 80 ps
|
V
-V
|
/ 10-3 nm3(i) t = 300 ps
(g) t = 210 ps (h) t = 270 ps
z
α α0
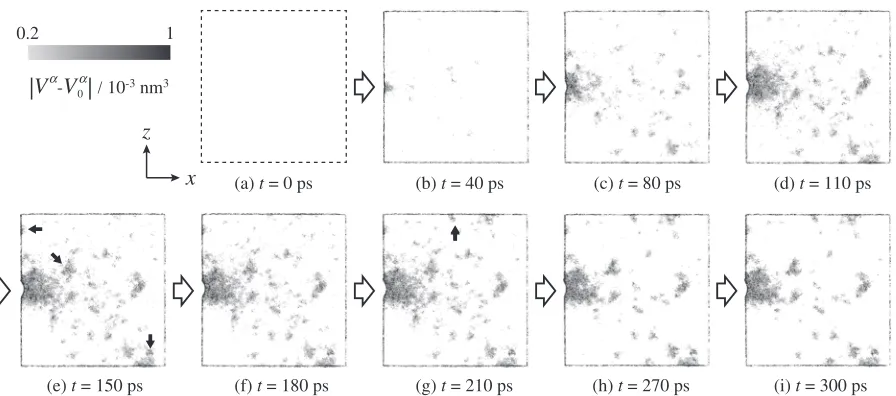
[image:3.595.119.478.70.242.2] [image:3.595.78.526.293.491.2]arise in new areas as shown by the black arrows in Fig. 3(e) where t=150 ps. The structural relaxation also continues after the end of the loading and results in the decrease in potential energy as shown in Fig. 2. It can be seen that structural changes do not occur fromt=150 ps tot=180 ps, because Fig. 3(e) and 3(f ) are almost identical in appearance. This suggests that not structural changes but reversible changes such as elastic waves cause the oscillation in potential energy and the indentation force after the indentation loading. After t=180 ps, new deformed areas arise again as shown by the black arrows in Fig. 3(g) where t=210 ps; the potential energy decreases slightly owing to the deformations. The number of atoms shown using monochrome dots decreases by the pulling of the indenter as the volume changes by elastic deformation to return to the initial volume (see Fig. 3(h) where t=270 ps). At the end of the indentation simulation, wheret=300 ps, the Voronoi volumes of many atoms have changed significantly from their initial state. These regions imply that non-reversible structural changes have been caused by the indentation. We have not shown the results from another indentation along thezaxis owing to page limitations; however, it is also true that the emergence of structural changes is evaluated by the volume variation of the Voronoi polyhedra and this corresponds with the changes in potential energy of Fig. 2(b). Figure 4 shows snapshots of the atoms at 300 ps after the indentation simulation. Atoms are shown with monochrome dots according to the volume variation of the Voronoi polyhedron from the initial structure; thus, Fig. 4(a) is the same as Fig. 3(i). Many atoms just below the indentation point had a significant change in Voronoi volume, while rearrangement of atoms occurs on some regions inside the amorphous metal. As discussed previously in Fig. 3, these regions indicate the non-reversible structural changes caused by the indentation because the indenter is far away from the surface. Many regions of structural changes are observed in either indentation along thexorzaxis, such as is shown by
Area 2 in Fig. 4. On the other hand, we find the same deformation in both Figs. 4(a) and 4(b) as shown by Area 1. It is suggested that the initial structure of the amorphous metal in these regions is deformable or weak.
4.3 Stability-switching based on local lattice instability analysis
We evaluated the elastic stiffness coefficient, B¡ij, of all atoms every 5 ps. Figure 5 shows the number of atoms that have switched their stabilities for each 5 ps time interval.Nposi
and Nnega indicated by black and gray lines are defined as
the number of atoms with positive change from detB¡ij <0 to detB¡ij0 and negative change from detB¡ij0 to detB¡ij <0, respectively. We have also evaluated the number of atoms that have switched the stability for each time interval ¦t=5 ps at equilibrium. The upper and lower limits of the switching range are monitored over 100 ps at equilibrium and are indicated by light gray zones between the horizontal dash-dotted lines. In the same way, we have discussed the stability-switching for each time interval under tension on monatomic amorphous metals in our previous study.8) Results show that both positive and negative
stability-switching are activated according to the incidence of the structural relaxation under tension. Thus, we can comprehend the inhomogeneous deformation in amorphous metals by the observation of the “deterministic” stability-switching in the MD simulations. Here, the “deterministic” stability-switching means the change in positivity of detB¡ij owing to rearrangement of the atomic structure. The deterministic switching corresponds with the collapse or generation of an atomic cluster such as an icosahedral structure.7) The negative switching means a change from stable to nonresistant structure for deformation, and the opposite occurs for positive switching. However, “ probabil-istic”stability-switching occurs by the atomic perturbation or thermal vibration even in the equilibrium state as shown by the light gray zones in Fig. 5. In the indentation simulation of
x
z
Area1 Area2
10nm
Area1 Area2
α α 3
0
|V -V | / 10 nm-3
0.2 1
(a) Indention on Ni75Al25 along x axis (b) Indention on Ni75Al25 along z axis
[image:4.595.121.476.74.300.2]Fig. 5,NposiandNnegacoincide with one other, and stay in the
light gray zone at the early stage of the indentation loading. Then, bothNposiandNnegapeak above the upper dash-dotted
lines from the loading. The peaks in Fig. 5(a) correspond with the end of the indentation loading, while those in Fig. 5(b) appear after the loading. The increase in number of atoms from the light gray zone indicates the incidence of “deterministic” stability-switching caused by the structural changes. After beginning the period where the indenter is activated, structural changes in Fig. 5(b) are more extensive than those in Fig. 5(a). Thus, the potential energy in the indentation simulation along thezaxis decreases significantly after the beginning of the holding as shown in Fig. 2(b). Moreover, the times when the Nposi and Nnega return to the
light gray zone coincide with the stopping time of the decrease in potential energy in Fig. 2.NposiandNnegaare also
slightly activated around the starting point of the indentation
unloading. These changes are most likely caused by the unloading of the elastic deformation.
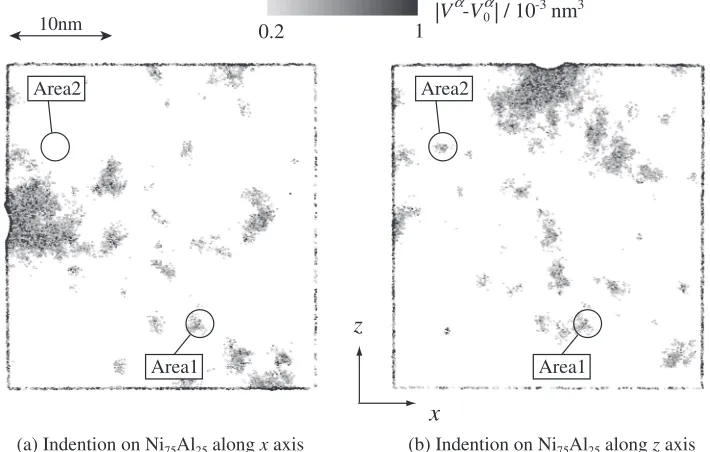
Figure 6 shows the distribution of atoms with the “deterministic” stability-switching. To indicate the “ deter-ministic”switching, we show atoms with stability-switching only once for each 5 ps time interval during the indentation simulation; gray atoms have switched negatively and black ones have switched positively. Many atoms switch their stabilities more than once, but these atoms are not shown in Fig. 6 because their stability-switching is caused mainly by“probabilistic”changes such as thermal vibration. Black and gray circles converge on some regions that correspond to changes in Voronoi volumes shown in Fig. 4. Thus, the non-invertible structural changes caused by the indentation produce the “deterministic” stability-switching. Notice that atoms shown with monochrome dots in Fig. 4 change by the threshold value of the Voronoi polyhedron
(b) Indentation on Ni75Al25 along z axis
(a) Indentation on Ni75Al25 along x axis
Time, t / ps
Number of atoms that switched their stabilities ,
N
swi
Nposi
(detBij<0 => detBij>0)
Nnega
(detBij>0 => detBij<0)
Loading Holding Unloading
α α
α α
0 100 200 300
1000 2000 3000 4000
Time, t / ps Nposi
(detBij<0 => detBij>0)
Nnega(detBij>0 => detBij<0)
Loading Holding Unloading
α α
α α
0
100 200 300
Switching range in equilibrium state Switching range in equilibrium state
Fig. 5 Changes in the number of atoms that have switched their stability.
x
z
10nm
Positive switching only once (detBij < 0 => detBij > 0) Negative switching only once (detBij > 0 => detBij < 0)
Area1 Area2
Area1 Area2
α α
α α
(a) Indention on Ni75Al25 along x axis (b) Indention on Ni75Al25 along z axis
[image:5.595.116.481.70.266.2] [image:5.595.122.472.312.538.2]volume variation. On the other hand, we can obtain an understanding of the developmental periods and scales of atomic structural changes by observation of the stability-switching without threshold value.
4.4 Local volume changes
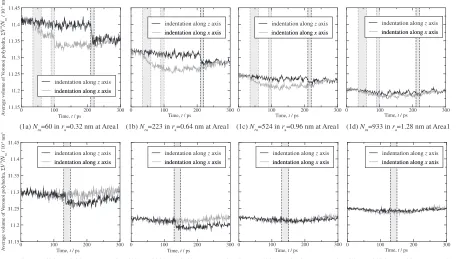
Figure 7 shows the average volume of the Voronoi polyhedra around Area 1 and Area 2 (in Figs. 4 and 6). Average volumes are evaluated by atoms within the cylindrical area of several radii, ra, in the initial structure.
Nra represents the number of atoms within the cylindrical
area. The radii on thexzplane are set to 0.32, 0.64, 0.96 and 1.28 nm, where 0.64 nm corresponds with a cutoff radius for calculation of the Lennard-Jones interaction. Gray and black lines show changes in the average volumes by indentation along the x and z axes, respectively. Light gray zones between the vertical dashed lines of gray or black correspond with the developmental period of the “deterministic” stability-switching of Area 1 and Area 2 in Fig. 6. Structural changes occur in Area 1 by indentations along both thezand xaxis, while those in Area 2 occur only by indentation along the z axis. The average volume evaluated in the smallest region shows the largest volume of the initial state in Figs. 7(1a) and 7(2a), and that in Area 1 is larger than that in Area 2. This suggests that the local structure in the amorphous metal containing many free volumes such as in Area 1 is deformable or weak. Then, the average volumes decrease significantly in the light gray zones under the indentation simulation. The volume reductions occur locally by rearrangement of the atomic structure. This is also true in regions of ra=0.64 nm in Figs. 7(1b) and 7(2b). On the
other hand, there is no difference in volume after the light gray zone by the indentation in Figs. 7(2c) and 7(2d). There is also an insignificant difference caused by the indentation
in Fig. 7(1d). This suggests that the local volume reduction in the small region does not affect the structures located at a distance because the surrounding structure in the region absorbs the volume changes. Thus, the scale of the elementary deformation process in amorphous metals is smaller than that in Figs. 7(1d) and 7(2c). The scale is estimated to be a few hundred atoms and corresponds with the scales of the Shear Transformation Zones as evaluated by the experiment.15)
5. Conclusion
To discuss the elementary deformation process in amor-phous metals, we have performed indentation simulations on the Ni75Al25amorphous metal by MD. Changes in
inhomo-geneous structure were evaluated by Voronoi polyhedra and LLIA. We discovered the following points: (1) Rearrange-ments of atoms occur not only on structures below the indentation point but also inside the structure of the amorphous metal. (2) These structural changes produce significant volume changes in the Voronoi polyhedron and the stability-switching, or transition of positivity, of the atomic elastic stiffness coefficients. (3) We can explain the non-invertible structural changes in the indentation simula-tion by the observasimula-tion of“deterministic”stability-switching. (4) Local volume reductions are evaluated in the rearrange-ment area within scales of a few hundred atoms.
REFERENCES
1) M. Shimono and H. Onodera:Mater. Sci. Eng. A449451(2007) 717 721.
2) T. Takeuchi, S. Nakano, M. Hasegawa, K. Soda, H. Sato, U. Mizutani, K. Itoh and T. Fukunaga:Mater. Sci. Eng. A449451(2007) 599604.
0
(1d) Nra=933 in ra=1.28 nm at Area1
Time, t / ps
indentation along z axis
indentation along x axis
indentation along x axis
0 100 200 300
100 200 300
Time, t / ps
(2d) Nra=930 in ra=1.28 nm at Area2
indentation along z axis
indentation along x axis
indentation along x axis
0 11.15 11.2 11.25 11.3 11.35 11.4 11.45
Time, t / ps
A v erage v olume of V oronoi polyhedra, Σ V /N ra / 10
-3 nm
3
(1a) Nra=60 in ra=0.32 nm at Area1
indentation along z axis
indentation along x axis
indentation along x axis
0 1 1 1 1
Time, t / ps
A v erage v o lume of V oronoi polyhedra, Σ V /N ra / 10
-3 nm
3
(2a) Nra=60 in ra=0.32 nm at Area2
indentation along z axis
indentation along x axis
indentation along x axis
0
(1b) Nra=223 in ra=0.64 nm at Area1
Time, t / ps
indentation along z axis
indentation along x axis
indentation along x axis
0 100 200 300 100 200 300
(1c) Nra=524 in ra=0.96 nm at Area1
Time, t / ps
indentation along z axis
indentation along x axis
indentation along x axis
0
Time, t / ps
(2b) Nra=233 in ra=0.64 nm at Area2
indentation along z axis
indentation along x axis
indentation along x axis
0
Time, t / ps
(2c) Nra=522 in ra=0.96 nm at Area2
indentation along z axis
indentation along x axis
indentation along x axis
100 200 300
100 200 300
11.15 11.2 11.25 11.3 11.35 11.4 11.45 α α
100 200 300
100 200 300
[image:6.595.74.531.74.333.2]3) H. W. Sheng, W. K. Luo, F. M. Alamgir, J. M. Bai and E. Ma:Nature 439(2006) 419425.
4) F. Spaepen:Acta Metall.25(1977) 407415. 5) A. S. Argon:Acta Metall.27(1979) 4758.
6) K. Yashiro and Y. Tomita:J. Phys. IV11(2001) Pr5-3Pr5-10. 7) K. Yashiro, M. Nishimura and Y. Tomita:Model. Sim. Mater. Sci. Eng.
14(2006) 597605.
8) M. Nishimura, K. Yashiro and M. Arai:J. Sol. Mech. Mater. Eng.4 (2010) 15631573.
9) J. Wang, S. Yip, S. R. Phillpot and D. Wolf:Phys. Rev. Lett.71(1993)
41824185.
10) J. Wang, J. Li, S. Yip, S. R. Phillpot and D. Wolf:Phys. Rev. B52 (1995) 1262712635.
11) D. C. Wallace:Thermodynamics of Crystals, (Wiley, New York, 1972). 12) J. R. Ray:Comput. Phys. Rep.8(1988) 109151.
13) S. Ozgen and O. Adiguzel:J. Phys. Chem. Sol.64(2003) 459464. 14) C. L. Kelchner, S. J. Plimpton and J. C. Hamilton:Phys. Rev. B58
(1998) 1108511088.