Microstructure of Fe
TiC Composite Surface Layer on Carbon Steel
Formed by Laser Alloying Process
Takuto Yamaguchi
1,+, Hideki Hagino
1, Mamoru Takemura
1, Yasunori Hasegawa
1,
Yasuhiro Michiyama
1and Atsushi Nakahira
21Technology Research Institute of Osaka Prefecture, Izumi 594-1157, Japan
2Department of Materials Science, Osaka Prefecture University, Sakai 599-8531, Japan
Laser alloying using a carbon steel substrate pre-coated powder mixture of pure titanium and graphite was carried out to form an FeTiC composite surface layer for improving wear resistance. The microstructure of the composite layer was studied in detail using OM, SEM, XRD and STEM to reveal the effect of the laser alloying conditions on the distribution of carbides. Coarse particles (15 µm) and submicron particles of TiC were observed. TiC particles were distributed in a lath martensite matrix, and the area fraction of TiC was about 8 to 25%. The area fraction and size of TiC depended on the laser scanning speed. Under the condition of a high scanning speed, a composite layer with a high area fraction and a coarser size of TiC was obtained. These composite layers exhibit high hardness and superior wear resistance compared with a laser transformation hardened area of the same substrate. [doi:10.2320/matertrans.MAW201304]
(Received April 23, 2013; Accepted June 17, 2013; Published July 26, 2013)
Keywords: laser alloying, surface modification, metal matrix composite, titanium carbide, microstructure
1. Introduction
Metal matrix composites (MMC) that use ceramic particles for reinforcement, have good toughness and wear resistance, when applied to wear resistant materials such as tools and die.1) MMC is generally produced by casting or a powder metallurgy processes. These materials are relatively expen-sive. In contrast, only the required area can be modified using a laser surface modification process such as laser cladding or alloying. Recently, a number of researchers have investigated MMC coating using the laser surface modifi ca-tion processes.25)
Laser alloying consists of melting the surface of a substrate with additional materials, mixing these components, followed by rapid solidification of the mixture.6,7) An MMC can be formed on the surface of a low cost material substrate by this process.
However, in this process, melting and solidification occur in a very short time, the mechanism of the formation of the microstructure in this rapid process is not well understood. Size, morphology and volume fraction of reinforcements have significant effects on the mechanical properties of the MMC, nevertheless, it is difficult to control the parameters of these reinforcements.
In this study, laser alloying using a carbon steel substrate pre-coated powder mixture of pure titanium and graphite was carried out, to form an FeTiC composite surface layer in the laser alloyed zone. TiC reinforced ferrous based composites were commercially used as wear resistant materials.8)
The purpose of this paper is to make clear the usefulness of laser alloying process and the effect of sizes and distribution of TiC in laser alloyed zones on wear resistance.
This paper describes single-pass laser alloying treatment. Multi-pass treatment is essential for practical use, however, evaluation of the laser alloyed zone becomes complicated due
to heat cycles in the multi-pass treatment. Multi-pass treatment will be discussed in another report.
2. Experimental Procedure
A medium carbon steel (JIS:S50C) was used as a substrate. Table 1 shows the chemical composition of the substrate. Graphite (99.7%) and titanium (99.9%) powder were used as additional materials. The average size of graphite particles was about 5 µm, and the maximum particle diameter of the titanium powder was about 45 µm. These powders were mixed at a ratio of 4.0 g Ti and 1.0 g graphite, using ethanol to obtain a pasty mixture. The paste was applied onto the surface of the substrate. The thickness of the pre-coated paste was 0.2 mm.
Laser alloying was carried out using a 1 kW continuous wave diode laser. The laser beam (spot size 1.0 mm) was scanned over the pre-coated powder mixture. The scanning speed was varied in the range of 2 to 10 mm·s¹1. Table 2 shows the laser alloying condition, and Fig. 1 shows the experimental setup.
[image:1.595.299.548.657.685.2]The microstructure and the composition of the laser alloyed zone were studied using optical microscopy, SEM/ EDS. X-ray diffraction using Cu K¡radiation was performed
Table 1 Chemical composition of substrate (mass%).
C Si Mn P S Fe
[image:1.595.306.549.727.786.2]0.51 0.22 0.66 0.014 0.006 Bal.
Table 2 Laser alloying conditions.
Laser power (P/W)
Spot diameter (D/mm)
Scanning speed (v/mm·s¹1)
Thickness of pre-coated powder mixture
(t/mm)
Ar shielding gasflow rate (/L·min¹1)
720 1 2, 5, 10 0.2 20
+Graduate Student, Osaka Prefecture University. Corresponding author,
E-mail: [email protected]
for phase identification. The details of TiC particles and substructure of the matrix were studied using scanning transmission electron microscopy (STEM, Hitachi HD2700). The samples for STEM observation were prepared by FIB (Hitachi FB2200).
Vickers micro-hardness measurements, using a load of 2.94 N, were carried out on a polished cross-section. Wear testing using a reciprocating wear tester was carried out, and profiles of the wear scars were measured using a contour form measuring instrument to evaluate the amount of wear after wear testing.
3. Results and Discussions
[image:2.595.313.541.69.403.2]3.1 Geometry of laser alloyed zone
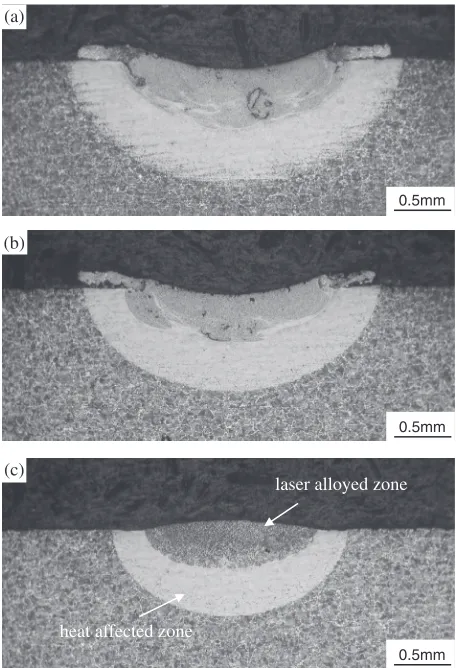
Figure 2 shows macrographs of the cross section of a specimen after laser alloying treatment for each scanning speed. The width of the laser alloyed zone was about 1.5 2.0 mm slightly larger than the laser beam diameter. The depth at the center of laser alloyed zone was about 0.40.6 mm. The area of the laser alloyed zone becomes smaller at a higher scanning speed because of lower heat input. The laser alloyed zone contains some voids, however, no cracks were observed. At the slower scanning speed, the surface depression was observed (Figs. 2(a) and 2(b)). It seems that the depression is due to the recoil pressure from evaporating metal coming from excessive heat input.9)However, the geometry of the molten pool is also affected by convection caused by various factors, so further studies will be needed.
3.2 Microstructure
From XRD analysis of the laser alloyed zone, the peak of TiC and iron (bcc) was observed (Fig. 3). No peak of other carbides such as Fe3C, or any intermetalic phase of iron and titanium was observed. The result of the XRD analysis confirms that an iron matrix composite reinforced with TiC can be produced using laser alloying treatment.
SEM/EDS analysis revealed that TiC particles were dispersed in the matrix. Figure 4 shows compositional images of the laser alloyed zone by SEM. In these black
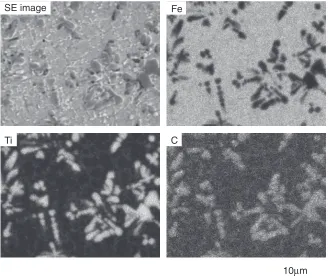
regions of compositional images, titanium and carbon were detected by EDS analysis. Figure 5 shows the secondary electron image and elements distribution measured by EDS in the laser alloyed zone. Figure 6 shows the EDS spectrum measured in the region of TiC. The atomic ratio C/Ti calculated from the X-ray peak intensity using the ZAF correction method is approximately 0.8.
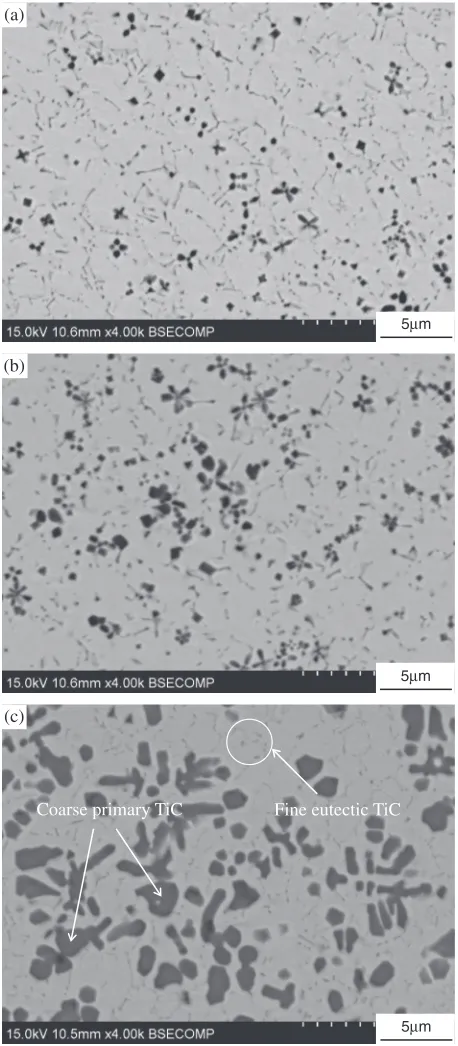
Various morphologies of TiC were observed. Relatively coarse particles (about 15 µm) exhibited dendritic,fl ower-like and a near-equiaxed shape. Fine particles of less than 1 µm were also observed. Thesefine particles exhibited rod-shape.
Scanning direction
Substrate
Pre-coated powder mixture of (Ti + graphite) Shield gas nozzle
Ar Laser
Laser alloyed zone High power
diode laser
Optical fiber
Collimation lens
Focusing lens
Molten pool
Fig. 1 Schematic illustration of experimental setup.
(a)
(b)
(c)
laser alloyed zone
heat affected zone
0.5mm 0.5mm 0.5mm
Fig. 2 Cross sections of samples (scanning speed (a) 2 mm·s¹1 (b) 5 mm·s¹1(c) 10 mm·s¹1).
30 40 50 60 70 80 90
2θ / degree
Intensity (a.u.)
Fe(bcc) TiC
[image:2.595.64.270.70.243.2] [image:2.595.318.534.450.604.2]As previously reported,10) FeTiC ternary alloy may be followed by FeTiC pseudo-binary eutectic system. It seems that the temperature of the melt pool during laser irradiation is high enough to obtain a single phase of liquid FeTiC. The formation mechanisms of TiC during solidification of the FeTiC melt can be classified into two types. One is primary carbide initially precipitated from the liquid phase, and the other is eutectic carbide formed by eutectic reaction of L¼ferrite+TiC. When the primary carbides grow in the liquid, the growth of carbide is not constrained. Primary carbides easily coarsen and exhibit a dendritic shape due to constitutional undercooling. The coarse TiC particles
[image:3.595.55.284.70.593.2]ob-served in this study were primary carbides, and thefine TiC particles were eutectic carbides.
Figure 7 shows the area fraction and the average particle size of TiC measured by image analysis using SEM images. With increase in scanning speed, the area fraction of TiC increased from 8 to 25%, due to the decrease in the amount of melting in the area of substrate.
As previously reported,11)fine TiC particles are useful for improving wear resistance. However, the size of TiC coarsens, with increase in scanning speed, despite the high cooling rate. According to the report of T. Z. Kattamis,12)in the solidification process of the FeTiC melt, the average TiC particle size decreases with increasing cooling rate for the same alloy composition. However, the average particle size also depends on the volume fraction of TiC; with increasing volume fraction, the average particle size coarsens. In the laser alloying process, to obtain a high cooling rate, it is effective to increase the scanning speed. However, the area fraction also increases at a higher scanning speed, hence, the average size coarsens. To make the particle size smaller, it is necessary to control laser irradiation conditions (including scanning speed, power and beam diameter) along with the amount of pre-coated powder mixture.
3.3 STEM observation
Figure 8 shows bright field STEM (BF-STEM) image. In this image, a lath-shaped martensite structure was observed. This is the typical microstructure of medium carbon steel quenched from an austenite phase. It seems that the laser alloyed zone was rapidly cooled due to heat being conducted to the substrate after laser irradiation, at a cooling rate in excess of the critical cooling rate for martensite trans-formation. As previously reported,13)typical morphologies of ferrous martensite are the lath and lenticular structures. In Fe C binary alloy, the morphology of the martensite structure depends on the carbon content; about 0.8 mass% C is the transition content of lath and lenticular structure. Lath martensite structure is observed under 0.8 mass% C, hence, the carbon content of the matrix of the laser alloyed zone was almost unchanged by laser alloying treatment.
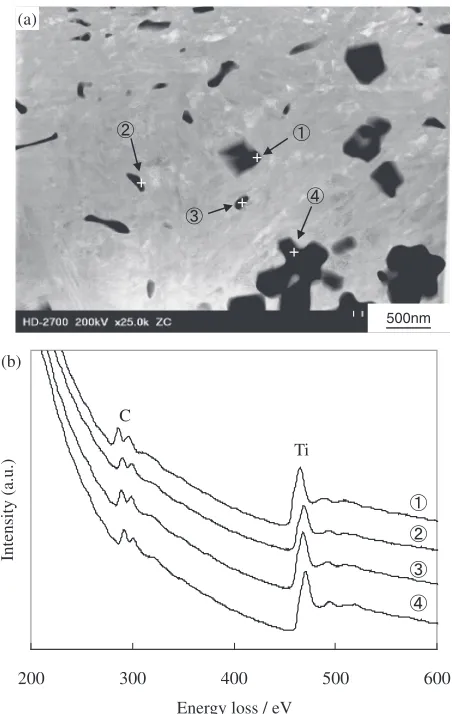
Figure 9(a) shows high-angle annular detector dark-field STEM (HAADF-STEM) image of the same area of Fig. 8. Compositional contrast can be obtained by HAADF-STEM image. Similar to SEM image, both coarse andfine particles were observed. Figure 9(b) shows electron energy-loss spectroscopy (EELS) results from precipitates in Fig. 9(a). From these results, no significant difference was observed, and each second phase particles were found to be TiC.
3.4 Hardness and wear property
Hardness measurement and wear testing were carried out to evaluate the mechanical properties of the laser alloyed zone. For comparison, the hardness and wear properties of the laser transformation hardened area of the same substrate were investigated. The conditions of laser transformation hardening were as follows: the laser beam diameter was 4.5 mm, laser power was 720 W and the scanning speed was 8 mm·s¹1.
Figure 10 shows the average value of the hardness of the laser alloyed zone. The hardness of the laser alloyed zone is Fine eutectic TiC
Coarse primary TiC (a)
(b)
(c)
5μm
5μm
5μm
over 800 HV. This value is higher than that of the laser transformation hardening area (about 750 HV). This high hardness was achieved by TiC particles dispersed in hard martensite matrix. With increasing scanning speed, the hardness slightly increased, because of the high area fraction of the TiC.
Wear testing was carried out using a ball-on-flat recip-rocating wear tester to investigate the wear property of laser alloyed zone. Figure 11 shows the wear amount measured by the profile of the wear scar after wear testing. With increasing scanning speed, the wear amount of laser alloyed zone decreased. The wear amount of laser alloyed zone was greatly decreased compared with the laser transformation hardened specimen. Even the laser alloyed zone formed at Fe
C Ti
SE image
10μm
Fig. 5 SE image and elements distribution measured by EDS in laser alloyed zone (scanning speed 10 mm·s¹1).
0.90 1.80 2.70 3.60 4.50 5.40 6.30 7.20 8.10 9.00 Ti Kα
Ti Kβ C Kα
Ti Lα
X-Ray energy / keV
Intensity (a.u.)
Fig. 6 EDS result from TiC particle in Fig. 5.
0 10 20 30 40 50
0 2 4 6 8 10 12
Scanning speed, v / mm·s-1
Area fraction /%
0 0.2 0.4 0.6 0.8 1
A
v
erage particle size
d
/
μ
m
Area fraction Average particle size
Fig. 7 Area fraction and average particle size of TiC measured by image analysis.
500nm
[image:4.595.135.463.70.348.2] [image:4.595.60.277.385.762.2] [image:4.595.62.278.398.575.2] [image:4.595.312.541.401.571.2]2 mm·s¹1exhibited good wear resistance, despite of the low area fraction of TiC. The TiC particles contained in the laser alloyed zone have a strong effect on improving the wear property.
4. Conclusion
Laser alloying using a carbon steel substrate pre-coated powder mixture of titanium and graphite to form an FeTiC composite surface layer, and microstructure of this composite layer was studied in detail.
TiC particles were dispersed in lath-martensite matrix. Coarse particles and fine particles of TiC were observed. Coarse particles exhibit various morphologies such as dendritic, flower-like and near-equiaxed shapes. With increase of the laser scanning speed, the area fraction and the size of TiC increase. Hardness and wear properties were improved as compared with laser transformation hardening of the same substrate area.
REFERENCES
1) ASM Handbook, Vol. 18, (AMS International, 1992) pp. 801811. 2) H. C. Man, S. Zhang, F. T. Cheng and T. M. Yue:Scr. Mater.44(2001)
28012807.
3) L. Dubourg, D. Ursescu, F. Hlawka and A. Cornet:Wear258(2005) 17451754.
4) H. Yan, A. Wang, Z. Xiong, K. Xu and Z. Huang:Appl. Surf. Sci.256 (2010) 70017009.
5) A. Emamian, S. F. Corbin and A. Khajepour:Surf. Coat. Technol.206 (2012) 44954501.
6) W. M. Steen:Laser Material Processing, third edition, (Springer, 2003) pp. 227278.
7) C. W. Draper and C. A. Ewing:J. Mater. Sci.19(1984) 38153825. 8) K. Das, T. K. Bandyopadhyay and S. Das:J. Mater. Sci.37(2002)
38813892.
9) O. Takayoshi, H. Inoue and K. Nishiguchi: Q. J. JWS9(1991) 501 506.
10) B. S. Terry and O. S. Chinymakobvu:Mater. Sci. Technol.8(1992) 399405.
11) E. Pagounis, M. Talvitie and V. K. Lindroos:Metall. Mater. Trans. A27 (1996) 41714181.
12) T. Z. Kattamis and T. Suganuma:Mater. Sci. Eng. A128(1990) 241 252.
13) T. Maki and I. Tamura:Bull. J. Inst. Metals13(1974) 329339.
200 300 400 500 600
Ti C
Energy loss / eV
Intensity (a.u.)
+ + +
+ (a)
(b)
500nm
Fig. 9 (a) HAADF-STEM image of laser alloyed zone, and (b) EELS results from precipitates numbered in (a) (scanning speed 10 mm·s¹1).
0 200 400 600 800 1000 1200
0 2 4 6 8 10 12
Scanning speed, v /mm·s-1
[image:5.595.57.283.68.425.2]Hardness, ( HV0.3)
Fig. 10 Average hardness measured in laser alloyed zone varied with laser scanning speed.
0 0.002 0.004 0.006 0.008 0.01 0.012 0.014 0.016
0 2 4 6 8 10 12
Scanning speed, v /mm·s-1
W
ear amount (mm
3 )
[image:5.595.321.535.71.222.2]laser transformation hardened sample
[image:5.595.62.277.481.629.2]