Refinement of Oxide Particles by Addition of Hf
in Ni-0.5 mass%Al-1 mass%Y
2O
3Alloys
Qingxin Tang
*1, Takeshi Hoshino
*2, Shigeharu Ukai, Bin Leng
*1,
Shigenari Hayashi and Yongming Wang
Material Science and Engineering, Faculty of Engineering, Hokkaido University, Sapporo 060-8626, Japan
The effect of adding minor elements, such as Ti, Mg, Zr, Ca or Hf, on the size of oxide particles was investigated in Ni-based ODS alloy, Ni-0.5 mass%Al-1 mass%Y2O3. Among these elements, Hf is the most effective at refining the oxide particles, particularly at a concentration of 0.8 mass% Hf, as verified by TEM observation and hardness measurement. X-ray diffraction measurements indicate that the formation of Y2Hf2O7is responsible for the refinement of oxide particles. The Hf is also effective for a commercial superalloy of PM1000.
[doi:10.2320/matertrans.M2010163]
(Received May 10, 2010; Accepted August 23, 2010; Published October 25, 2010)
Keywords: nickel-based alloys, oxide dispersion strengthened (ODS), mechanical alloying, oxide particle, hafnium
1. Introduction
Oxide dispersion strengthened (ODS) nickel-based alloys are promising materials for aerospace, industrial gas turbines and power industries because of their high mechanical strength, their resistance to corrosion and long-term creep resistance at high temperatures.1–4) These Ni-based ODS alloys can be created by using high-energy milling to deform mixtures of elemental or alloyed metal powders, known as mechanical alloying (MA). Powders made by MA are then usually consolidated by hot compaction or hot extrusion, followed by heat treatment or zone annealing to achieve the desired structure.5–7)
Y2O3is normally chosen as a dispersoid, which strength-ens Ni-based ODS alloys by pinning dislocations. However, instead of Y2O3, Y-Al oxide particles are present in Ni-based ODS alloys with added aluminium: yttrium aluminium garnet Y3Al5O12 (YAG), yttrium aluminium perovskite YAlO3 (YAP), yttrium aluminium monoclinic Y4Al2O9 (YAM) and yttrium aluminium hexagonal YAlO3 (YAH).8–10) The strength of these Ni-based ODS alloys cannot be improved by these Y-Al oxide particles with larger size, since their strength depends on both the oxide particle size and the mean distance between the particles. Thus particle refinement, reduction of the mean distance between particles and homogenizing the distribution of fine particles are essential for improving the strengths of Ni-based ODS alloys at higher temperatures. It was demonstrated in earlier studies that the addition of Hf is effective for oxide particle refinement in Fe-based ODS ferrite11) and Co-based ODS alloys.12)Based on these findings, the present paper focuses on refining oxide particles and on homogenizing their distribution by adding minor elements, including Hf into Ni-based ODS alloys.
2. Experimental Details
In order to investigate which elements facilitate the refinement of oxide particles, and at what concentration, minor elements that form more stable oxides and that have a lower free energy (FE) of oxide formation than Al2O3 at 1500 K were added to the base alloy (Ni-0.5Al-1Y2O3). Their compositions and their energies of oxide formation are listed in Table 1. We also prepared an alloy with the same composition as that of a commercial Ni-based superalloy PM1000, which is simply denoted as PM1000 in Table 1.
Ni, Al and Y2O3 powders were mixed in the Al2O3 crucible, together with the metal powders: Ti, Mg, Zr, Ca, and Hf, respectively, according to the compositions listed in Table 1. Each powder has a high mass purity of 99.9%. 0.7 mass% stearic acid was added as a process control agent to prevent the powders from sticking to the MA pot during the MA process. Then the powder mixtures were mechan-ically alloyed by a planetary ball mill (Fritsch P-6) in an argon atmosphere at a rotation speed of 400 rpm for 24 h, giving a ball-to-powder ratio of 10. The powders made by MA were consolidated by hot press (HP) at 1473 K under a compaction pressure of 10 kN for 3 h. HP processing was carried out in an argon atmosphere to prevent the oxidation of the powders. The Vickers hardness was measured with a Shimazu micro-Vickers indenter, HMV-2, under a load of 1 N. TEM specimens, cut from the hot-pressed bulk, were mechanically thinned to 0.15 mm. Then, a 3-mm-diameter disk was punched out of the thinned plate and polished with a TENUPOL device. Perchloric acid (HClO4) and 80 vol% acetic acid (CH3COOH) were used as electrolytic solution for twin-jet polishing, using a 40–120 mA electric current. TEM micrographs of the particles were taken with a JEOL JET-2000EX-T transmission electron microscope, using an acceleration voltage of 200 kV. Then, from the TEM images, the particle size was measured with the MacView software. X-ray diffraction (XRD) analysis was also carried out to indentify the oxide particles by means of Cu-Kradiation.
*1Graduate Student, Hokkaido University
*2Graduate Student, Hokkaido University. Present address: Hitachi Co.
3. Results and Discussion
3.1 Mean particle size and distribution
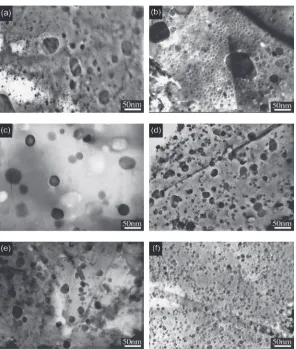
Figure 1 shows the TEM images of the base alloy with the different added elements. The study shows that these additions substantially change the particle size in the base alloy. Particles of the base alloy are shown in Fig. 1(a), which also shows the heterogeneous distribution of the oxide particles of different diameters. The addition of 0.4 mass% Ti
[image:2.595.48.550.84.257.2]gives a relatively homogenous distribution of oxide particles, although some lager particles (about 50 nm) can still be observed, as shown in Fig. 1(b). The addition of 0.7 mass% Mg results not only in a larger separation between oxide particles but also in a bigger particle size, as confirmed by Fig. 1(c). The addition of 0.4 mass% Zr (Fig. 1(d)) or 0.2 mass% Ca (Fig. 1(e)) results in fine oxide particles. However, the oxide particles are even finer and with a smaller particle separation with 0.4 mass% Hf, as shown in Fig. 1(f). Table 1 Chemical composition of 0.5 mass% Al Ni-based ODS alloys (mass%) and their free energy (FE) at 1500 K.
Ni Al Y2O3 Ti Mg Zr Ca Hf Cr Fe
FE (kJ/mol) — 800 — 700 830 835 900 880 — —
The base alloy Bal. 0.5 1
Model. 1 Bal. 0.5 1 0.4 — — — — — —
Model. 2 Bal. 0.5 1 — 0.7 — — — — —
Model. 3 Bal. 0.5 1 — — 0.4 — — — —
Model. 4 Bal. 0.5 1 — — — 0.2 — — —
Model. 5 Bal. 0.5 1 — — — — 0.4 — —
Model. 6 Bal. 0.5 1 — — — — 0.08 — —
Model. 7 Bal. 0.5 1 — — — — 0.8 — —
Model. 8 Bal. 0.5 1 — — — — 1.6 — —
Model. 9 Bal. 0.5 1 — — — — 3.2 — —
PM1000 Bal. 0.3 0.6 0.5 — — — — 20 3.0
PM1000-Hf Bal. 0.3 0.6 0.5 — — — 0.5 20 3.0
[image:2.595.151.447.280.629.2]Thus, of the five elements, Hf is the most effective in refining the oxide particles.
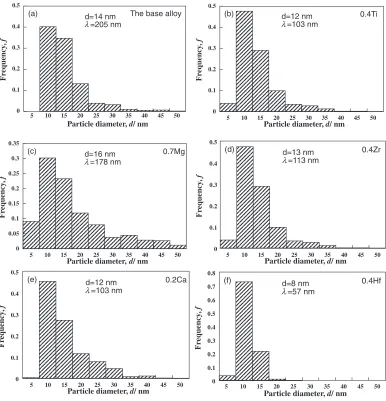
To confirm the above result, the particle size distributions, derived from the TEM micrographs, are shown in Fig. 2. The mean distance between particles (particle separation) can be derived as follows:13)
¼1:25ls2rs ð1Þ
ls¼ ffiffiffiffiffiffiffiffiffiffi 2rr3
3frr s
ð2Þ
rs¼
rr2
4 rr ð3Þ
where r is the particle radius obtained from the TEM micrographs,rris the average particle radius, andrr2andrr3are the averages ofr2andr3respectively. The fraction volume f of the dispersed oxide particles is taken to be 0.018 in the calculation. The average distance between the centers of dispersed particles islsand the average particle radius isrs. The particle sizedin Fig. 2 corresponds to2rs.
The base alloy has a mean particle sized¼14nm, which corresponds to ¼205nm as shown in Fig. 2(a). The addition of 0.4 mass% Ti, 0.4 mass% Zr and 0.2 mass% Ca
slightly reduces the mean particle size to 12 nm, 13 nm or 12 nm, respectively, with correspondingly shortened separa-tions of 103 nm, 113 nm or 103 nm. The addition of 0.7 mass% Mg, on the other hand, produces coarser particles, with a mean size of 16 nm and a significant proportion as large as 50 nm. In contrast, adding 0.4 mass% Hf yields very fine particles, with mean particle size 13 nm and separation 57 nm, the proportion of particles smaller than 10 nm being almost as high as 80%.
The above results suggest that Hf is the most promising minor element for particle refinement. In order to determine the optimal Hf concentration, various amounts of Hf were added into the base alloy. Figure 3 gives the resulting particle size and distributions. Compared with the base alloy, addition of Hf to 0.08 mass% reduces the particle size only slightly to 13 nm and the separation to 160 nm. Increasing the Hf content to 0.4 mass%, removes all the larger particles from the matrix and, moreover, clearly shortens the particle separation. This phenomenon is also seen with 0.8 mass% and 1.6 mass% Hf. Adding 0.8 mass% Hf gives the finest particles (7 nm), distributed homogeneously in the matrix, with most particles being less than 10 nm. In the case of 1.6 mass% Hf, the particle size is also fine at 8 nm with a 0 0.1 0.2 0.3 0.4 0.5 5 Fr equency , f
Particle diameter, d/ nm
The base alloy
(a) d=14 nm
λ=205 nm
0 0.1 0.2 0.3 0.4 0.5 0.4Ti (b) Fr equency , f
Particle diameter, d/ nm
d=12 nm λ=103 nm
0 0.05 0.1 0.15 0.2 0.25 0.3 0.35 0.7Mg (c) Fr equency , f
Particle diameter, d/ nm
d=16 nm λ=178 nm
0 0.1 0.2 0.3 0.4 0.5 0.4Zr (d) Fr equency , f
Particle diameter, d/ nm
d=13 nm
λ=113 nm
0 0.1 0.2 0.3 0.4 0.5 0.2Ca (e) Fr equency , f
Particle diameter, d/ nm
d=12 nm
λ=103 nm
0 0.1 0.2 0.3 0.4 0.5 0.6 0.7 0.8 0.4Hf (f) Fr equency , f
Particle diameter, d/ nm
d=8 nm
λ=57 nm
10 15 20 25 30 35 40 45 50
5 10 15 20 25 30 35 40 45 50
5 10 15 20 25 30 35 40 45 50
5 10 15 20 25 30 35 40 45 50
5 10 15 20 25 30 35 40 45 50 5 10 15 20 25 30 35 40 45 50
[image:3.595.106.492.71.472.2]separation of 61 nm, but a significant proportion of the particles are larger than 30 nm. Increasing the Hf concen-tration to 3.2 mass% gives coarser particles of size 11 nm and separation 100 nm.
Figure 4 summarizes the measurements of particle sepa-ration after adding the different elements. The addition of 0.8 mass% Hf gives the smallest particle separation, com-pared to Mg, Zr, Ca and Ti.
Based on the above results, we attempted to add 0.5 mass% Hf to the Ni-based alloy with the same nominal chemical composition as PM1000. As shown in Figs. 5 and 6, adding Hf reduces the mean particle size from 14 nm to 9 nm, and their separation to 97 nm.
3.2 Hardness test
Because the hardness usually varies linearly with the yield strength, hardness measurements are useful indicators of the alloy strength. Figure 7 shows the hardness plotted as a function of the particle separation. As shown in the figure, the hardness tends to increase with decreasing separation. 0.8 mass% Hf gives the optimum hardness, corresponding to the finest particles (7 nm). The measured hardness-separation relation demonstrates how the efficacy of alloy strengthening
by the dispersion of oxide particles improves with decreasing particle separation. This relation for PM1000 with and without 0.5 mass% Hf is slightly shifted toward the higher hardness value. The enhanced hardness in PM1000 is 0 0.1 0.2 0.3 0.4 0.5 0.6 5 0.08Hf (a)
Particle diameter, d/ nm
Fr
equency
,
f
d=13 nm λ=160 nm
0 0.1 0.2 0.3 0.4 0.5 0.6 0.7 0.8 0.4Hf (b) Fr equency , f
Particle diameter, d/ nm
d=8 nm λ=57 nm
0 0.1 0.2 0.3 0.4 0.5 0.6 0.7 0.8Hf (c) Fr equency , f
Particle diameter, d/ nm
d=7 nm
λ=53 nm
0 0.1 0.2 0.3 0.4 0.5 0.6 0.7 0.8 1.6Hf (d) Fr equency , f
Particle diameter, d/ nm
d=8 nm λ=61 nm
0 0.1 0.2 0.3 0.4 0.5 0.6 3.2Hf (e) Fr equency , f
Particle diameter, d/ nm
d=11 nm
λ=100 nm
10 15 20 25 30 35 40 45 50
5 10 15 20 25 30 35 40 45 50
5 10 15 20 25 30 35 40 45 50
5 10 15 20 25 30 35 40 45 50
5 10 15 20 25 30 35 40 45 50
Fig. 3 Particle size distribution of Ni-0.5Al-1Y2O3 after addition of different amounts of Hf (a) 0.08 mass%; (b) 0.4 mass%; (c) 0.8 mass%; (d) 1.6 mass%; (e) 3.2 mass%.
0 50 100 150 200 250 0 P a rticle separation, λ / nm
Concentration C (mass%) The base alloy
0.08Hf 0.2Ca 0.4Hf 0.8Hf 1.6Hf 3.2Hf 0.4Ti 0.4Zr 0.7Mg
0.5 1 1.5 2 2.5 3 3.5
[image:4.595.324.527.513.688.2]attributed to solid solution strengthening, resulting from the addition of Fe and Cr.
3.3 XRD analysis
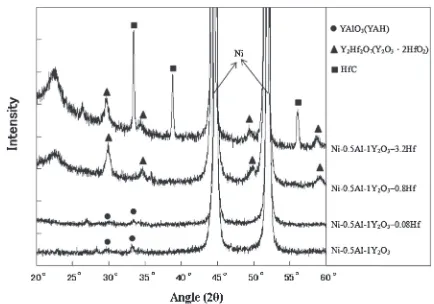
XRD analysis was used to investigate why the addition of Hf reduces the mean size and separation of oxide particles. The results are shown in Fig. 8. From the XRD patterns, complex compounds, rather than Y2O3were detected, which implies that Y2O3 is unstable during the MA process and reacts with other elements, forming new particles. YAH (YAlO3) was detected in the base alloy and in the alloy containing 0.08 mass% Hf. However, by further increasing the Hf content to 0.8 mass%, YAH disappears and Y2Hf2O7(Y2O32HfO2) is detected. This indicates that the
formation of Y2Hf2O7 is responsible for the refinement of oxide particles. When the Hf concentration is increased to 3.2 mass%, we identified HfC instead of Y2Hf2O7, leading to the emergence of larger particles. This could be due to excess Hf combining with carbon, a contaminant from the graphite die and carbon sheet during the HP process. Adding 0.8 mass% Hf yields the best result.
It was pointed out in a previous study that Y2O3 particles can dissociate during MA, and that the subsequent annealing induces the precipitation of stable oxide particles in Ni-based ODS alloy.14)It is thought that at 0.8 mass% Hf, Y and O were dissociated by MA, combined with Hf to form stable Y2Hf2O7 under HP conditions. The interface between Y2Hf2O7 particles and the Ni matrix could be coherent12) and results in a lower interfacial energy. Thus, the small particles would tend to precipitate homogeneously, impeding the growth of small particles by Ostwald Ripening.15) Fig. 5 TEM micrographs of (a) PM1000; (b) PM1000-0.5 mass% Hf.
0 0.05 0.1 0.15 0.2 0.25 0.3 0.35 0.4
5
PM1000 (a)
Fr
equency
,
f
Particle diameter, d/ nm
d=14 nm
λ=210 nm
0 0.1 0.2 0.3 0.4 0.5 0.6
PM1000−0.5Hf (b)
Fr
equency
,
f
Particle diameter, d/ nm
d=9 nm
λ=97 nm
10 15 20 25 30 35 40 45 50 5 10 15 20 25 30 35 40 45 50
Fig. 6 Particle size distribution of (a) PM1000; (b) PM1000-0.5 mass% Hf.
325 350 375 400 425 450 475 500
0
Particle separation, λ/ nm
W
ik
ers hardness,
HV
The base alloy
0.08Hf 0.7Mg 0.4Zr
0.4Ti
0.2Ca 3.2Hf 0.8Hf
0.4Hf
1.6Hf
PM1000-0.5Hf
PM1000
40 80 120 160 200 240
Fig. 7 Hardness of the base alloy (Ni-0.5Al-1Y2O3) after additions of various elements.
[image:5.595.148.448.73.184.2] [image:5.595.105.491.221.349.2] [image:5.595.317.534.385.537.2] [image:5.595.65.275.388.566.2]4. Conclusions
Our study of oxide particle refinement by the addition of various elements to 0.5 mass% Ni-based ODS alloys, with added Al leads us to the following conclusions:
(1) Among the elements investigated (Ti, Mg, Zr, Ca and Hf), Hf is the most effective at refining the particles and reducing their separation. Adding of Hf to a concentration of 0.8 mass% gives the base alloy (Ni-0.5Al-1Y2O3) the smallest mean particle size 7 nm and the shortest particle separation 53 nm. A Hf con-centration of 0.5 mass% reduces the mean particle size of PM1000 to 9 nm and the particle separation to 97 nm.
(2) The measured hardness shows a correlation with the particle separation, controlled by varying of the Hf concentration.
(3) The formation of Y2Hf2O7 is responsible for the refinement of oxide particles, probably due to the coherent interface between Y2Hf2O7and the Ni matrix.
Acknowledgement
The authors are grateful for financial support from an Iwatani Naoji Memorial Foundation Grant.
REFERENCES
1) J. S. Benjamin: Metall. Trans.1(1970) 2943–2951.
2) L. J. Park, H. J. Ryu, S. H. Hong and Y. G. Kim: Adv. Performance Mater.5(1998) 279–290.
3) Y. Estrin, M. Heilmaier and G. Drew: Mater. Sci. Eng. A272(1999) 163–173.
4) M. Nganbe and M. Heilmaier: Mater. Sci. Eng. A387–389(2004) 609–612.
5) C. Capdevila and K. D. H. Bhadeshia: Adv. Eng. Mater.3(2001) 647– 656.
6) M. Mujahid and J. W. Martin: J. Mater. Sci. Lett.13(1994) 153–155. 7) H. R. Sandim, A. O. Hayama and D. Raabe: Mater. Sci. Eng. A430
(2006) 172–178.
8) P. Grahle and E. Arzt: Acta Mater.45(1997) 201–211.
9) G. B. Schaffer, M. H. Loretto, R. E. Smallman and J. W. Brooks: Acta Metall.37(1989) 2551–2558.
10) A. O. F. Hayama, H. R. Z. Sandim, J. F. C. Lins, M. F. Hupalo and A. F. Padilha: Mater. Sci. Eng. A371(2004) 198–209.
11) T. Furukawa, S. Ohtsuka, M. Inoue, T. Okuda, F. Abe, S. Ohnuki, T. Fujisawa and A. Kimura: Proc. Int. Conf. on Advanced Power Plant, Tokyo, Japan, May 10–14 (2009) Paper 9221.
12) L. Zhang, S. Ukai, T. Hoshino, S. Hayashi and X. H. Qu: Acta Mater. 57(2009) 3671–3682.
13) J. W. Martin:Micromechanisms in Particle-Hardened Alloys, (Cam-bridge University, 1980).
14) T. Hoshino, S. Ukai and S. Hayashi: Heat Treat. Surf. Eng. (2009) 643–646.