Property-Control of TiNi System Intermetallics and Their Characteristics
Kazuhiro Matsugi
*, Takahiro Kashiwagi, Yong-Bum Choi and Gen Sasaki
Department of Mechanical Science and Engineering, Graduate School of Engineering, Hiroshima University, Higashi-Hiroshima 739-8527, Japan
The martensitic transformation temperature in addition to the tensile strength and oxidation resistance, were able to be estimated in the crystal structure map using both parameters of the bond order and d-orbital energy level of elements, for the design of TiNi shape memory compounds. The ternary TiNi–(Cr, Re, Fe, Cu, Al) intermetallics having the objective constructed phase, tensile strength, Ms-temperatures and oxidation resistance, were obtained successfully, by the adjustment of both parameters. It is found that the effectiveness of the d-electrons concept could be judged, for property-control of ternary TiNi intermetallics, as well as metallic materials.
[doi:10.2320/matertrans.F-M2011827]
(Received April 5, 2011; Accepted September 7, 2011; Published November 16, 2011)
Keywords: ternary alloy systems, alloy design, cold crucible levitation melting, phase stability, shape-memory alloy application
1. Introduction
Among various shape memory alloys, TiNi alloys are the most commercially exploited ones because of their superior shape memory effect and super-elasticity, better mechanical properties, higher corrosion resistance and excellent bio-compatibility.1–3) These properties depend greatly on the exact chemical composition, processing history and small-ness of undesirably dissolved elements.4) Traditionally, the temperature interval of Ti-50 mol%Ni was observed at cryogenic and environmental temperatures. In contrast, currently, the high operation temperature more than 343 K is required even in home electric appliances, as the application of TiNi system. Further, high strength and oxidation resistance in manufacturing process are also required for current application of TiNi.4)
In most cases, methods for the TiNi development are largely dependent on the trial-and-error experiments and some empirical rules. Therefore, the development is so inefficient and also expensive. In order to save cost and time necessary for alloy development, more fundamental approaches based on the solid theory are needed. It is considered that the d-electrons concept proposed by Morinagaet al.5)is one of fundamental approaches. In fact, the high performance metallic materials such as Ni, Ti, Al, Mg and Fe-based alloys, etc.6–10) had been developed successfully, by the d-electrons concept. Therefore, the d-electrons concept may be applied to design of TiNi intermetallic compounds.11)
Titanium and its alloying elements are difficult to be combined uniformly in composition as a solid alloy using usual furnaces like arc or induction melting furnaces, because molten Ti is very chemically reactive at high temperature. To resolve these problems, utilization of the cold crucible levitation melting (CCLM) is very useful.12–14) The alloys can be melted under untouched condition between the melt and melting crucible, which leads to no contaminant from melting crucible. Moreover, titanium alloys with uniform composition can be produced independently from the
differ-ence in specific gravity or melting point between titanium and its alloying elements, by the diffusion mixing effect of strong stirring due to an electromagnetic force.
In this study, for TiNi intermetallics with ternary alloying elements, the d-electrons concept was also applied to prediction of their (1) tensile strength, (2) transformation temperature and (3) oxidation resistance, as well as the metallic materials. These properties were experimentally measured for the proposed compounds produced by the CCLM technique for the optimization of manufacturing process. Their measured values were compared with their predicted ones, and using the result of this comparison, the effectiveness of this concept was investigated for the property control of TiNi intermetallics.
2. Determination of Compositions of TiNi-Y (Y:
Ternary Alloying Elements)
2.1 Parameters used in d-electrons concept
Two calculated parameters are mainly utilized in the d-electrons concept.5,6) The one is the d-orbital energy level (Md) of alloying transition elements, and the other is the bond order (Bo) that is a measure of the covalent bond strength between atoms. The values of the parameters for each element which were calculated on octahedral cluster model (M2X4, M: alloying elements, X: Ti, using as M-Ti
compounds), are listed in Table 1.15,16)
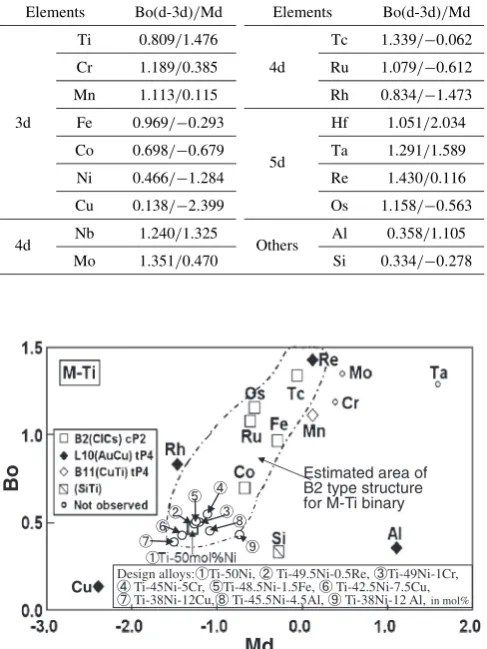
The structure map for the M-Ti compound is constructed using the Bo and Md, as shown in Fig. 1. The crystal structure data of intermetallic compounds are taken from the Pearson’s Handbook.17)Each crystal structure is distin-guished from others using different symbols on the map. The region for B2-type compound may be estimated using the dashed line in Fig. 1. The Md and Bo values of Ti-50 mol%Ni are1:284and 0.466, respectively.
Some properties such as tensile strength, phase stability and plastic deformation mode had been also represented in the Md and Bo diagram as well as the crystal structure, for practical Ni and Ti-based alloys, etc.7,18,19)In the beginning of this alloy design, both values in the tensile strength and the temperature in start for martensite transformation
temperature) of previously reported TiNi compounds,20–30) were represented in the Md and Bo diagram, in order to predict their values of designed intermetallics, as described in the following section 2.2 and 2.3. In addition to binary compounds, ternary (or more multi-components) com-pounds, for example, (M1xYx)Ti are also located on the
Md and Bo map, simply taking the compositional average of the Bo and Md parameters.11)Namely,
Bo¼ ð1xÞðBoÞMþxðBoÞY ð1Þ
Md¼ ð1xÞðMdÞMþxðMdÞY ð2Þ
2.2 Prediction of tensile strength
Fifty reported TiNi compounds of compositional range (Ti- [2549]Ni- [011]Rh- [05]Ta- [02 ]Mo-[025]Mn- [03]Co- [06]Fe- [012]Al- [014 ]Si-[05]Cr) in mass%,20–30)are plotted in the Md-Bo map, as shown in Fig. 2. This figure is duplicated from the estimated region for B2 type structure near Ti-50 mol%Ni in Fig. 1. The contour lines showing the ultimate tensile strength level of these TiNi system compounds are also estimated by dotted lines, as seen in Fig. 2. The minimum value (350 MPa) of ultimate tensile strength is shown on Ti-50 mol%Ni, and the contour lines can be approximated as a circle. The tensile strength increases, as the both values of Bo and Md increase in this figure. It is considered that Fe, Mn, Cr, Re, Mo and
Os, etc. of higher Bo and Md values showing in Fig. 1, are promising elements for the improvement of strength property.
2.3 Prediction of Ms-temperature
The contour lines showing the Ms-temperature of these compounds are estimated by dotted lines, as seen in Fig. 3. The temperature is 298 K for Ti-50 mol%Ni. The Ms-temperatures can be approximated depending on Md value mainly, which means the control of Ms-temperatures by the adjustment of Md values. The Md-controll is caused by the addition of the suitable alloying elements in TiNi-Y. Namely, it is considered that the addition of Al and Cu having higher and lower Md values results in decrease and increase of Ms-temperatures, respectively.
2.4 Prediction of oxidation resistance
It is well known that for pure metals activation energies for self-diffusion are proportional to the melting points of the Md
Bo Estimated area of B2 type structure
for M-Ti binary
Design alloys: Ti-50Ni, Ti-49.5Ni-0.5Re, Ti-49Ni-1Cr, Ti-45Ni-5Cr, Ti-48.5Ni-1.5Fe, Ti-42.5Ni-7.5Cu, Ti-38Ni-12Cu, Ti-45.5Ni-4.5Al, Ti-38Ni-12 Al, in mol% Cu
Fig. 1 The Bo-Md structure map15,16) for the M-Ti compounds. Crystal structures are denoted using the Structurbericht symbol and also the Pearson’s symbol.
Tensile strength contour : 800MPa
400
MP
a
0.35 0.40 0.45 0.50 0.55 0.60
-1.65 -1.25 -0.85 -0.45
Md
Bo
600MPa
Ti Ti--50mol%Ni50mol%Ni
(340MPa) (340MPa)
Not reported > 800MPa 700~800MPa 600~700MPa 500~600MPa 400~500MPa < 400MPa Tensile strength TiNi
TiNi--5mol%Cr(840MPa)5mol%Cr(840MPa)
TiNi
TiNi--7.5mol%Cu(490MPa)7.5mol%Cu(490MPa)
TiNi
TiNi--12mol%Cu(480MPa)12mol%Cu(480MPa) TiNi
TiNi--4.5mol%Al4.5mol%Al (340MPa) (340MPa) TiNi
TiNi--1mol%Cr1mol%Cr
(585MPa
(585MPa))
TiNi
TiNi--1.5mol%Fe1.5mol%Fe (490MPa) (490MPa)
Fig. 2 The Bo-Md map showing the location of the TiNi system compounds reported by various investigators and contour lines of their ultimate tensile strength. Also, the indication of the compositional location and tensile strength of seven intermetallic compounds designed in this study.
Ms-temperature Above 300K 299~270K 269~250K 249~220K Below 219K
0.35 0.40 0.45 0.50 0.55 0.60
Bo
Ti
Ti--50Ni 50Ni
(298K)
(298K)
220K
TiNi
TiNi--12Cu (333K)12Cu (333K) TiNi
TiNi--7.5Cu (313K)7.5Cu (313K)
TiNi
TiNi--4.5Al 4.5Al (250K)
(250K)
TiNi
TiNi--1.5Fe1.5Fe
(277K)
(277K)
TiNi
TiNi--5Cr5Cr
(263K)
(263K)
240K
-1.65 -1.25 -0.85 -0.45
Md 300K 270K
Ms-T
emp
. :
TiNi
TiNi--1Cr1Cr (281K)
(281K)
TiNi
TiNi--0.5Re 0.5Re (282K)
(282K)
TiNi
TiNi--12Al12Al
(Not observed) (Not observed)
[image:2.595.311.548.74.238.2]Fig. 3 The Bo-Md map showing the location of the TiNi system intermetallics reported by various investigators and contour lines of their Ms-temperatures. Also, the indication of the compositional location and Ms-temperatures of eight intermetallic compounds designed in this study. Table 1 Bo and Md values for elements.15;16Þ
Elements Bo(d-3d)/Md Elements Bo(d-3d)/Md
Ti 0.809/1.476 Tc 1.339/0:062
Cr 1.189/0.385 4d Ru 1.079/0:612
Mn 1.113/0.115 Rh 0.834/1:473
3d Fe 0.969/0:293 Hf 1.051/2.034
Co 0.698/0:679
5d Ta 1.291/1.589
Ni 0.466/1:284 Re 1.430/0.116
Cu 0.138/2:399 Os 1.158/0:563
4d Nb 1.240/1.325 Others Al 0.358/1.105
[image:2.595.47.293.84.222.2] [image:2.595.48.292.86.411.2] [image:2.595.311.546.323.485.2]metals.31) As the melting point of metals is probably proportional to Bo, the activation energy may be related to Bo. It had been reported that the activation energies for the impurity diffusion in metals also correlate with Bo.32) Moreover, some oxides consisting of Cr or Re show excellent oxidation resistance at high temperatures.33)The Cr and Re additions in the region for B2-type, are promising due to the higher values in Bo, as shown in Fig. 1.
2.5 Compositions of proposed alloys
The target regions of the tensile strength and Ms-temper-ature for alloy design can be specified concretely on the Bo diagram, as shown in Figs. 2 and 3. Once a specific Md-Bo region and a specific alloy system are set in the map, the corresponding alloy composition is simply determined following the rule of the vector sum.18)
The Ti-49 mol%Ni-1 mol%Cr and Ti-45 mol%Ni-5 mol%Cr has been designed for the achievement of the high strength of 500 and 800 MPa, respectively,11)compared with Ti-50Ni, in the specific Md-Bo region shown in Fig. 2. Hereafter, unless otherwise noted, compound-compositions are referred to in mole per cent. In contrast, the Ti-48.5Ni-1.5Fe is also designed for the tensile strength of 500 MPa, using Fe of ubiquitous elements. The Cr addition in Ti-50Ni has been investigated empirically to obtain good mechanical and transformation properties.34,35)The relation between the shape memory ability and damaged layer in the manufactur-ing process, was also investigated for practical application of Cr containing TiNi.36)
In contrast, Ti-38Ni-12Al, Ti-45.5Ni-4.5Al, Ti-49.5Ni-0.5Re, Ti-42.5Ni-7.5Cu and Ti-38Ni-12Cu compounds are also designed for the achievement of the various Ms-temperatures of 220, 250, 280, 310 and 320 K, respectively, in the specific Md-Bo region shown in Fig. 3. The control of Ms-temperatures leads to the achievement of the high operation temperature more than 343 K.
The Cr or Re addition in Ti-50Ni may result in the good oxidation resistance. The nominal compositions of exper-imental intermetallic compounds proposed in this study are listed again in Table 2. The alloy numbers in this table correspond to ones of compositional locations of experimen-tal compounds in Fig. 1. In this study, after the determination of alloy compositions, the values of the (1) tensile strength (2) Ms-temperature and (3) oxidation amount which were
experimentally measured for nine intermetallics produced by CCLM, were compared with their predicted ones in Figs. 2 and 3.
3. Experimental Procedures
All ingots of experimental compounds in this study were prepared from raw materials of pure Ti, Fe, Al, Cr, Re and Ni with 99.7, 99.9, 99.9, 99.9, 99.96 and 99.3 mass%, respec-tively, by the CCLM under the atmosphere of argon gas with purity of 99.99%. Each element was inserted in the copper melting crucible with 150 cm3 consisting of 24 segments.
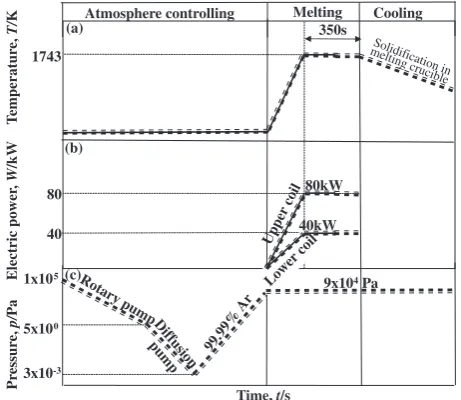
The alloys can be melted under untouched condition between melt and melting crucible, which leads to no contaminant from the melting crucible. Figure 4 shows profiles of temperature in molten metal, electric power in upper and lower coils and pressure in atmosphere of a furnace-chamber. The temperature was directly measured by insertion of thermocouples in molten metals. The higher temperature of 1743 K after the melting of each raw material was kept for 300 s in melting process, for enough mixing of molten metals. Molten metals were solidified in the copper melting crucible after switching off electric power after the melting process. Chemical compositions of to¨ alloys listed in Table 2 were defined to be Ti-54.9Ni, Ti-53.5Ni-1.7Re, 53.6Ni-1Cr, 49.8Ni-5Cr 53.5Ni-1Fe, 45.9Ni-9Cu, Ti-41.7Ni-13.4Cu, Ti-51.4Ni-2.4Al and Ti-45Ni-6.2Al, in mass%. Contents of impurities such as oxygen, carbon and nitrogen in the Ti-50Ni prepared by the CCLM, were 0.046, 0.009 and 0.004 mass%, respectively. The contents of gaseous impurities of oxygen and nitrogen were lower than those (oxygen and nitrogen: 0.069 and 0.006 mass%, respec-tively) in the raw materials, because of highly vacuum level as shown in Fig. 4.
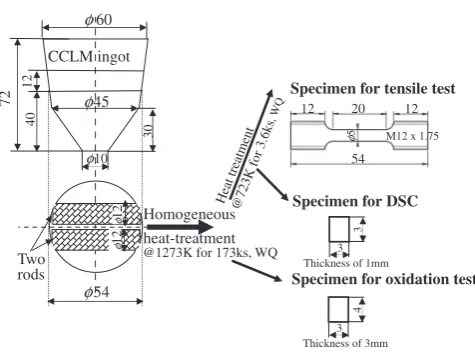
[image:3.595.311.542.73.273.2]Two rods with a diameter of 12 mm and length of 54 mm were cut from fixed position in one CCLM ingot by wire electro-discharge machining, EDM, in ion-exchanged water, as shown Fig. 5. All rods were homogeneously heat-treated Table 2 Nominal compositions of experimental intermetallic compounds
proposed in this study.
Alloy numbers Compositions (mol%) Bo Md
Ti-50Ni 0.466 1:284
` Ti-49.5Ni-0.5Re 0.476 1:270
´ Ti-49Ni-1Cr11Þ 0.480 1:251
ˆ Ti-45Ni-5Cr11Þ 0.538 1:117
˜ Ti-48.5Ni-1.5Fe 0.481 1:254
¯ Ti-42.5Ni-7.5Cu 0.417 1:451
˘ Ti-38Ni-12Cu 0.387 1:552
˙ Ti-45.5Ni-4.5Al 0.456 1:069
¨ Ti-38Ni-12Al 0.440 0:711
Atmosphere controlling Melting Cooling
T
emperatur
e,
T/
K
Pr
essur
e,
p/
Pa
Time, t/s
3x10⁻³
5x100
1x10⁵ Ro
tar y pump
99.9 9% Ar
9x10⁴Pa
80
40
80kW 1743
Electric po
wer
,
W
/kW
350s
Lower coil 40kW Upp
er c oil (a)
(b)
(c)
Diffusion pump
Solidif ication in melting
crucible
[image:3.595.46.291.94.234.2]at 1273 K for 173 ks in an argon stream and water-quenched for the performance of all following experiments. Trans-formation behavior was investigated by differential scanning calorimetry (DSC) in the temperature range from 193 to 373 K at rate of 5 K/min in a nitrogen stream. Specimens for tensile tests were heat-treated at 723 K for 3.6 ks in an argon stream and water-quenched, for the occurrence of shape memory ability. Tensile tests were conducted on selected specimens with gauge diameters of 5 mm and gauge lengths of 20 mm, at room temperature under an initial strain rate of 5:0104s1in air. Oxidation tests at 1273 K were carried
out by a thermo-gravimetric method which meant measure-ments of weight gain of the specimens exposed in air for 72 ks. Size of the oxidation specimen was 334mm. X-ray diffraction (XRD) analysis employing nickel filtered Cu-K radiation was performed for phase identification.
4. Results and Discussion
4.1 Microstructures and effects of CCLM
Some XRD patterns of experimental alloys heat-treated at 1273 K for 173 ks are shown in Fig. 6. The Cr-, Re-, Fe-added TiNi and Ti-50Ni had B2 or B2 and B190 type structures, depending on Ms-temperatures which were shown below or above room temperature, respectively. In contrast, TiNi-12Cu or TiNi-12Al had also B19 type structure or both AlNi2Ti and Ti2Ni phases, respectively, in addition to B2.
Three phases of B2, B190and Ti
2Ni were identified on
TiNi-4.5Al at the room temperature, although this composition showed the mono phase of B2 at 1273 K.37)
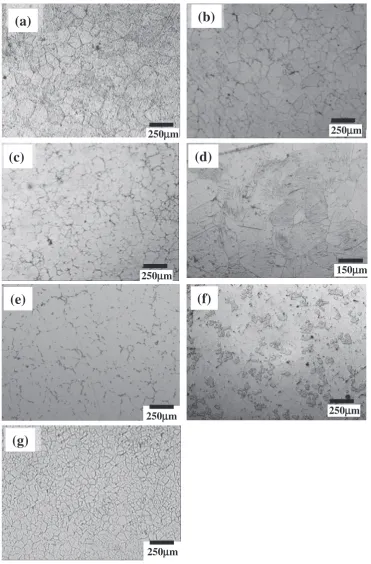
For Ti-50Ni, 1Cr, 5Cr, 1.5Fe, TiNi-12Cu, TiNi-12Al and TiNi-0.5Re alloys, their homogene-ously heat-treated microstructures are shown in Fig. 7, their grain sizes are 105, 90, 75, 90, 120, 85 and 60mm respectively. These microstructures corresponded to the identified phases obtained from their XRD results. Eight experimental alloys listed in Table 1 had the B2 type structure, regardless of kinds and amount of ternary micro-alloying elements, except for the TiNi-12Al alloy with the
Ti2Ni and AlNi2Ti phases as shown in Fig. 6. As shown in
Fig. 1, the ternary alloys in this study are located in the estimated region of B2 type structure on the structure map which is constructed using Bo and Md for the 3d transition-metal based compound (MTi, M: binary alloying ele-ments).15,16) Any intermetallic compound has more than two sublattices in crystal. So, when a third element is added into the compound, it is first necessary to take into account the substitutional site of the element, and hence attention is directed toward this substitutional problem. It is found that the structure map of binary M-Ti can be also applied for ternary NiTi-Re, -Fe, Cu and -Cr compounds with compo-sitions proposed in this study, although above substitutional problem can not be clarified for ternary alloying elements.
The XRD pattern of the as-cast TiNi-5Cr is compared with that of the heat treated one, as seen in Fig. 6(d) and (e). Same XRD patterns were observed between both conditions, which meant the better homogenization of molten metal by the diffusion mixing effect of CCLM even for addition of Cr with higher melting temperatures and densities, compared with other techniques such as induction and arc skull meltings.38) Contents of impurities such as oxygen, carbon and nitrogen in the Ti-50Ni prepared by the CCLM, were 0.046, 0.009 and 0.004 mass%, respectively, as described in chapter 3. The contents of gaseous impurities of oxygen and nitrogen were lower than those (oxygen and nitrogen: 0.069 and 0.006 mass%, respectively) in the raw materials. In contrast, there was the same value (0.009 mass%) of the carbon content between the TiNi alloy and raw material. This content of carbon in TiNi is lower than that (0.07 mass%) in TiNi alloys prepared by vacuum induction melting in the graphite crucible.39)Moreover, it is found from the contents of impurities that the cleanly molten metals were created by utilization of CCLM without the reaction between the molten metal and water-cooled copper crucible, although the affinity of Ti with oxygen, carbon and nitrogen was strong.
4.2 Transformation temperatures
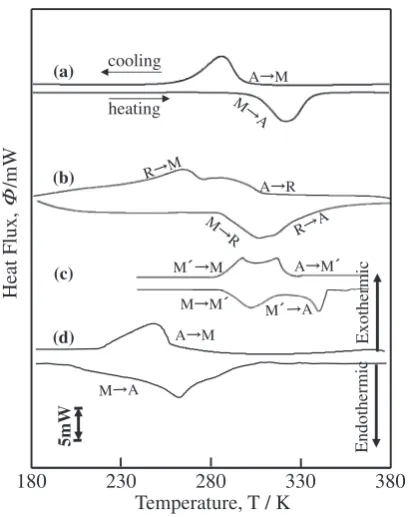
Figure 8 shows the typical DSC curves of TiNi, TiNi-1Cr, TiNi-7.5Cu and TiNi-4.5Al alloys. Upper and lower lines represent the exothermic and endothermic curves,
respec-φ60
φ10
φ45
12
φ
12
40
72
φ54
30
Homogeneous heat-treatment
54 20
12 12
M12 x 1.75
φ
5
@1273K for 173ks, WQ
Specimen for tensile test
He at treatment
@723K for 3.6ks
, W Q
Specimen for oxidation test
3
4
Thickness of 3mm
Specimen for DSC
φ
12
φ
12
Two rods
CCLM ingot
3
3
Thickness of 1mm
Fig. 5 Schematic representations of the CCLM ingot, showing the cut position of two rods with 12 mm diameter and 54 mm length for some specimens such as tensile, oxidation, DSC and microstructure evaluation. Dimensions are given in millimeters.
(a)
(b)
(c)
(d)
(e)
Intensity
, arbitrary unit
AlNi2Ti
40 50 60
Diffraction angle (CuKα), 2θ / π /180rad
B2 B19’
B19’ B2
(f)
(g) B19
Ti2Ni
[image:4.595.50.288.68.246.2] [image:4.595.320.533.71.234.2]tively. In Ti-50Ni, the transformation on cooling and heating curves occurred in one step from austenite to B190martensite (A to M) and from martensite to austenite (M to A), respectively. In contrast, two-step transformations on heating and cooling curves were observed on Cr, Fe and Re containing alloys. Two steps on heating correspond to the reverse transformations of martensite to R phase (M to R) and R phase to austenite (R to A). Moreover, two steps on cooling correspond to austenite to R phase (A to R) and R to M
transformations. Whereas two transformations on cooling were separated, two reverse transformations on heating overlapped, making it impossible to measure the finish of the M to R transformation and the start of the R to A transformation. For TiNi-7.5Cu, two-step transformations on heating and cooling curves were observed at higher temperature range. Two steps on heating corresponded to the reverse transformations of B190to B19 phase (M to M0) and M0 phase to austenite (M0 to A). Whereas, two reverse
250μμm
(f)
150μm
(d)
250μm
(e)
(b)
250μm
(c)
250μm
(a)
250μm
(g)
250μm
[image:5.595.112.484.70.635.2]transformations overlapped on cooling. Further, the similar transformation behavior to Ti-50Ni was also observed in TiNi-4.5Al. The measured temperatures (Ms, Mf, As and Af) for B190 martensite and austenite transformation were summarized in Table 3. Also, Ms-temperatures of experi-mental compounds are indicated in Fig. 3. It is found that Ms-temperatures of designed compounds accord with the estimated contour line for ones. This result agrees with the indication for Ms-temperatures of titanium alloys, by both Bo and Md parameters estimating the stability of phase and solubility of alloying elements.5)
4.3 Tensile properties
The stress-strain curves showing the shape memory ability are shown in Fig. 9, for Ti-50Ni, TiNi-0.5Re, TiNi-1.5Fe, TiNi-1Cr, TiNi-7.5Cu and TiNi-12Cu alloys. Their speci-mens were strained up to 2% and then the applied stress was released, because of the ability of strain gauges used in this
study. Strains of approximately 1.2 to 1.8% remained after releasing the applied stress on experimental alloys. More-over, the rest deformation was recovered with heating above Af (austenite finish) temperatures listed in Table 2. Re-mained strains of 0.07 to 0.55% were observed as indicated in each parenthesis in Fig. 9, even after heating above Af temperatures. It is considered on the basis of the results of shape-memory ability that the alloy design can be carried out successfully in the estimated region showing B2 type structure as seen in Fig. 1.
Tensile tests to failure were conducted on Ti-50Ni, TiNi-1.5Fe, TiNi-1Cr, TiNi-5Cr, TiNi-4.5Al, TiNi-7.5Cu and TiNi-12Cu alloys. Figure 10 shows the true stress-strain curves obtained from these designed intermetallics. Ti-50Ni showed the finally fracture-stress and -elongation of approx-imately 350 MPa and 13%, respectively. All ternary alloys showed higher fracture-stress and -elongation than binary TiNi, although tensile tests of Al added alloys were interrupted before completely plastic deformation because of the formation of undesirable AlNi2Ti and Ti2Ni phase
as shown in Figs. 6 and 7. Also, fracture stress or tensile strength of experimental alloys is also indicated in each parenthesis in Fig. 2. The strength of ternary TiNi-X alloys was controlled by the adjustment of both parameters of Bo and Md. It is found that tensile strength of designed intermetallic compounds accord with the estimated contour line for the tensile strength, see Fig. 2. The choice of the high and highly absolute values in Bo and Md in the B2 area,
Heat Flux,
Φ
/mW R M A R
R A
M R
A M
M A
5mW
A M
M A
M M
M M
180 230 280 330 380
Temperature, T / K (b)
(c)
(d) Exothermic
Endothermic
cooling
heating
A M M
A (a)
[image:6.595.67.272.70.329.2]Fig. 8 DSC curves obtained from (a) 50Ni, (b) 49Ni-1Cr, (c) Ti-42.5Ni-7.5Cu and (d) Ti-45.5Ni-4.5Al intermetallic compounds.
Table 3 Some transformation temperatures of experimental intermetallic compounds.
Intermetallic Transformation Temperatures [K]
compounds Ms Mf As Af
Ti-50Ni 298 263 300 337
Ti-49.5Ni-0.5Re 291 258 288 335
Ti-48.5Ni-1.5Fe 277 201 282 326
Ti-49Ni-1Cr 281 217 284 349
Ti-45Ni-5Cr 263 205 274 324
Ti-42.5Ni-7.5Cu 313 289 310 353
Ti-38Ni-12Cu 333 312 324 343
Ti-45.5Ni-4.5Al 250 223 187 297
0 50 100 150 200 250 300
0 0.5 1.0 1.5 2.0
Strain, ε (%)
Str
ess,
σ
/MP
a
Ti-50Ni (0.07*)
TiNi-1.5Fe (0.47*) TiNi-0.5Re (0.37*)
TiNi-1Cr (0.36*)
TiNi-7.5Cu (0.48*)
TiNi-12Cu (0.55*)
Fig. 9 Stress-strain curves showing the shape memory ability for six experimental intermetallic compounds.Values of retained strain at 293 K after the heating above Af.
TiNi-7.5Cu TiNi-5Cr
TiNi-1Cr
TiNi-1.5Fe
Ti-50Ni TiNi-12Cu
TiNi-4.5Al
0 200 400 600 800 1000
0 5 10 15 20
Strain,ε(%)
Str
ess,
/ MP
a
σ
25
[image:6.595.320.533.74.211.2]Failure
[image:6.595.321.533.278.400.2] [image:6.595.46.291.402.543.2]respectively, compared with those (Bo: 0.466, Md:1:284) of Ti-50Ni, is promising, because Bo and Md correspond to covalent bond strength between atoms and the degree of solid-solution hardening or solubility of alloying elements.
4.4 Oxidation resistance
The results of oxidation tests at 1273 K are shown in Fig. 11 for ternary elements-added alloys. The ratio of weight gain to the initial weight of specimens increased as exposed period increased, in all alloys. The accelerated oxidation curves of TiNi, 0.5Re, 4.5Al and TiNi-7.5Cu alloys, showed the complicated shape showing several plateaus. The oxidation was severe initially, settled down for a while, and then was catastrophic again. The severe and moderate oxidation took place alternately, which meant formation of porous TiO2 and TiO oxides at the interface
between alloys and air, and their exfoliation. This agrees with the previously open literature.40) In contrast, the simply oxidation curves without a plateau were obtained on both TiNi-Cr alloys with 1 and 5Cr, which meant formation of densely Cr2O3 oxide. For TiNi-5Cr, the almost constant
value was shown in the weight gain after 72 ks, which was caused due to the increase of continuously Cr2O3oxide films.
Moreover, TiNi-5Cr showed the excellent oxidation resist-ance and its weight gain after 72 ks was approximately 30%, compared with Ti-50Ni.
The apparent activation energy for the initial oxidation of Ti-50Ni was estimated to 180 kJ/mol which was close to that (183 kJ/mol)41) of oxidation in Ti-2.6Al. In contrast, the values in the apparent activation energy for oxidation of TiNi-5Cr and pure Cr were estimated to 200 kJ/mol in this study and reported to 245 kJ/mol,42) respectively. Cr
2O3
oxide films are effective for the suppression of oxygen-diffusion toward TiNi-Cr alloys, because the activation energy of TiNi-5Cr was estimated as the value between those of Ti-50Ni and pure Cr. The rate in oxidation becomes to small, as the amount in formation of continuously Cr2O3
oxide films increases in Cr containing alloys.
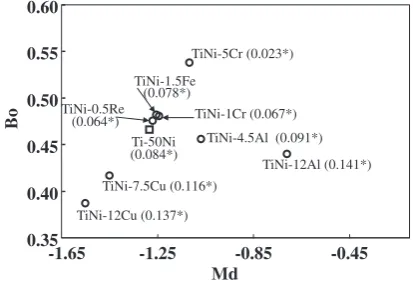
Another approach is proposed for the explanation of oxidation behavior. Figure 12 shows the location of designed alloys and their ratios of weight gain to the initial weight of specimens after the 72 ks exposure at 1273 K as indicated in each parenthesis. There was a good correlation between this ratio and Bo, except for the TiNi-12Al alloy with B2, B190,
AlNi2Ti and Ti2Ni phases. As Bo increased in alloys, this
ratio decreased or the oxidation resistance was improved, although there were a few data. It has been found that various physical properties could be interpreted in term of Bo. For example, Bo correlated well with activation energies for impurity-diffusion of transition elements in-Ti.32,43) There-fore, the oxidation of intremetallics consisting of same crystal structures may be interpreted by Bo. In contrast, Md is also necessary for the prediction of phase boundary for the achievement of same structure. The result shown in Fig. 12 indicates that an increase in the bond strength between atoms leads to high oxidation resistance. This agrees with the results obtained from the active corrosion rate in 10%H2SO4 at
343 K44) and the weight loss in Na
2SO4-45 mol%NaCl
molten salt at 923 K19)for of various Ti alloys.
4.5 Effectiveness of this concept for property control of TiNi intermetallics
For TiNi intermetallics with ternary alloying elements of Cr, Re, Fe, Cu or Al, the tensile strength, Ms-temperature and oxidation amount at high temperature, were measured experimentally. Their measured values in strength and Ms-temperature and the order in the oxidation amount were agree with their predicted ones and order, respectively, in the Bo-Md map. It is found that the effectiveness of the d-electrons concept could be judged, for property-control of TiNi-Y intermetallics, as well as metallic materials.
5. Conclusions
For TiNi system intermetallic compounds, their crystal structure, tensile strength, Ms-temperature and oxidation resistance were predicted on the Bo-Md map proposed on the basis of the d-electrons concept. Ternary TiNi intermetallic compounds with Cr, Re, Fe, Cu and Al additions were able to be proposed in the specific Bo-Md region. For the designed compounds, their cleanly molten metals with lower contents of O, C, and N, were created by the utilization of CCLM without the reaction between the molten metal and water-cooled copper crucible. The ingots of the designed com-pounds had the objective constructed phase, tensile strength and Ms-temperatures. The alloying effects in the addition of TiNi-7.5Cu
TiNi-5Cr TiNi-1Cr
Ti-50Ni
TiNi-4.5Al
TiNi-0.5Re
Δ
W/W
i
Time, t / ks
[image:7.595.63.278.71.210.2]Ratio of weight gain to initial weight,
Fig. 11 Kinetic oxidation curves obtained from exposure experiments to 72 ks at 1273 K for six experimental intermetallic compounds.
TiNi-0.5Re (0.064*)
Ti-50Ni (0.084*)
-1.65 -1.25 -0.85 -0.45
Md 0.35
0.40 0.45 0.50 0.55 0.60
Bo
TiNi-5Cr (0.023*)
TiNi-1Cr (0.067*) TiNi-1.5Fe
(0.078*)
TiNi-4.5Al (0.091*)
TiNi-12Al (0.141*)
TiNi-12Cu (0.137*) TiNi-7.5Cu (0.116*)
[image:7.595.323.530.74.215.2]ternary elements in the TiNi intermetallic compounds, were explained by two parameters (Bo, Md). It is found that the effectiveness of the d-electrons concept could be judged, for property-control of TiNi-Y intermetallics, as well as metallic materials.
REFERENCES
1) K. Otsuka and X. Ren: Intermetallics7(1999) 511–528. 2) J. Van Humbeek: Mater. Sci. Eng. A273–275(1999) 134–148. 3) T. Durieg, A. Pelton and D. Stockel: Mater. Sci. Eng. A273–275
(1999) 149–160.
4) K. Matsugi, H. Mamiya, Y. B. Choi, G. Sasaki, O. Yanagisawa and H. Kuramoto: Int. J. Cast Metals Res.21(2008) 156–161.
5) M. Morinaga, N. Yukawa and H. Adachi: J. Iron Steel Inst. Japan72 (1986) 555–562.
6) K. Matsugi, Y. Murata, M. Morinaga and N. Yukawa: Mater. Sci. Eng. A172(1993) 101–110.
7) M. Morinaga, N. Yukawa, T. Maya, K. Sone and H. Adachi: Proc. 6th World Conf. on Titanium, (1988) pp. 1601–1606.
8) M. Morinaga, J. Saito and M. Morishita: J. JILM42(1992) 614–621. 9) M. Morinaga, Y. Murata and H. Ezaki: Proc. Int. Symp. Material Chemistry in Nuclear Environment, (Tsukuba, March 1992) pp. 241– 252.
10) R. Ninomiya, H. Yukawa and M. Morinaga: J. JILM44(1994) 171– 177.
11) K. Matsugi, Y. B. Choi and G. Sasaki: J. Japan Inst. Metals75(2011) 110–114.
12) H. Tadano, T. Take, M. Fujita and S. Hayashi: Proc. 2nd Int. Conf. on Electromagnetic Processing of Materials,1(1997) pp. 377–382. 13) T. Volkmann, W. Loser and D. M. Herlach: Metall. Trans.28A(1997)
461–469.
14) S. Asai: J. Iron Steel Inst. Japan7(2002) 44–48.
15) J. Saito, Y. Takagi, M. Morinaga, Y. Murata and Y. Harada: Proc. 3rd Japan Int. SAMPE Symp., (Tokyo, December 1993) pp. 1252–1257. 16) Y. Harada, M. Morinaga, J. Saito and Y. Takagi: J. Phys. Condens.
Matter9(1997) 8011–8030.
17) P. Villars and L. D. Calvert:Pearson’s Handbook of Crystallographic Data for Intermetallic Phasesvol 1–3, (ASM, Metal Park, OH, 1985). 18) K. Matsugi, Y. Murata, M. Morinaga and N. Yukawa: Proc. 7th Int. Conf. on Superalloys, ed. by S. D. Antolovich, R. W. Stusrud, R. A. MacKay, D. L. Anton, T. Khan, R. D. Kissinger and D. L. Klarstrom, (TMS, Warrendale, 1992) pp. 307–316.
19) K. Matsugi, T. Endo, Y. B. Choi and G. Sasaki: Mater. Trans.51(2010) 740–748.
20) S. Miyazaki and K. Otsuka: ISIJ Int.29(1989) 353–377.
21) S. F. Hsieh, S. K. Wu and H. C. Lin: J. Alloy. Compd.339(2002) 162– 166.
22) C. Seeger and P. L. Ryder: Mater. Sci. Eng. A179–180(1994) 641– 644.
23) Y. Chen, H. C. Jiang, S. W. Liu, L. J. Rong and X. Q. Zhao: Mater. Sci. Eng. A512(2009) 26–31.
24) Y.-wook Kim, H.-joong Kim and T.-hyun Nam: J. Alloy. Compd.449 (2008) 134–138.
25) K. Inaekyan, V. Brailovski, S. Prokoshkin, A. Korotitskiy and A. Glezer: J. Alloy. Compd.473(2009) 71–78.
26) C. Satto, A. Ledda, P. Potapov, J. F. Janssens and D. Schryvers: Intermetallics9(2001) 395–401.
27) J.-hwa Lee, T.-hyun Nam, H.-jun Ahn and Y.-wook Kim: Mater. Sci. Eng. A438–440(2006) 691–694.
28) Z. G. Wei and R. Sandstrom: J. Mater. Sci.33(1998) 3743–3762. 29) H. Kyogoku, T. Hatakeyama, F. Yoshida, S. Komatsu, T. Sakuma and
U. Iwata: Trans. Japan Soc. Mech. Eng. (A)65–632(1999) 873–878. 30) H. Kyogoku, T. Kadomura, A. Terayama and S. Komatsu: J. Japan Soc.
Powder Powder Metall.51(2004) 43–47.
31) J. Askill:Tracer Diffusion Data for Metals, Alloys and Simple Oxides vol 1–3, (IFI, Plenum, NY, 1970) p. 21.
32) M. Morinaga and N. Yukawa: Proc. 1st Int. Conf. on Computer Applications to Materials Science and Engineering, (Yokohama, 1991) pp. 803–808.
33) K. Matsugi, M. Kawakami, Y. Murata, M. Morinaga, N. Yukawa and T. Takayanagi: J. Iron Steel Inst. Japan78(1992) 821–828. 34) J. Uchil, K. G. Kumara and K. K. Mahesh: J. Alloy. Compd.325(2001)
210–214.
35) S. F. Hsieh, S. L. Chen, H. C. Lin, M. H. Lin, J. S. Huang and M. C. Lin: J. Alloy. Compd.494(2010) 155–160.
36) S. L. Chen, S. F. Hsieh, H. C. Lin, M. H. Lin and J. S. Huang: Mater. Sci. Eng. A445–446(2007) 486–492.
37) B. Huneau, P. Rog, K. Zeng and R. Schmid-Fetzer: Intermetallics7 (1999) 1337–1345.
38) J. P. Kuang, R. A. Harding and J. Campbell: Mater. Sci. Technol.16 (2000) 1007–1016.
39) N. Nayan, Govind, C. N. Saikrishna, K. V. Ramaiah, S. K. Bhaumik, K. S. Nair and M. C. Mittal: Mater. Sci. Eng. A465(2007) 44–48. 40) C. L. Chu, S. K. Wu and Y. C. Yen: Mater. Sci. Eng. A216(1996) 193–
200.
41) A. M. Chaz, C. Coddet and G. Beranger: J. Less-Common Met.83 (1982) 49–70.
42) D. Caplan and G. I. Sproule: Oxid. Met.9(1975) 459–472. 43) M. Morinaga, N. Yukawa and H. Adachi: J. Iron Steel Inst. Japan71
(1985) 1441–1451.