On the Roles of Grain Size Dispersion and Microscale Hall
Petch Relation
on the Plastic Behavior of Polycrystalline Metals
Stéphane Berbenni
1,2,+, Francis Wagner
1,2and Nathalie Allain-Bonasso
1,21Laboratoire d’Etudes des Microstructures et de Mecanique des Materiaux (LEM3), UMR CNRS 7239, University of Lorraine,
Ile du Saulcy, F-57045 Metz Cedex, France
2Laboratory of Excellence on Design of Alloy Metals for low-mAss Structures (‘LabEx DAMAS’), University of Lorraine,
F-57045 Metz Cedex, France
Micro-macro scale transition theories were essentially developed to model the inelastic behavior of polycrystals starting from the local behavior of the grains. The anisotropy of the plastic behavior of polycrystalline metals was mainly explained by taking into account the crystallographic textures. Issues like plastic heterogeneities due to grain size dispersion, involving the HallPetch relation at the microscale, were not often taken into account in the literature, because only the role of a mean grain size was investigated. Here, the coupled roles of grain orientation and size distributions on the plastic deformation state of grains are examined for a tensile deformed IF steel in the light of EBSD experimental data based on misorientation parameters and of a micromechanics-based modeling regarding grain and overall behaviors.
[doi:10.2320/matertrans.MA201307]
(Received July 23, 2013; Accepted September 25, 2013; Published December 25, 2013)
Keywords: grain size dispersion, HallPetch relation, micro-macro scale transition, plasticity, interstitial free (IF) steel
1. Introduction
Grain size effects on the tensile responses of polycrystal-line metals like low-carbon steels were essentially captured at the macroscopic scale using a HallPetch relationship1,2)
· ¼·0þ Kyffiffiffiffi D
p ð1Þ
whereDis the average grain size of the material,·0 andKy are materials constants usually referred as the friction stress and the HallPetch slope. Both parameters can be obtained from classic tensile tests at room temperature. For cold-rolled and annealed low-carbon steels®not ultra-fined grained steels®it was found3)that the HallPetch coefficientKy is about 500 MPa·µm1/2 for a 0.13C0.67Mn mass% steel sheet. Generally, body centered cubic (b.c.c.) metals like low carbon steels have usually higher Ky by a factor of 23 compared to face centered cubic (f.c.c.) metals.4)
Plastic heterogeneity is often discussed as depending only on crystallographic texture and associated slip activity inside grains. However, the role of microstructural heterogeneities such as grain sizes and morphologies as well as their dispersions within the aggregate were not deeply studied. Polycrystalline models like Taylor,5)self-consistent6)orfinite
element7) models should be developed to study combined
effects due to statistical orientation and size distributions on the local and overall behaviors.
A first self-consistent scheme8) focused on the effect of local grain size effect in polycrystalline copper. In this approach, the average grain size was incorporated through the critical shear stresses of slip systems by a microscale HallPetch type law. Later, a microscale HallPetch behavior coupled with grain shape effects and called“directional Hall Petch effect” was introduced in a Taylor model9) to study
overall plastic anisotropy coefficients. More recently, new
studies tried to tackle the effects of grain size distribution using log-normal or bimodal distributions1014)on the overall
flow stress of the material using either averaging rule of mixture10)or self-consistent models.1114)Assuming a
micro-scale HallPetch relation within grains and isotropic plasti-city, these studies showed that an increase of the standard deviation within the grain size distribution enhances a decrease of the effective plasticflow stress and consequently a decrease of the overall HallPetch slope here referenced as Ky. This leads not only to depict a classic HallPetch effect based on an average grain size but a representative grain size containing grain size dispersion as well.
The effects of correlations between crystallographic orientations and grain sizes on the mechanical behavior of polycrystalline aggregates were recently shown using viscoplastic Taylor15) and elastoviscoplastic self-consistent (EVPSC)16)models. Both studies assumed a microscale Hall Petch relationship for the shearflow strength within each slip system
¸c¼¸0þ kyffiffiffiffiffiffi DI
p ð2Þ
where DI is an individual grain size and ky is a microscale
HallPetch slope characterizing the grain boundary resistance to slip. The microscale HallPetch relationship was recently obtained by nanoindentation through pop-in loads.1719) Interestingly, slip transmission mechanisms across grain boundaries, grain boundary geometry, prior cold work and carbon interstitial content can modify ky.19,20)Theoretically, this one was found to be proportional to the deformation energy required to eject dislocations from grain bounda-ries.21) However, nanoindentation measurements are gener-ally focused on local configurations with well identified grain boundaries where it is somewhat difficult to transpose results to real statistical polycrystalline metals.
Here, the coupled roles of crystallographic and grain size heterogeneities arefirst examined in the light of EBSD data +Corresponding author, E-mail: stephane.berbenni@univ-lorraine.fr
Special Issue on Strength of Fine Grained Materials®60 Years of HallPetch®
to obtain some indicator of plastic deformed state, and, second using an EVPSC model with crystal plasticity to quantify the role of microscale HallPetch parameter on the plastic strainfluctuations between grains.
2. Experimental and Modeling
2.1 Material
The material used in this study was a ferritic single phase interstitial free steel (IF). Table 1 shows the chemical composition of the IF steel.
The several samples were in a recrystallized state with a mean grain size of³16.0 µm. The measured grain diameters (Fig. 1) follow approximately a statistical log-normal density probability function defined by a standard misorientation criterion. The orientation distribution function (ODF) shows the classical texture for such a steel with much orientations distributed along the£fiber (h111i//ND) and a little amount of ¡fiber (h110i//RD).
2.2 Mechanical tests and EBSD data
Tensile tests were carried out ex-situat room temperature up to four tensile strains 4.7, 6.7, 12 and 17%. The tensile direction was the same as the rolling direction. The samples consisted of small dogbone-shaped tensile test specimens with total length=61.5 mm, gauge length=25 mm, width=4 mm and thickness=0.7 mm. Tensile tests were performed on an Instron 8513 5 kN tensile machine. The crosshead speed in the tensile stage was set to 0.02 mm·s¹1 which corresponds to an initial strain rate of 8©10¹4s¹1. The EBSD (electron backscatter diffraction) technique was
used to investigate the microstructure and crystallographic orientation of the IF-steel.22) The EBSD data were obtained
using a 6500F JEOL FEG-SEM equipped with an HKL Channel 5 system on samples tilted at 70°. The maps were carried out on a regular square grid with ¦x=¦y=0.5 µm steps on areas corresponding to 700 to 2200 grains. The EBSD maps were madeex-situon the same area before and after tensile deformation tests in order to study the micro-structure changes due to plastic deformation. The raw indexing rate was over 90% in each case and was over 99% after noise reduction. Grains were detected as sets of contiguous pixels with less than 5° of misorientation. Grains with less than 4 pixels (i.e., lower than 1 µm2) were ignored.
The samples were prepared using standard mechanical polishing and electro-polishing. Finally, the samples were cleaned in an ultrasonic bath.
Here, an indirect method based on the values of the misorientation angles determined from EBSD was used to evaluate plastic deformation state of the different grains as a function of their grain size. The misorientation between a
fixed orientation denoted i and another one denoted k is
ªði; kÞ. For a given grain of average orientationi, the“Grain Orientation Spread”(GOS) is given by
GOSðiÞ ¼np1 X
np
k¼1
ªði; kÞ ð3Þ
wherenpis the total number of pixels included in the grain of
orientation i. Then, the average GOS on a set of ng grains
becomes
GOSðngÞ ¼ 1
ng Xng
i¼1
GOSðiÞ: ð4Þ
Note that similar quantities were used by Kamaya et al.22)
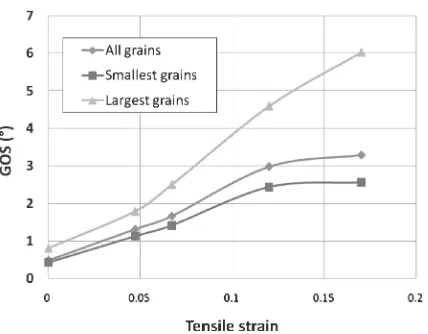
to quantify the plastic deformation state in grains of 304 austenitic stainless steel, which motivated the present study on IF steel. The evolutions of GOSðngÞ are reported on Fig. 2 for two subpopulations referred as “smallest” and “largest” grains. The “smallest grains” correspond to a subpopulation of about 1000 grains with average grain size close to 10 µm and the “largest grains” correspond to a subpopulation of about 100 grains with average grain size close to 34 µm.
[image:2.595.53.288.466.749.2]Figure 2 shows a first strong increase of GOS values with plastic deformation up to ³12% of tensile strain and a much slower increase after 12%. It is observed that thefirst increasing stage is due to the formation of “geometrically necessary dislocations” (GND) in the vicinity of grain boundaries and the stabilized stage which occurs earlier for the smallest grains is more due to intra-granular dislocation walls and cells under multiple slip. Furthermore, the highest GOS values were found for the largest grains subpopulation. Similar trends were found with misorientation parameters using an orientation imaging microscopy (OIM) analysis regarding polycrystalline Cu after 11% tensile strain.23) Furthermore, it was also shown22) that strong orientation gradients between grain boundaries and grain centers were also observed in the different grains at 17%of tensile strains. In the next modeling part and disregarding local situation with interactions between dislocations and grain boundaries, the analysis is based on grain boundary strengthening
Table 1 Chemical composition of the IF steel.
Element Ti C S N Mn P Si Cu Ni Cr Al
©10¹3
mass% 89 1.6 6 2.3 113 74 8 6 16 21 37
0 10 20 30 40 50
0 150 300 450 600 750 900 1050 1200 1350 1500
Grain diameter (µm)
described by the microscale HallPetch parameterkyusing an
elastoviscoplastic self-consistent model (EVPSC).
2.3 Modeling
For each grain denoted I, the constitutive behavior is supposed to be elastoviscoplastic. For the sake of simplicity, a linearized small strain kinematics is assumed and elastic properties are supposed homogeneous, so that the total strain rate splits into an elastic part and a viscoplastic part
_
¾I
ij ¼¾_eIijþ¾_pIij¼sijkl·_Iklþ
X
sðIÞ
RsðIÞ
ij £_sðIÞ ð5Þ
In eq. (5), the homogeneous elastic compliances sijkl are supposed isotropic and are defined by the elastic shear modulus µ and the elastic Poisson ratio¹. In eq. (5),Rijs(I)is the Schmid tensor of the slip system s in grainI. Here, for each grainI, and on the slip system s(I), the slip rate is given by
_
£sðIÞ ¼£0_ j¸sðIÞj
¸scðIÞðμsðIÞ;£sðIÞ; DI;. . .Þ
n
signð¸sðIÞÞ ð6Þ
wherenis a parameter corresponding to the inverse of the slip rate sensitivity of the material, £_0 is a reference slip rate, ¸sðIÞ ¼RsðIÞ
ij ·Iijis the resolved shear stress on slip system s(I).
The reference shear stress ¸scðIÞ depends on the mean dislocation densities on the different active slip systemsμhðIÞ and on the individual grain diameterDI. Thus, the assumed
microscale HallPetch type law on slip system s(I) for a given plastic deformation state reads
¸sðIÞ
c ¼¸s0ðIÞþ ksðIÞ
y ffiffiffiffiffiffi DI p þ¡®b
ffiffiffiffiffiffiffiffiffiffiffiffiffiffiffiffiffiffiffiffiffiffiffiffiffiffiffiffi X
hðIÞ
asðIÞhðIÞμhðIÞ
s
ð7Þ
where¸s0ðIÞ is an initial critical shear stress containing lattice friction and solid solution strengthening,b is the magnitude of the Burgers vector, ¡ is a material parameter (with 0<¡<1). Here, the microscale HallPetch coefficientksyðIÞ is introduced on each slip system s(I) to depict individual grain size effect on the initial critical shear stress. In eq. (7), asðIÞhðIÞ is the crystallographic part of the hardening matrix
in any grain I. Then, eq. (7) accounts for both self and latent hardening during plastic deformation. Furthermore, the variation of dislocation density on each slip system is
supposed to depend on the dislocation density on the same system (due to annihilation of dislocation dipoles) but also on other slip systems (creation of new dislocations due to forest obstacles) as follows
_
μsðIÞ¼1
b
1
DI þ
ffiffiffiffiffiffiffiffiffiffiffiffiffiffiffiffiffiffiffiffiffiX
uðIÞ6¼sðIÞ
μuðIÞ
r
K 2ycμsðIÞ 0
B B @
1 C C
Aj£_sðIÞj ð8Þ
In eq. (8), the mean free path of dislocations is constrained by both grain boundaries and forest dislocations. Here, for a considered recrystallized IF steel, it is initially on the order of the individual grain size DI which fixes parameter K.
Furthermore, yc is a critical distance for dislocation dipole
annihilation.
An elastoviscoplastic self-consistent (EVPSC) procedure using the translatedfields technique was developed11,12,16)to
determine the effective properties of the Representative Vol-ume Element (RVE) describing the polycrystal. The volVol-ume fractionfIis calculated asfI¼³D3I
6V whereDIis an equivalent
diameter deduced from EBSD data assuming spherical grains and Vis the total volume of the RVE. The interaction law between the average stress rate·_Iijand plastic strain rate¾_pIijin each grainIand overall stress and plastic strain rates _ij,E_pij reads
_
·I
ij¼ _ijþCijklðIklmnSeshklmnÞðAImnpqE_ppq¾_pImnÞ ð9Þ
with _ij¼PIfI·_Iij; E_pij ¼PIfI¾_pIij. In eq. (9), Sijklesh is the elastic Eshelby tensor associated with the homogeneous elastic moduliCijkl,AIijklis the viscoplastic strain rate concentration tensor related to the effective viscoplastic moduli Beijkl for the polycrystal obtained through an iterative self-consistent procedure.11,12,16)
3. Results and Discussions
The crystal plasticity-based EVPSC model introduced in section 2.3 was applied to the studied IF steel. The RVE is constituted of a total of N grains including for each grain its size and mean orientation as determined from the large EBSD map of the initial microstructure. For the calculations, isotropic elastic properties are characterized by a shear modulus of µ=80 GPa and Poisson ratio ¯=0.3. The magnitude of the Burgers vector is b=2.5©10¹10m. The matrix asðIÞhðIÞ in eq. (7) is a 24©24 matrix with two major slip systems {110}h111i and {112}h111i considered in the case of this IF steel (b.c.c. metal). The latent hardening ratio present in asðIÞhðIÞ is denoted q. The microscale HallPetch
coefficient ksyðIÞ introduced in eq. (7) is assumed to be constant on all the slip systems and identified on uniaxial tensile curves. This is found to be 250 MPa·µm1/2, which about half the one obtained macroscopically for low-carbon steels3) (i.e., 500 MPa·µm1/2). The materials parameters present in eqs. (6)(8) are reported in Table 2. They were obtained through comparisons between the simulated and the experimental uniaxial tensile stressstrain responses.
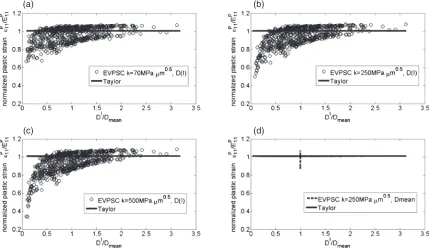
Here, the correlations between internal plastic strains and microscale HallPetch parameter ky are examined and the
results are reported on Fig. 3 for a macroscopic tensile strain of 12%. For the sake of clarity, the statistics are based on 708
[image:3.595.64.278.66.233.2]different grains with grain size ranging from 1.38 to 50.61 µm. These grains were also identified experimentally before and after tensile deformation using a homemade program to automatically correlate grains between two EBSD maps on the same area.25)
Two major results are highlighted with Fig. 3. Thefirst one is that an increase of the microscale HallPetch parameterky
from 70 to 500 MPa·µm1/2leads to an increase of¦¾p
11for the
same grain size dispersion especially due to the lowest amount of plastic strain in the smallest grains, see Figs. 3(a) to 3(c). Second, larger normalized plastic strain (with respect to 1 which corresponds to the case of Taylor-based assumption) is observed for both largest grains in size and grains with high Schmid tensor component along the longitudinal tensile direction due to eq. (6). Considering the GOS value as an indicator of plastic deformation in grains, this may explain why the increase of GOS values with tensile strain for smallest grains is seen to be retarded with respect GOS evolution for largest grains. The present results are consistent with recent
finite element calculations performed with non uniform grain size distribution and microscale HallPetch relation.26) In
contrast with Taylor’s uniform plastic strain based approach or uniform grain size approaches with self-consistent schemes (see Fig. 3(d)), the present model captures the existing correlations between grain sizes and orientations on the
development of plastic heterogeneities. However, the model is not able in its present form to consider shear banding classically observed infinite element simulations7,26)and in
experiments.27) Such strain localization process may change
plastic deformation states within grains crossed by shear bands. Furthermore, slip interaction mechanisms certainly needs multiple microscale HallPetch parametersky
depend-ing on slip system, grain boundary geometry and character as observed with nanoindentation.1719)
4. Conclusion
Experimental misorientation parameters like GOS (“Grain Orientation Spread”) and an “augmented” mean field elastoviscoplastic self-consistent (EVPSC) model were developed to identify the coupled roles of grain size and orientation distributions on the plastic responses of poly-crystalline metals. After introducing a microscale HallPetch slope ky on each slip system, it is concluded that the high
value of this microstructural parameter in IF steel may play a key role on the plastic strain development in grains which could not be described by uniform plastic strain Taylor-type models or scale transition models with uniform grain size. Further works may focus on the variability of this parameter due to the material type and grain boundary-dislocation interactions to refine the present analysis.
Acknowledgments
This work is supported by the French State through the National Research Agency (ANR) under the program “Investment in the future” (LabEx DAMAS referenced as ANR-11-LABX-0008-01).
(a) (b)
(c) (d)
Fig. 3 Normalized plastic strains per grain along the longitudinal uniaxial tensile direction predicted by the EVPSC model with different
“microscale HallPetch slope”kyand non uniform experimental grain size distribution for 708 grains experimentally identified before
and after the tensile test: (a) 70 MPa·µm1/2, (b) 250 MPa·µm1/2, (c) 500 MPa·µm1/2. For comparisons, predictions given by the same
[image:4.595.84.513.72.322.2]EVPSC model with (d) uniform grain size (dotted line) and (a)(d) Taylor based uniform plastic strain model (solid line).
Table 2 Identified materials parameter as input of the present elastovisco-plastic self-consistent model based on crystal elastovisco-plasticity.
¸0
(MPa)
ky
(MPa·µm1/2) _ £0
(s¹1) n K
2yc
(nm) q ¡
μ0
(m¹2)
[image:4.595.45.291.419.458.2]REFERENCES
1) E. O. Hall: Proc. Phys. Soc. London B64(1951) 747753. 2) N. J. Petch: J. Iron Steel Inst.174(1953) 2528.
3) R. Song, D. Ponge, D. Raabe, J. G. Speer and D. K. Matlock:Mater. Sci. Eng. A441(2006) 117.
4) M. A. Meyers and K. K. Chawla:Mechanical Behavior of Materials, 1st ed., (Prentice-Hall, Upper Saddle River, NJ, 1999).
5) G. I. Taylor: J. Inst. Metals61(1938) 307324.
6) M. Berveiller and A. Zaoui:J. Mech. Phys. Solids26(1978) 325344.
7) D. Raabe, M. Sachtleber, Z. Zhao, F. Roters and S. Zaefferer: Acta
Mater.49(2001) 34333441.
8) G. J. Weng:J. Mech. Phys. Solids31(1983) 193203.
9) H. J. Bunge, F. Wagner, P. I. Welch and P. Van Houtte:J. Phys. Lett.46
(1985) 11091113.
10) K. J. Kurzydłowski:Scr. Metall. Mater.24(1990) 879883.
11) S. Berbenni, V. Favier and M. Berveiller:Int. J. Plast.23(2007) 114 142.
12) S. Berbenni, V. Favier and M. Berveiller: Comput. Mater. Sci.3(2007) 114142.
13) B. Raeisinia, C. W. Sinclair, W. J. Poole and C. N. Tomé: Model.
Simul. Mater. Sci. Eng.16(2008) 025001.
14) B. Raeisinia and C. W. Sinclair:Mater. Sci. Eng. A525(2009) 7882.
15) B. S. Fromm, B. L. Adams, S. Ahmadi and M. Knezevic:Acta Mater.
57(2009) 23392348.
16) N. Nicaise, S. Berbenni, F. Wagner, M. Berveiller and X. Lemoine:Int. J. Plast.27(2011) 232249.
17) W. A. Soer, K. E. Aifantis and J. T. M. De Hosson:Acta Mater.53
(2005) 46654676.
18) T. Ohmura, K. Tsuzaki and F. Yin:Mater. Trans.46(2005) 20262029.
19) T. A. Britton, D. Randman and A. J. Wilkinson: J. Mater. Sci.24(2009) 607615.
20) R. W. Armstrong, I. Codd, R. M. Douthwaite and N. J. Petch:Philos. Mag.7(1962) 4558.
21) V. Bata and E. Pereloma:Acta Mater.52(2004) 657665.
22) N. Allain-Bonasso, F. Wagner, S. Berbenni and D. P. Field:Mater. Sci. Eng. A548(2012) 5663.
23) M. Kamaya, A. J. Wilkinson and J. M. Titchmarsh:Nucl. Eng. Des.
235(2005) 713725.
24) R. A. Lebensohn, R. Brenner, O. Castelnau and A. D. Rollett: Acta Mater.56(2008) 39143926.
25) F. Wagner, N. Allain-Bonasso and S. Berbenni: Mater. Charact.62
(2011) 681683.
26) Y. Wang, J. Zhou, T. D. Shen, D. Hui and S. Zhang:Comput. Mater. Sci.58(2012) 175182.