In Situ
TEM Observation of Structural Changes in Rapidly
Solidi
fi
ed bcc Solid-Solution Phase in Ti
Cr Alloy
Focusing on Spontaneous Vitri
fi
cation (SV)
Takeshi Nagase
1,2,+, Satoshi Anada
2, Keita Kobayashi
1, Hidehiro Yasuda
1and Hirotaro Mori
11Research Center for Ultra-High Voltage Electron Microscopy, Osaka University, Ibaraki 567-0047, Japan
2Division of Materials and Manufacturing Science, Graduate School of Engineering, Osaka University, Suita 565-0871, Japan
Changes in the structure of the rapidly solidified body-centered-cubic (bcc) solid-solution phase in TiCr alloy were investigated in order to determine whether or not the unique heat-induced amorphization (i.e., SV) actually occurs. Annealing-induced amorphization of the single solid-solution phase was not observed during eitherex situisothermal annealing at 873 K orin situannealing experiments in HVEM. The previously reported SV may not correspond to the formation of an amorphous phase but could actually be due to the formation of a finely grained polycrystalline structure during the decomposition of the bcc solid-solution phase. [doi:10.2320/matertrans.MD201306]
(Received September 3, 2013; Accepted November 5, 2013; Published December 13, 2013)
Keywords: in situ transmission electron microscopy (TEM), high-voltage electron microscopy (HVEM), solid-state amorphization (SSA), phase transition, rapid solidification, irradiation
1. Introduction
Blatter et al.14) reported novel amorphization known as
spontaneous vitrification (SV) in various alloys. Compared
with conventional solid-state amorphization (SSA) such
as interdiffusion-induced amorphization in multilayers,5,6)
hydrogen-induced amorphization,7,8)
mechanical-milling-induced amorphization,9,10) irradiation-induced
amorphiza-tion1116)and so on, SV is novel because the starting material
is a single solid-solution crystal phase rather than a single phase of intermetallic compound or a mixture of two crystalline phases. Several researchers have conducted experiments to determine whether or not SV actually occurs.
Although Kim et al.17) and Yan et al.18) reported that SV
had occurred, Prasad et al.,19) Sinkler et al.,20) and Hirata
et al.21,22) reported that it had not. Ranganathan and
Ramachandra have recently suggested a new thermodynamic
model for SV,23) while Prasad and Greer concluded that
SV was thermodynamically impossible.24) Although many
researchers have been trying to understand SV, there is little agreement as to the annealing-induced formation of an amorphous phase from a solid solution. In other words, it remains an unsettled question about the occurrence of the unique heat-induced amorphization (i.e., SV). As mentioned in detail in the followings, these must be considerable doubt as to whether the SV actually occurs in metallic materials. The main objective of the present study is to apply X-ray diffraction (XRD), thermal analysis, and transmission
electron microscopy (TEM) to a rapidly solidified
body-centered-cubic (bcc) solid-solution phase in order to determine whether or not the SV actually occurs in a Ti60Cr40 alloy.
2. Materials and Methods
Master ingots of Ti60Cr40 (at%) alloy were prepared by
arc-melting Cr and Ti in a water-cooled Cu hearth under a
purified Ar atmosphere. The composition of the alloy was the
same as that of alloys used by Blatteret al.1,2) and by Kim
et al.17) A single-roller melt-spinning method was used to
produce rapidly quenched ribbons from the master ingots. A quenching apparatus consisting of a 200-mm-diameter copper roller was operated at 4000 rpm in an Ar atmosphere;
therefore, the roller-surface velocity was about 42 ms¹1.
A 14-mm-diameter quartz nozzle with a 0.5-mm-diameter
orifice was used. The gap between the nozzle bottom and the
roller surface was maintained within 0.4 mm.
The melt-spun ribbons wereex situ thermally annealed at
873 K in an evacuated silica tube containing a Ti oxygen getter. The structures of the melt-spun and annealed ribbons
were examined using XRD with CuK¡radiation and using
TEM. Twin-jet polishing was used to prepare thin foils from the ribbons for TEM observation. The thin foils were
polished in a solution of CH3OH/C2H5OH/HClO4 (45/45/
10) at 213 K. TEM and high resolution TEM (HRTEM) observations were performed using Hitachi H-800 and JEOL JEM-ARM200F/UHR microscopes, respectively, both oper-ated at 200 kV.
In addition to these ex situ annealing experiments,in situ
annealing experiments were also conducted using H-800 and Hitachi H-3000 high voltage electron microscope (HVEM) operated at 2 MV. In these experiments by using HVEM, TEM specimens were irradiated with 2 MeV electrons prior to the annealing experiments, aiming to introduce defects beforehand. The irradiation was carried out at 298 K. The
dose rate wasfixed at 5.0©1024m¹2s¹1. The vacuum of the
specimen chamber in the H-3000 was <2.0©10¹5Pa. The
changes in the brightfield (BF) image and the corresponding
selected-area diffraction (SAD) patterns were observed
in situ during the irradiation and the subsequent annealing
experiments.
3. Results
Figure 1 shows the outer appearance (a), XRD pattern (b),
TEM-BF images (c), (d), TEM-SAD patterns (cA), (dA),
+Corresponding author, E-mail: t-nagase@uhvem.osaka-u.ac.jp
Special Issue onIn SituTEM Observation of High Energy Beam Irradiation
HREM image (e), and fast Fourier transform (FFT) pattern
obtained from the HREM image (eA) for the as-melt-spun
ribbon. A rapidly solidifiedflake-like specimen whose
cross-section was about 2.0 mm wide and 0.04 mm thick was obtained (see Fig. 1(a)). The XRD pattern (b) shows sharp diffraction peaks. The strong peaks indicated by the open
circles are identified as the bcc solid-solution phase whose
lattice constant is 0.312 nm. This value is similar to that
predicted by the Vegard’s law for the Ti60Cr40 (at%) alloy.
Some of the low-intensity peaks do not correspond to the bcc
phase, and these peaks are identified as the Cr2Ti compound
(indicated by thefilled circles). The XRD pattern, therefore,
indicates the formation of a bcc solid-solution phase as the
main constituent phase and the Cr2Ti compound as the minor
phase. The TEM-BF image (Fig. 1(c)) is a low magnification
photo of the sample, showing the formation of a polycrystal-line structure whose grain size is on the order of tens of
micrometers. It is noted that numerous nodules with fine
lamella-like structures were formed along grain-boundaries (One of such nodules is arrowed in Fig. 1(c)). Figure 1(d) is
an enlargement of a grain-boundary region and Fig. 1(dA) is
the corresponding SAD. Although the matrix was identified
as the bcc solid-solution phase from the SAD pattern
(Fig. 1(cA)), the SAD pattern obtained from the
grain-boundary region (Fig. 1(dA)) shows numerous diffraction
spots, which do not correspond to the bcc solid-solution phase. The compositions of the matrix and the grain-boundary region were evaluated using TEM energy-dispersive X-ray
spectroscopy (TEM-EDS). The matrix consisted of 61.6 at%
Ti and 38.4 at% Cr, and the boundary region consisted of
41.7 at% Ti and 58.3 at% Cr, where the composition is the
average of the analysis of 7 different positions in the same specimen. The composition of the bcc solid-solution matrix is
similar to that of the master ingot of Ti60Cr40 alloy. The
concentration of Cr is higher in the boundary region than in
the master Ti60Cr40 alloy, indicating the formation of Cr2Ti,
which is the only one intermediate phase in the TiCr
system.25)The formation of a single bcc solid-solution matrix
without any crystalline precipitates can be confirmed in the
HREM image ((Figs. 1(e) and 1(eA)). The results of the XRD,
TEM, TEM-EDS, and HREM show that the main constituent phase was the bcc solid-solution phase and that a small amount of Cr2Ti was formed in the grain-boundary region of the bcc grain in the as-melt-spun specimen.
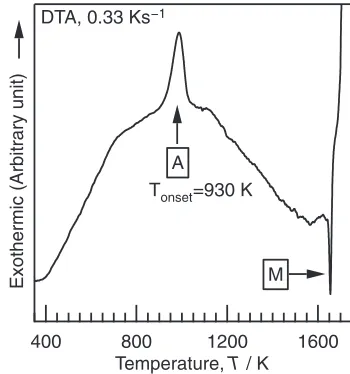
The melt-spun ribbon was thermally analyzed to better understand the phase-transition behavior during thermal annealing. Figure 2 shows the results of the differential
thermal analysis (DTA) performed at 0.33 K s¹1on the
melt-spun ribbon under an Ar atmosphere. The DTA curve shows
an exothermic peak indicated by “A” and an endothermic
peak indicated by“M”. The peak indicated by A corresponds
to heat released when the bcc phase transitioned to another phase whose Gibbs free energy is lower than that of the bcc phase, and the peak indicated by M corresponds to the melting of the alloy. As will be mentioned in the followings, the exothermic peak A corresponds to the phase transition from the bcc solid-solution phase to a mixture containing a hexagonal closed packed (hcp) solid-solution phase and a Cr2Ti intermetallic compound. The onset temperature at which the bcc solid-solution phase decomposed was
measured as³930 K.
The melt-spun ribbon was then subjected to ex situ
isothermal annealing experiments to investigate whether or not an amorphous phase formed through thermal-annealing
as envisaged in SV. The annealing temperature wasfixed at
873 K on the basis of the results of the above thermal analysis and of previous reports. The formation of an amorphous
phase through SV was previously reported for Ti60Cr40 thin
film annealed at 873 K,1) for water-quenched Ti
60Cr40 alloy
100 nm
boundary
(c’)matrix
110 011
1 μm (c)
20 mm (a)
(b) (d) (d’)
(e) (e’)
1 nm
X-ray intensity (Arbitrary unit)
100 80
60 40
2 theta, 2θ / degree bcc, 110
200 211
220 Cr2Ti
bcc Cr2Ti
Fig. 1 Outer view and microstructure of rapidly-solidified melt-spun ribbon in Ti60Cr40 alloy. (a) Outer appearance, (b) XRD, (c) TEM-BF
image, (cA) TEM-SAD pattern obtained from a matrix region away from the grain-boundary region, (d) magnified TEM-BF image of a grain boundary region, (dA) TEM-SAD pattern obtained from a grain-boundary region (i.e., from nodules), (e) HREM image obtained from matrix, and (eA) FFT pattern obtained from (e). Compositions of matrix and grain boundary are as follows: (matrix) 61.6 at%Ti and 38.4 at%Cr, (grain boundary) 41.7 at% Ti and 58.3 at% Cr. In (c) and (d), a nodule is indicated by a white arrow.
Tonset=930 K
DTA, 0.33 Ks−1
Exothermic (Arbitrary unit)
1600 1200
800 400
Temperature, T / K A
M
[image:2.595.51.292.68.321.2] [image:2.595.337.512.70.257.2]annealed at 873 K for 1.8©104s,2)for mechanically alloyed
Ti60Cr40 (obtained from an elemental powder blend of
Ti60Cr40) annealed at 823 K for 1.2©103s,17) and for
mechanically alloyed Ti50Cr50 annealed at 850 K for
1.8©103s,18)indicating that ex situ annealing at 873 K for
a period on the order of 104s was a suitable condition for the
current experiment to determine whether SV actually occurs. The changes in the microstructure of the alloy were investigated using XRD and TEM, where the alloy was
ex situannealed at 873 K for various periods, and the results
are shown in Fig. 3. Figure 3(a) shows the XRD patterns for the ribbon annealed at 873 K for various periods. The intensity of the peaks in the XRD patterns is represented by the logarithmic scale. Intense peaks corresponding to the hcp
phase and the Cr2Ti compound appeared in the XRD pattern
after annealing for 3.6©103s. With continued annealing, the
intensities of the peaks corresponding to the Cr2Ti compound
and the hcp phase increased, while the intensities of the peaks corresponding to the bcc phase decreased. After
annealing for 1.8©104s, the peaks corresponding to the bcc
phase disappeared, and only the peaks corresponding to the
hcp and Cr2Ti phases remained in the XRD pattern. The
broad peak typical of the formation of an amorphous phase did not appear in the XRD pattern. After annealing for
3.6©104s, the spectrum essentially remained unchanged.
These results suggest that the bcc phase had transformed
into a mixture of the hcp solid-solution and Cr2Ti phases by
annealing. The annealed specimens were observed using TEM to investigate in detail the possibility of the formation of an amorphous phase in localized areas of the specimens. Figures 3(b), 3(c), and 3(d) show the BF image of the
specimens annealed at 873 K for 3.6©103, 1.8©104, and
3.6©104s, respectively. Figures 3(bA), 3(cA), and 3(dA) inset,
are the corresponding SAD patterns. Plate-like precipitates were embedded in the bcc matrix phase, as observed in
the BF image of the specimen annealed for 3.6©103s
(Fig. 3(b)). Hirata et al. previously investigated in detail
the annealing-induced structural change in the bcc
solid-solution phase in the Ti70Cr30 alloy.23,24) They found that
the structural change occurred as follows: bcc¼bcc+
Zone I¼bcc+Zone II¼bcc+Zone II+hcp¼bcc+
hcp+C15¼hcp+C15. The plate-like precipitates formed
in the current study are similar to those that Hirata et al.
described in their previous reports. With further annealing,
the matrix changed into a fine polycrystalline structure as
seen from Figs. 3(c) and 3(d), and correspondingly there appeared discontinuous Debye rings in the SAD patterns
(Figs. 3(cA) and 3(dA)). Since the discontinuous Debye rings
are consistently indexed as those of the hcp solid-solution
and the Cr2Ti phases (see also Fig. 8(cA)), the polycrystalline
structure is identified as a mixture of the two phases. Namely,
the bcc phase had decomposed into the hcp solid-solution
phase and the Cr2Ti intermetallic compound under ex situ
thermal annealing at 873 K, resulting in the formation of a
fine polycrystalline structure (Figs. 3(c) and 3(d)). Thermal
1 μm (a)
100 nm
100 nm (b) 3.6x10³s
(1 h)
(b’)
(c) 1.8x10⁴s (5 h)
(d) 3.6x10⁴s
(10 h)
(d’) (c’)
(c”)
hcp 1011
C15-Cr2Ti 311 222 400
X-ray intensity (log scale,
Arbitrary unit)
80 70 60 50 40 30
2 theta, 2θ / degree Cr2Ti
bcc
3.6x10³s (1 h) 3.6x10⁴s (10 h)
bcc
hcp Cr2Ti AB
C
hcp
1.8x10⁴s (5 h)
(d”)
hcp C15-Cr2Ti
1011 311 222 400
111B C
A
Fig. 3 Structural change in rapidly solidified bcc solid-solution phase in Ti60Cr40 alloy observed duringex situ annealing. (a) XRD patterns for
melt-spun ribbon thermally annealed at 873 K. Intensity of X-ray peaks is represented by logarithmic scale. The index A, B, and C correspond to the peaks of hcpð1011Þ, Cr2Ti (311) and Cr2Ti (222), respectively. (b)(bA) BF
and SAD of a specimen taken from Ti60Cr40 alloy ex situ thermally
annealed at 873 K for 3.6©103s (1 h), and (c)(cA) BF and SAD of a
specimenex situthermally annealed at 873 K for 1.8©104s (5 h), (d)(dA)
BF and SAD of a specimen ex situ thermally annealed at 873 K for 3.6©104s (10 h). (c″) Magnified SAD of (cA). (d″) Magnified SAD of
(dA).
110 011
(a) 298 K
868 K
(b)
1 μm 1 μm
(a’)
(b’)
Fig. 4 BF images (a), (b) and SAD patterns (aA), (bA) for rapidly solidified bcc solid solution in Ti60Cr40 alloy taken during thermal annealing
experiment in conventional TEM. (a)(aA) at room temperature before annealing, (b)(bA) at 868 K.
[image:3.595.334.518.70.254.2]annealing induced structural changes in the rapidly-solidified
alloy were also investigated using in situTEM observation;
samples were heated in the range 298863 K. Figure 4 shows
the change in the BF images and SAD patterns of the
melt-spun ribbon in a Ti60Cr40alloy. The significant change in the
bcc matrix and grain boundary region was not observed during annealing. Halo rings due to solid-state amorphization did not appear in the SAD patterns. SV in the bcc
solid-solution phase was neither detected during the in situ TEM
annealing nor detected during the ex-situ annealing
experi-ments.
To confirm whether or not the SV actually occurs in bcc
solid-solution, the following experiments were performed by using HVEM: (1) the melt-spun specimen was irradiated at room temperature for the introduction of defects in the bcc solid-solution, and (2) the specimen with the irradiation
defects wasin situannealed from room temperature to 873 K
according to a stepwise temperature-increase program (a temperature vs. time diagram is shown in Fig. 5). The change in microstructure of bcc solid-solution phase was investigated
in situ using HVEM. Above mentioned in situ experiment
has advantages compared with that using conventional TEM; (1) the enhancement of thermal diffusion via introduced defects may stimulate SV at the temperature lower than 873 K. An amorphous phase is not a thermal equilibrium phase, and changes to crystalline phases at the crystallization temperature. The lower the onset temperature of SV is, the longer the lifetime of an amorphous phase is. The enhance-ment of atomic diffusion at temperatures lower than 873 K
may be effective for detecting SV by in situTEM if SV is
realistic. (2) Blatter et al. pointed out that SV ability of
the Ti60Cr40 alloy was strongly related with the sample
preparation method;4) the strongly distorted and
anisotropi-cally strained bcc solid-solutions had a high SV tendency.
These deficiencies indicated the presence of a high defect
concentration, providing a large number of incoherent sites as
nucleation centres for the amorphous phase. The irradiation
may enhance the SV ability in rapidly solidified bcc
solid-solution. Figure 5 shows a diagram of the employed
annealing temperature as a function of time for the in situ
experiment in HVEM. Index A; the irradiated specimen was quickly heated at the desired temperature (i.e., 373, 473, 573, 673, 737, 873 and 973 K) and was maintained at that temperature for 600 s. Index B; the irradiated specimen was quickly heated at 873 K, and kept at 873 K.
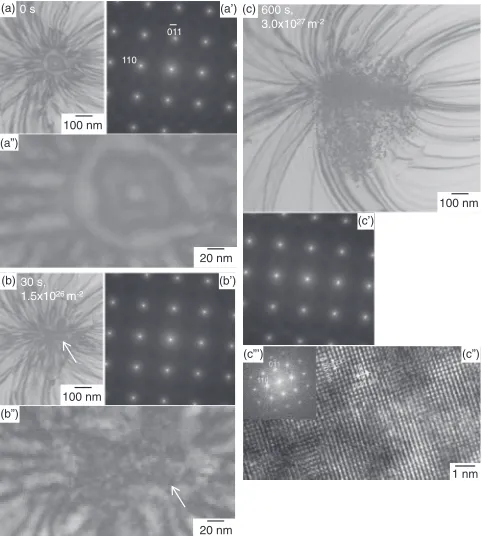
Figures 6(a)6(c), 6(a″), 6(b″) are BF images showing
successive stages of defect introduction into the bcc
solid-solution phase in the Ti60Cr40 alloy under 2.0 MeV electron
irradiation at 5©1024m¹2s¹1 at 298 K, along with the
corresponding SAD patterns (aA)(cA). The BF images
depicted in Figs. 6(a″) and 6(b″) are a magnified image of
Figs. 6(a) and 6(b), respectively. Black spot defects appeared in the specimen after irradiation for 30 s as indicated by the
white arrow in Figs. 6(b) and 6(b″), and the size and the
number density of the defects increased with increasing total dose of electrons (Fig. 6(c)). In contrast, the irradiation-induced structural changes cannot be detected from the
analysis of the SAD patterns shown in Figs. 6(bA) and 6(cA).
Figures 6(c″) and 6(cAAA) show an HREM image and the
corresponding FFT pattern respectively for the specimen irradiated for 600 s, and they strongly support that a single bcc-solid solution phase was kept after irradiation for 600 s; the black spot defect is not due to the precipitation of other phases but is due to the accumulation of irradiation-produced point defects, indicating that the irradiation can introduce
Fig. 5 Schematic of temperature vs. time employed inin situannealing experiment in HVEM. Index A; the irradiated specimen was quickly heated at the desired temperature (i.e., 373, 473, 573, 673, 737, 873 and 973 K) and was maintained at that temperature for 600 s. Index B; the irradiated specimen was quickly heated at 873 K, and kept at 873 K. In the present study, the temperature deviation from the desired temperature and temperature overshoot from the desired temperature during heating were within 5 K at 373 and 473 K, and 2 K at the temperature range between 573 and 973 K, respectively. The time needed in heating to each desired temperature is shorter than 30 s.
(a)0 s
110 011
100 nm
100 nm
100 nm (b)30 s,
1.5x1026 m-2
(a’)
(b’)
(c’)
1 nm
(c”’) (c”)
20 nm (b”)
20 nm (a”)
(c)600 s, 3.0x1027 m-2
Fig. 6 BF images (a)(c), (a″), (b″) and SAD patterns (aA)(cA) for rapidly solidified bcc solid-solution phase in Ti60Cr40 alloy during in situ
irradiation at 5©1024m¹2s¹1 at 298 K in HVEM, and HREM image
(c″) and the corresponding FFT pattern (cAAA) taken by JEM-ARM200F/ UHR. (a)(aA)(a″); before irradiated, (b)(bA)(b″); irradiated for 30 s to a dose of 1.5©1026m¹2, and (c)(cA)(c″)(cAAA); irradiated for 600 s to a dose of
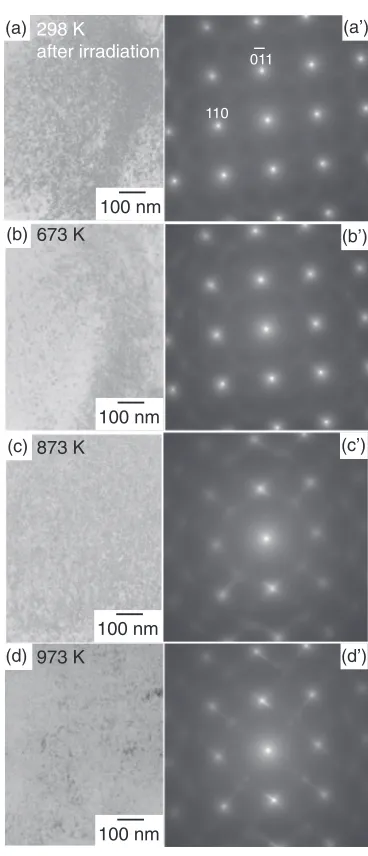
[image:4.595.307.548.71.339.2]defects in the specimen without changing the structure of the bcc phase. Figure 7 shows the BF images (a)(d) and SAD
patterns (aA)(dA) obtained for the electron-irradiated bcc
solid-solution phase before (a), (aA) and during thermal
annealing (annealing profile A in Fig. 5) at 673 K (b), (bA),
873 K (c), (cA) and 973 K (d), (dA). It is noted that the intensity
of diffuse scattering around each spot increased with increasing annealing temperature, as can be seen from the
SADs (Figs. 7(bA), 7(cA) and 7(dA)), while no essential changes
can be detected in the corresponding BF images (Figs. 7(b), 7(c) and 7(d)). The diffuse scattering observed in the present study is similar to those reported in the previously
reports,2,4,1922) and can be attributed to the mechanical
instability and/or the ½ transition of the bcc phase.4,20,26,27)
The evolution of diffuse scattering during annealing indicates the decrease in the stability of the irradiated bcc
solid-solution phase by annealing, however, the occurrence of SV cannot be seen. Figure 8 shows the change in BF images (a)
(d) and SAD patterns (aA)(dA) of irradiated bcc solid solution
in a Ti60Cr40 alloy during thermal annealing at 873 K
(annealing profile B in Fig. 5). Annealing induced structural
change by just heating up to 873 K from room temperature
was not observed (Figs. 8(a) and 8(aA)). After annealing for
600 s, the appearance of diffraction spot indicated by the
white arrow was observed in SAD pattern (Fig. 8(bA)), and
this can be considered to be corresponding to thefirst stage of
the annealing induced structural change.21,22)The appearance
of diffuse streak with the h110i direction was also detected
in SAD pattern of the specimen annealed at 873 K in SAD
pattern (Fig. 8(bA)). The intensity of diffuse streak increased
with the increase in the annealing time, as shown in the SAD
pattern of the specimen annealed for 3.6©103s (Fig. 8(cA))
110 011 (a) 298 K
after irradiation
100 nm (b) 673 K
100 nm
(c) 873 K
100 nm
(a’)
(b’)
(c’)
(d) 973 K
100 nm
(d’)
Fig. 7 BF images (a)(d) and SAD patterns (aA)(dA) for rapidly solidified bcc solid solution in Ti60Cr40 alloy taken during thermal annealing
experiment in HVEM. (a)(aA) at room temperature before annealing, (b)(bA) at 773 K, (c)(cA) at 873 K, and (d)(dA) at 973 K. The specimen was, prior to annealing experiment, irradiated with 2 MeV electron, at 5© 1024m¹2s¹1 and at 298 K for 600 s. A schematic diagram showing
the temperature vs. time program employed in the in situ annealing experiment is presented by the index A in Fig. 5.
0 s
after irradiation
600 s
3.6x10³s
110 011
100 nm
100 nm
100 nm
(a) (a’)
(b’) (b)
(c’) (c)
1.8x10⁴s (d’)
(d)
100 nm
Fig. 8 BF images (a)(d) and SAD patterns (aA)(dA) for rapidly solidified bcc solid solution in Ti60Cr40 alloy taken during thermal annealing
experiment at 873 K in HVEM. (a)(aA) for 0 s at 873 K, (b)(bA) for 600 s at 873 K, (c)(cA) for 3.6©103s at 873 K, and (d)(dA) for 1.8©104s at 873 K.
The specimen was, prior to annealing experiment, irradiated with 2 MeV electron, at 5©1024m¹2s¹1and at 298 K for 600 s. A schematic diagram
showing the temperature vs. time program employed in the in situ
annealing experiment is presented by the index B in Fig. 5.
[image:5.595.76.260.64.492.2] [image:5.595.335.518.71.482.2]and 1.8©104s (Fig. 8(dA)). This phenomenon was similar to
the previous report.4)The change in diffuse scattering during
annealing corresponding to the decrease in the stability of the irradiated bcc solid-solution phase by annealing was observed, however, it is emphasized here that the evidence
for SV cannot be obtained fromin situannealing experiment
in HVEM.
4. Discussion
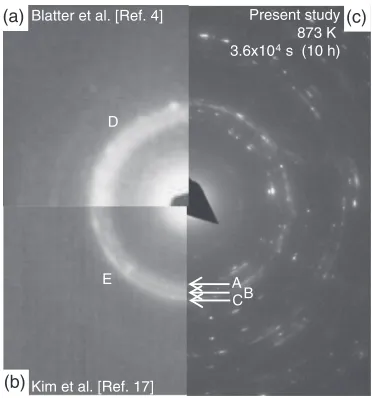
Blatter et al.,4) Kim et al.,17)and Yan et al.18)previously
reported that an amorphous phase had formed through SV of the bcc solid-solution phase on the basis of the SAD and XRD patterns they obtained. Figure 9 compares the SAD patterns for the amorphous phase obtained through SV of the
bcc solid-solution phase reported by (a) Blatteret al.[Fig. 4
in Ref. 4)], (b) Kim et al. [Fig. 3(b) in Ref. 17)], and (c)
acquired from a mixture of the hcp solid-solution and the
Cr2Ti phases obtained through ex situ thermal annealing
of the bcc solid-solution phase at 873 K for 3.6©104s in
the present work. The SAD pattern depicted in Fig. 9(c)
corresponds to that shown in Fig. 3(dA). The broad rings
indicated by D (Fig. 9(a)) and E (Fig. 9(b)) are clearly discontinuous and segmented, and it is reasonable to assume that these broad rings correspond to a sum of discontinuous Debye rings A, B, and C in the SAD pattern (Fig. 9(c)) that correspond to peaks A, B, and C in the XRD pattern shown in
Fig. 3(a). It is noteworthy that Kimet al.17)and Yanet al.18)
provided the BF images of an amorphous phase formed through SV and that their BF images did not exhibit the featureless contrast typical of an amorphous phase but rather
afine black-white contrast similar to the BF images shown in
Figs. 3(c) and 3(d). These results imply that the previously reported SV may not correspond to the formation of an
amorphous phase but to the formation of a finely grained
crystalline structure composed of the hcp solid-solution phase
and the Cr2Ti compound that had transformed from the bcc
solid-solution phase.
Ranganathan et al. used transformation diagrams to
develop a thermodynamic model of SV and concluded that the amorphous phase would form in the following steps: bcc
phase¼hcp phase¼amorphous phase.23) The formation
of the hcp phase as a component of a two-phase mixture decomposed from the bcc phase was observed in the present study, and this can be explained by the thermal equilibrium
phase diagram.25) In contrast, the hcp phase¼amorphous
phase transition was not detected in the present study, while the formation of the crystalline precipitates previously
reported by Hirata et al.21,22) and/or Cr
2Ti was observed.
The experimental results of the present study indicate that the thermodynamic model that does not account for the simultaneous formation of crystalline precipitates and the hcp
phase21)does not apply to CrTi alloys. It is noted that the
experimental results of the present study are consistent with
those described in previous reports by Prasadet al.,19)Sinkler
et al.,20)and Hirataet al.21,22)in the sense that SV could not
be experimentally observed.
5. Conclusions
The changes in the structure of the rapidly solidified bcc
solid-solution phase in the Ti60Cr40 alloy were investigated
by focusing on the formation of an amorphous phase. Our
results andfindings are summarized as follows:
(1) The previously reported SV of the bcc solid-solution phase was not observed in the present work during
eitherex situannealing at 873 K orin situannealing in
HVEM.
(2) In the in situ annealing experiment, specimens were,
prior to annealing, irradiated with 2 MeV electrons aiming to introduce a high density of defects and to enhance the diffusion, but it was in vain.
(3) The SV previously reported for TiCr alloys may
actually correspond to the formation of afinely grained
polycrystalline structure through the decomposition of the bcc solid-solution phase.
(4) The bcc solid-solution phase was highly stable under MeV electron irradiation at 298 K.
Acknowledgements
This work was supported in part by Grants for Excellent Graduate Schools, funded by the Ministry of Education, Culture, Sports, Science and Technology (MEXT), Japan.
REFERENCES
1) A. Blatter and M. von Allmen:Phys. Rev. Lett.54(1985) 21032106.
2) A. Blatter, M. von Allmen and N. Baltzer:J. Appl. Phys.62(1987) 276280.
3) M. von Allmen and A. Blatter:Appl. Phys. Lett.50(1987) 18731875.
4) A. Blatter, J. Gfeller and M. von Allmen:J. Less-Common Met.140
(1988) 317325.
5) R. B. Schwarz and W. L. Johnson:Phys. Rev. Lett.51(1983) 415418.
6) M. Matsuura:Solid-State Amorphization: Interdiffusion of Multilayers, ed. by Y. Sakurai, Y. Hamakawa, T. Masumoto, K. Shirae and K. Suzuki, Physics and Technology, (Elsevier Science Publishers, Amsterdam, 1997) pp. 127134.
Present study 873 K 3.6x10⁴s (10 h)
A B Blatter et al. [Ref. 4]
(a)
D
Kim et al. [Ref. 17] (b)
E
C
(c)
Fig. 9 Comparison of SAD patterns among previously reported amorphous phases obtained through SV of bcc solid-solution phase (a), (b) and SAD pattern (c) a mixture of the hcp and Cr2Ti phases obtained throughex situ
thermal annealing of bcc solid-solution phase at 873 K for 3.6©104s in
[image:6.595.76.262.69.268.2]7) X. L. Yeh, K. Samwer and W. L. Johnson:Appl. Phys. Lett.42(1983) 242243.
8) K. Aoki:Solid-State Amorphization by Hydrogen Absorption, ed. by Y. Sakurai, Y. Hamakawa, T. Masumoto, K. Shirae and K. Suzuki, Physics and Technology, (Elsevier Science Publishers, Amsterdam, 1997) pp. 112119.
9) C. C. Koch, O. B. Cavin, C. G. Mckamey and J. O. Scarbrough:Appl. Phys. Lett.43(1983) 10171019.
10) C. Suryanarayana:Prog. Mater. Sci.46(2001) 1184.
11) H. Mori and H. Fujita:Jpn. J. Appl. Phys.21(1982) L494L496.
12) G. Thomas, H. Mori, H. Fujita and R. Sinclair:Scr. Metall. Mater.16
(1982) 589592.
13) A. Mogro-Campero, E. L. Hall, J. L. Walter and A. J. Ratkowski:
Metastable Materials Formation by Ion-Implantation, ed. by S. T. Picraux and W. J. Choyke, (North-Holland, New York, 1982) pp. 203 208.
14) H. Mori:Solid-State Amorphization by Irradiation, ed. by Y. Sakurai, Y. Hamakawa, T. Masumoto, K. Shirae and K. Suzuki, Current Topics in Amorphous Materials: Physics and Technology, (Elsevier Science Publishers, Amsterdam, 1997) pp. 120126.
15) P. R. Okamoto, N. Q. Lam and L. E. Rehn:Physics of Crystal-to-Glass
Transformations, ed. by H. Ehrenreich and F. Spaepen, Solid State Physics, (Academic Press, San Diego, 1999) pp. 1135.
16) T. Nagase:Advanced Materials Design by Irradiation of High Energy Particles, ed. by T. Kakeshita, Progress in Advanced Structural and Functional Materials Design, (Springer, Tokyo, 2013) pp. 137153. 17) Y.-D. Kim and J.-Y. Lee:J. Non-Cryst. Solids122(1990) 269275.
18) Z. H. Yan, T. Klassen, C. Michaelsen, M. Oehring and R. Bormann:
Phys. Rev. B47(1993) 85208527.
19) R. Prasad, R. E. Somekh and A. L. Greer:Mater. Sci. Eng. A133
(1991) 606610.
20) W. Sinkler and D. E. Luzzi: Proc. IMC12(1990) 144145. 21) A. Hirata, M. Tanimura and Y. Koyama:Mater. Trans.42(2001) 2553
2558.
22) A. Hirata, M. Tanimura and Y. Koyama:Mater. Trans.43(2002) 1689 1695.
23) S. Ranganathan and R. P. Ramachandra:Chalphad34(2010) 387392.
24) R. Prasad and A. L. Greer:J. Alloy. Compd.194(1993) 263272.
25) J. L. Murray: CrTi (ChromiumTitanium), ed. by T. B. Massalski, Binary Alloy Phase Diagrams, II Ed., Vol. 2, (1990) pp. 13451348. 26) W. Sinkler and D. E. Luzzi:Acta Mater.42(1994) 12491260.
27) W. Sinkler and D. E. Luzzi:J. Alloy. Compd.194(1993) 273278.