Re
fi
nement of Nanoporous Copper: A Summary of Micro-Alloying
of Au-Group and Pt-Group Elements
Zhenhua Dan
1,2,+1, Fengxiang Qin
1,+1,+2and Nobuyoshi Hara
21Institute for Materials Research, Tohoku University, Sendai 980-8577, Japan 2Department of Materials Science, Tohoku University, Sendai 980-8579, Japan
The micro-alloying of 1 at%metals of Au-Group (Ag, Au) and the Pt-Group (Ni, Pd, Pt) with the Ti60Cu40amorphous alloy resulted in the
formation offine nanoporous copper (NPC) in the order of 628 nm. The smallest characteristic pore size of opencell nanoporousfccCu was 7 and 6 nm after dealloying the amorphous Ti60Cu39Pd1and Ti60Cu39Pt1precursor alloys for 43.2 ks in 0.03 M HF solution, while NPC had a pore
size of 39 nm after dealloying the amorphous Ti60Cu40 precursor alloy. On the basis of TEM micrographs, the refining factor increased
approximately from 4 for the Ti60Cu39Ag1precursor alloy to 1780 for the Ti60Cu39Pt1precursor alloy. The refinement was attributed to the
dramatic decrease in the surface diffusivity during dealloying. The refinement efficiency of the micro-alloying of the Pt-group elements was higher than that of the Au-group elements. The homogeneous distribution of additives in both of the amorphous precursor alloys and thefinal stabilized NPCs played a key role in refining the NPCs. This strategy may contribute to the fabrication of cost-effective nanoporous metals with a nanoporosity comparable to that of nanoporous Au, Pd and Pt catalysts. [doi:10.2320/matertrans.M2013445]
(Received December 13, 2013; Accepted February 17, 2014; Published April 4, 2014)
Keywords: amorphous materials, porous materials, diffusion, micro-alloying
1. Introduction
Nanoporous metals (Ni, Cu, Au, Pd, Pt, etc.) have been fabricated from a great number of Al- and Mn-based alloy systems. Among them, nanoporous copper (NPC) fabricated through chemical/electrochemical dealloying processes has a typical 3-D bi-continuous network of ligaments and pores with characteristic sizes varying from a few tenths of nanometers to a few hundredths of nanometers.15) The potential applications of NPCs are diverse: they could be used in catalysis, as sensors, as actuators, in fuel cells and in microfluidic flow controllers.6,7) To date, the smallest pore size reported for NPCs is in the range of 15 nm.2,5) A finer NPC structure with a pore size of less than 10 nm is eagerly anticipated because this would provide a larger surface area and, therefore, better mechanical and catalytic performances.4) Afiner nanostructure enables nanoporous metals to perform better. For instance, the yield strength of nanometer-sized ligaments of nanoporous gold increased from ³880 MPa to 4.6 GPa with the decrease in the pore size from 50 to 10 nm.8) On the other hand, it has been shown that the micro-structure of the starting materials plays a critical role in the formation of the final nanoporous structures.1,2,913) The characteristics of the casting structures, the intermetallics, and the phase segregations typical of the crystalline alloys, such as AlCu,1,2,10)NiCuMn,9)NiMn,11)TiCu12,13)alloys are reflected in the final porous structures. Recently, uniform nanoporous formations of amorphous TiCu and Pd30Ni50P20 precursors have been attained after dealloying.3,14) It is believed that the absence of grain boundary, the large-scaled phase segregations, and intermetallics of amorphous pre-cursors contributes to high uniformity in nanoporous metals. The formation of highly uniform and ultrafine nanoporous
structures have been realized for several amorphous alloy systems, including PdNiP,14)TiCuAu,15,16)TiCuAg17) and TiCuNi18)ternary alloys.
The surface diffusion coefficients of Pt-group elements have been reported to be 1.1©10¹24m s¹2 for palladium (Pd) and 3.6©10¹26m s¹2for platinum (Pt), which are lower than those of Au-group elements Au (2.2©10¹23m s¹2) and Cu (1.1©10¹18m s¹2).19)The surface diffusivity of Ni in the electrolyte was one-tenth that of Cu.9)Generally, the surface diffusion coefficients of the Pt-group elements (Ni, Pd, Pt) and the Au-group (Ag, Au) are much lower than that of Cu. In our former research,1518) the trace addition of a third element (Ni, Ag, Au) was shown to result in the refinement of NPC structures and a decrease in the characteristic pore size from 71 to 9 nm after the micro-alloying of the Au element into Ti60Cu40 amorphous alloy. Therefore, the Pt-group and Au-group are regarded as elements with low surface diffusivity, and will be hereafter referred to the abbreviation, LSDM. Since the surface diffusivity of Pd and Pt in the Pt-group is lower than that of the Au Pt-group, NPCs fabricated from Pd-/Pt-added TiCu amorphous alloys are expected to have afiner nanoporous structure with a pore size of less than 10 nm. The aim of the present study is to fabricate ultrafine cost-effective NPCs by combining their unique advantages, such as the amorphicity of the starting materials in the microstructure, and the retardations in the surface diffusion from LSDMs. In this paper, the refinement effects of NPCs by the micro-alloying of Pt-group and Au-group elements of the Ti60Cu40 base precursor alloys with low surface diffusivities are summarized and compared on the basis of morphology, surface diffusivity and microstructure. The refinement factor is defined to enable to evaluation of the refining ability of the addition of Pt-group and Au-group elements.
2. Experimental Procedure
Ternary alloys with nominal compositions of Ti60Cu39M1 +1Corresponding author, E-mail: zhenhuadan@imr.tohoku.ac.jp, fxqin@
hotmail.com
+2Present address: School of Materials Science and Engineering, Nanjing
(M: Ni, Pd, Pt, Ag, Au) were prepared by arc melting. The micro-alloying elements were divided into two groups: the Au-group (Ag, Au) and the Pt-group (Ni, Pd, Pt). The ribbon samples were fabricated by melting spinning with a dimension of 20 µm in thickness and 2 mm in width. The starting Ti60Cu39M1 amorphous precursor alloys were deal-loyed under the free immersion condition for 43.2 ks in 0.03 M HF solution at room temperature. The details of the experimental procedure have been described in our earlier publications.1518) An X-ray diffractometer was used to analyse the change in the lattice constants of dealloyed alloys and microstructure of precursor alloys and dealloyed alloys. Transmission electron microscopes (JEOL, HC2100 and ARM200) were used to observe the nanoporosity of dealloyed alloys and high-resolution TEM images. The characteristic pore size of dealloyed alloys was confirmed by the single chord method for over 150 sites on TEM images.
3. Results and Discussion
3.1 Characterization of as-spun and dealloyed ribbon alloys
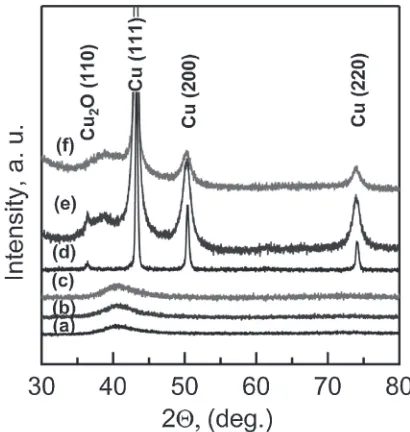
[image:2.595.323.528.69.285.2]The XRD patterns of the as-spun Ti60Cu40, Ti60Cu39Pd1 and Ti60Cu39Pt1 ribbons present one strong and broad diffraction peak at 41° and a weak diffraction peak at 70 75°, indicating an amorphous structure, as shown in Fig. 1. Three strong diffraction peaks were observed in the XRD patterns of the dealloyed Ti60Cu39Pd1 and Ti60Cu39Pt1 ribbons after dealloying for 43.2 ks in the 0.03 M HF solution. The diffraction peaks which had slightly shifted to low diffraction angles were identified to be the characteristic diffraction peaks of fccCu. The small peak around 36° was assigned to the Cu2O phase. The absence of strong diffraction peaks from crystalline Pd and Pt phases indicates that CuPd or CuPt solid solution formed after dealloying. These XRD patterns were similar to those of Ni-stabilized NPCs.18) Figure 2 shows the change in the lattice constant, ¡, and the grain sizes,L, with 1 at%addition of Au-group (G-I) and Pt-group (G-II). The standard lattice constant is reported to be 0.3524 nm for Ni, 0.3608 nm for Cu, 0.3891 nm for Pd, 0.3924 nm for Pt, 0.4078 nm for Au and 0.4085 nm for Ag.20) The lattice constants of NPCs were estimated to be 0.3615 0.3627 nm on the basis of the XRD data of Cu(111) peaks. The lattice constants became larger when the added elements had larger lattice constants except in the case of Ag. As indicated in Fig. 2, the Cu lattice expanded more when Pd and Pt were micro-alloyed into the Ti60Cu40alloy. The added Pd or Pt atoms were thus considered to have invaded the Cu lattice to a higher extent than in the Ag and Au added cases, resulting in the expansion of the Cu lattice constants from 0.3615 to 0.3627 nm. In our former papers, it was found that the Au or Ag phase was formed after dealloying the Ti60Cu39Au1 and Ti60Cu39Ag1 precursor alloys.1517) The absence of diffraction peaks from the Pd or Pt phase in the XRD patterns of dealloyed Ti60Cu39Pd1 and Ti60Cu39Pt1 ribbons and the large expansion of the lattice constants of the NPCs indicated that more Pt-group atoms invaded the Cu lattice than Au-group atoms (i.e., Ag-addition and Au addition) for NPCs from precursor alloys micro-alloyed with
LSDM elements.1518)On the other hand, the grain sizes were reduced to 15 and 13 nm when the Pd and Pt were added into Ti60Cu40 ribbons. The decrease in the grain size was considered to be due to the retardation of the self-diffusion of Cu adatoms.15,16) The diffusion distance of Cu adatoms under free diffusion patterns is prevailed in a long distance.2,5,10,1921)However, the long-distance self-diffusion of Cu adatoms was interrupted by the LSDM adatoms during the rearrangement of adatoms and resulted in an accumu-lation of Cu and LSDM adatoms in a smaller scale. Consequently, smaller grains were formed when the Pt-group elements (Pd, Pt) were used to stabilize NPCs.
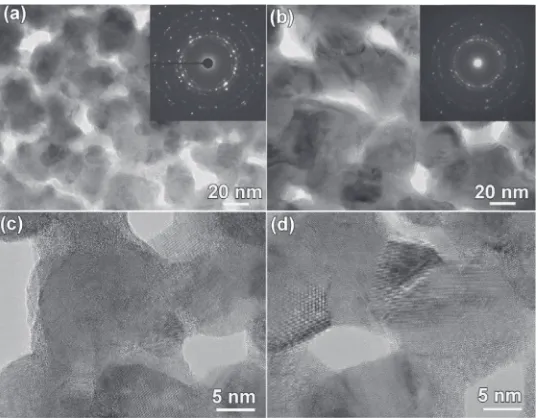
Figure 3 shows a brightfield TEM image (BFI), a selective area diffraction pattern (SADP) and a high-resolution TEM (HRTEM) image of Ti60Cu39Pd1 and Ti60Cu39Pt1 ribbons
Fig. 1 XRD patterns of as-spun and dealloyed Ti60Cu40 (a), (d),
Ti60Cu39Pd1(b), (e) and Ti60Cu39Pt1(c), (f ) ribbons after dealloying in
0.03 M HF solution for 43.2 ks.
Fig. 2 Dependence of the lattice constants and the grain sizes of dealloyed Ti60Cu40, Ti60Cu39Ni1, Ti60Cu39Ag1, Ti60Cu39Au1, Ti60Cu39Pd1 and
Ti60Cu39Pt1ribbons on the addition of the elements. The lines are used
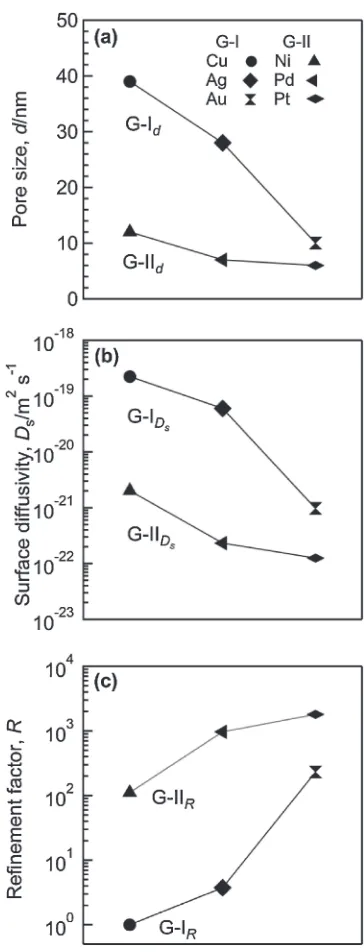
[image:2.595.320.528.341.531.2]after dealloying for 43.2 ks. A bi-continuous porous micro-structure was formed with a characteristic pore size of 7 nm for the dealloyed Ti60Cu39Pd1 ribbon and ca. 6 nm for the dealloyed Ti60Cu39Pt1 ribbon, respectively (Figs. 3(a) and 3(b)). The diffraction rings in the SAD pattern corresponded to Cu (111), (200), (220) and (311) (JCPDS card No.: 02-1225) and the inner ring was for Cu2O(111) (JCPDS card No.: 74-1230). The diffraction rings from the Cu2O phase was absent in the inset SADP in Fig. 3(b). The ligament sizes were confirmed to be ca. 23 nm for the dealloyed Ti60Cu39Pd1 ribbon and ca. 30 nm for the dealloyed Ti60Cu39Pt1ribbon. As shown in Fig. 4(a), the pore size of Pd-/Pt-stabilized NPCs had a mean pore size of 7 and 6 nm, respectively. As shown in the supplementary Fig. S1 and S2, the characteristic pore size of NPCs stabilized by the micro-alloying of Ni, Ag and Au1618) has been reported to be 11, 28 and 12 nm on the basis of TEM analysis, respectively. The mean pore size of dealloyed Ti60Cu40 ribbons confirmed by TEM observation was 39 nm in Fig. S1.18)The pore size decreased more than one order due to the addition of either Pd or Pt as shown in Fig. 4(a). The high-resolution TEM images also demon-strated the formation of crystalline phases. On the basis of XRD, TEM and SEM-EDX analysis, the residue is considered to be fcc CuPd andfccCuPt solid solution. The characteristic scale length of the nanopores and ligaments of dealloyed Ti60Cu39Pd1 and Ti60Cu39Pt1 ribbons decreased dramatically.
3.2 Effects of LSDMs on surface diffusion
On the basis of the surface diffusion controlled coarsening mechanism, the surface diffusivity,Ds, at various dealloying temperatures was estimated by the eq. (1):22)
Ds¼½dðtÞ 4kT
32£t¡4 ð1Þ
Where kis Boltzmann constant (1.3806©10¹23J K¹1),£is surface energy,tis the dealloying time (43 200 s),d(t) is the pore size at t, T is the temperature, and ¡ is the lattice
constant. The pore size of NPCs confirmed by TEM micrographs and lattice constants calculated from XRD data were adopted for calculation ofDs. The surface energy of Cu has been reported to be 1.79 J m¹2.2325)The surface energy of micro-alloyed elements has been reported to be 1.24 J m¹2 for Ag, 1.50 J m¹2for Au, 2.0 J m¹2for Ni, 2.0 J m¹2for Pd, and 2.49 J m¹2 for Pt.24,25) The concentration of Au-group elements (Ag, Au) and Pt-group elements (Ni, Pd, Pt) in the precursor alloys was 1 at%. The concentration of added elements (Ag, Au, Ni, Pd, Pt) in NPCs after dealloying should theoretically be 2.5 at%if the dissolution of Cu in HF solution is not considered. Therefore, the surface energy of LSDM-stabilized NPCs is considered to be very close to that of Cu. The surface energy of Cu, 1.79 J m¹2was adopted for the calculation ofDs. As shown in Fig. 4(b), the value ofDs was estimated to be 2.5©10¹18m2s¹1 for Ti60Cu40 ribbon, 2.3©10¹22m2s¹1 for Ti60Cu39Pd1 ribbon and 1.3©10¹22 m2s¹1 for Ti60Cu39Pt1 ribbon, respectively. The surface diffusivity decreased more than 4 orders of magnitude due to the addition of Pd and Pt. Compared withDsof the Au-group stabilized NPCs, the decrease inDsin the Pt-group stabilized NPCs was remarkable.
The refining factor, R, is defined as the ratio between the surface diffusivity, Ds, of NPC obtained from amorphous Ti60Cu40 precursor (numerator) and NPCs stabilized by LSDMs (denominator).
R¼D Cu s DLs
½dðtÞCu4
½dðtÞL4
½¡Cu4
½¡L4 ð2Þ
As shown in Fig. 4(c), the estimated refining factor was 968 for Ti60Cu39Pd1 ribbon and 1780 for Ti60Cu39Pt1 ribbon, respectively. In other cases, the value ofRchanged from 4 for the dealloyed Ti60Cu39Ag1 ribbon, 111 for the dealloyed Ti60Cu39Ni1 ribbon and 231 for the dealloyed Ti60Cu39Au1 ribbon, respectively. The refining efficiency of the micro-alloying of the Pt-group elements into the Ti60Cu40precursor alloy was one order higher than that of the Au-group cases.
Fig. 3 Brightfield TEM images and high resolution TEM images of dealloyed Ti60Cu39Pd1(a), (c) and Ti60Cu39Pt1(b), (d) ribbons. The
[image:3.595.165.434.69.278.2]The lower value ofRfor Ti60Cu40alloy micro-alloyed by Au-group (G-I) elements could result from several factors: (1) the self-diffusion coefficients of Ag and Au are larger than that of Cu,2630) (2) the significant difference in the atomic radii.20)As has been reported,2630)the self-diffusion coefficients of Au- and Pt-group elements are ranked as following: Ag>Cu>Au>Ni>Pd>Pt. As such, there are more chances for Ag atoms to meet with other Ag atoms to form clusters and to develop the Ag phase because it has a larger self-diffusion coefficient than Cu atoms.26,29)The self-diffusion coefficient of Au is slightly smaller than that of Cu.27) Because the difference in the atomic radius between Cu and Ag, and Cu and Au is about 13%, the incorporation of Ag/Au atoms into the Cu lattice difficult. On the other hand, the self-diffusion coefficients of Pt-group (G-II)
elements are smaller than those of Cu,28,30)and the formation of the crystalline phase of G-II elements (Ni, Pd, Pt) was interrupted by the diffusion of Cu atoms. Furthermore, the difference in the atomic radius between Cu and Pd/Pt elements is about 8%, and the incorporation of Pd/Pt into the Cu lattice appears to occur more readily. The change in the lattice constants of the NPCs stabilized by G-I and G-II indicated by XRD patterns in Fig. 1 and Refs. 15, 17, 18), supports our hypothesis. As described above, the formation of the Ag and Au phase after dealloying is considered to be due to the difference in self-diffusion properties and the atomic radius. The addition of the LSDMs in Group I caused the formation of the crystalline Ag/Au phase and the refining factor of Group I was small. The addition of the LSDMs in Group II mainly resulted in the invasion of the Cu lattice, with some Cu atoms in the lattice substituted by Ni, Pd and Pt atoms, forming solid solutions, and the refining factors for Group II were high.
The diffusion proceeding in the interfacial regions between Cu, LSDM adatoms and Ti adatoms played a key role in the formation offine NPCs. As has been reported,31)a bimodal nanoporous structure with a pore size of 10 and 20 nm has been fabricated from Al75Pd17.5Au7.5 precursor alloys by successive dealloying. The initial heterogeneous micro-structure consisting of Al2Au- and Al3Pd-type intermetallics causes the formation of a bimodal nanoporous structure. The similar evolution of bimodal or multimodal nanoporosity on precursor alloys heterogeneous in microstructure has been reported.1,2,911) Amorphous precursor alloys with homoge-neously distributed Cu, Ti and LSDM atoms also have quite an important refining effect. The uniform distribution of added Pd and Pt atoms in final NPCs resulted in smaller nanopores, as shown in Figs. 3 and 4. In 2008, fine nanoporous AuPt alloys with a pore size of about 5 nm were fabricated from an Ag65Au29Pt6precursor.32)The alloying of 6 at% Pt into the Ag65Au35 alloy was shown to result in a reduction of the pore size from 1020 nm to about 4 nm, which also supports our present results. However, the high cost of Au and Pt weakens their application potential. By micro-alloying the 1 at%Pt-group elements, it is possible to fabricate cost-effective NPCs with a pore size of approx-imately 6 nm, comparable to high-cost AuPt nanoporous in nanoporosity.
4. Conclusions
In this paper, the refining effect of the 1 at% addition of Au-group (G-I: Ag, Au) and Pt-group (G-II: Ni, Pd, Pt) on the nanoporous Cu structure fabricated from micro-alloyed Ti60Cu40alloy via dealloying was summarized. The addition of G-II metals was shown to be more effective in refining nanoporous structure than the addition of G-I metals. Nanoporous Cu with a pore size of less than 7 nm was obtained from Ti60Cu39Pd1 and Ti60Cu39Pt1 ribbons after dealloying. The residue of dealloyed Ti60Cu39Pd1 and Ti60Cu39Pt1ribbons was confirmed to be either afccCu(Pd) or Cu(Pt) solid solutions. The refining factor of the G-I metals was as follows: 4 for Ag, 231 for Au. The refining factor of the G-II metals was almost one order higher than for the G-I metals. The strategy outlined in this work has the
Fig. 4 Refining factor and the mean pore size of dealloyed Ti60Cu39Ni1,
Ti60Cu39Ag1, Ti60Cu39Au1, Ti60Cu39Pd1 and Ti60Cu39Pt1 ribbons. The
[image:4.595.77.259.65.541.2]potential to be extended to other alloys to fabricate fine nanoporous metals with a nanoporosity comparable to that of high-cost catalysts.
Acknowledgements
The authors gratefully acknowledge the financial support from the Ministry of Education, Culture, Sports, Science and Technology (MEXT) through Grant-In-Aid for Science Research in a Priority Area on “Research and Development Project on Advanced Materials Development and Integration of Novel Structured Metallic and Inorganic Materials” and a Grant-in-Aid for Young Scientists (B) under Grant No. 24760567. We would like to thank Mr. Kobayashi for his help with TEM observations.
REFERENCES
1) W. B. Liu, S. C. Zhang, N. Li, J. W. Zheng and Y. L. Xing:
Microporous Mesoporous Mater.138(2011) 17.
2) Z. H. Zhang, Y. Wang, Z. Qi, W. H. Zhang, J. Y. Qin and J. Frenzel:
J. Phys. Chem. C113(2009) 1262912636.
3) Z. H. Dan, F. X. Qin, Y. Sugawara, I. Muto and N. Hara:Intermetallics
29(2012) 1420.
4) J. R. Hayes, A. M. Hodge, J. Biener and A. V. Hamza:J. Mater. Res.21
(2006) 26112616.
5) L. Y. Chen, J. S. Yu, T. Fujita and M. W. Chen:Adv. Funct. Mater.19
(2009) 12211226.
6) G. C. Bond and D. T. Thompson:Catal. Rev. Sci. Eng.41(1999) 319 388.
7) J. R. Weissmüller, N. Viswanath, D. Kramer, P. Zimmer, R. Wuerschum and H. Gleiter:Science300(2003) 312315.
8) J. Biener, A. M. Hodge, J. R. Hayes, C. A. Volkert, L. A. Zepeda-Ruiz, A. V. Hamza and F. F. Abraham:Nano Lett.6(2006) 23792382.
9) M. Hakamada and M. Mabuchi:J. Alloy. Compd.485(2009) 583587.
10) Z. Qi, Z. H. Zhang, H. L. Jia, Y. J. Qu, G. D. Liu and X. F. Bian:
J. Alloy. Compd.472(2009) 7178.
11) Z. H. Dan, F. X. Qin, Y. Sugawara, I. Muto and N. Hara:Intermetallics
31(2012) 157164.
12) Z. H. Dan, F. X. Qin, Y. Sugawara, I. Muto and N. Hara:J. Alloy. Compd.557(2013) 166171.
13) Z. H. Dan, F. X. Qin, Y. Sugawara, I. Muto and N. Hara:Mater. Trans.
54(2013) 11201125.
14) J. S. Yu, Y. Ding, C. X. Xu, A. Inoue, T. Sakurai and M. W. Chen:
Chem. Mater.20(2008) 45484550.
15) Z. H. Dan, F. X. Qin, Y. Sugawara, I. Muto and N. Hara:Mater. Trans.
53(2012) 17651769.
16) Z. H. Dan, F. X. Qin, Y. Sugawara, I. Muto and N. Hara:Microporous Mesoporous Mater.165(2013) 257264.
17) Z. H. Dan, F. X. Qin, A. Makino, Y. Sugawara, I. Muto and N. Hara:
J. Alloy. Compd.586(2014) S134S138.
18) Z. H. Dan, F. X. Qin, A. Makino, Y. Sugawara, I. Muto and N. Hara:
Mater. Lett.94(2013) 128131.
19) Y. Ding, Y. J. Kim and J. Erlebacher:Adv. Mater.16(2004) 1897 1900.
20) J. Erlebacher:J. Electrochem. Soc.151(2004) C614C626.
21) J. Erlebacher, M. J. Aziz, A. Karma and K. Sieradzki: Nature 410
(2001) 450453.
22) J. M. Dona and J. Gonzalez-Velasco:J. Phys. Chem.97(1993) 4714 4719.
23) W. Martienssen and H. Warlimont, (Eds.): Springer Handbook of Condensed Matter and Materials Data, (Springer, Berlin, Heidelberg, New York, 2005) p. 139.
24) W. Martienssen and H. Warlimont, (Eds.): Springer Handbook of Condensed Matter and Materials Data, (Springer, Berlin, Heidelberg, New York, 2005) p. 112.
25) W. R. Tyson and W. A. Miller:Surf. Sci.62(1977) 267276.
26) G. Ghosh:Acta Mater.49(2001) 26092624.
27) S. M. Makin, A. H. Rowe and A. D. LeClaire:Proc. Phys. Soc. LXX
70(1957) 545552.
28) J. Wang, H. S. Liu, L. B. Liu and Z. P. Jin:CALPHAD32(2008) 94 100.
29) C. P. Wang, L. N. Yan, J. J. Han and X. J. Liu:CALPHAD37(2012) 5764.
30) C. L. Liu, J. M. Cohen, J. R. Adamas and A. F. Voter:Surf. Sci.253
(1991) 334344.
31) X. G. Wang, J. Z. Sun, C. Zhang, T. Y. Kou and Z. H. Zhang:J. Phys. Chem. C116(2012) 1327113280.
32) J. Snyder, P. Asanithi, A. B. Dalton and J. Erlebacher:Adv. Mater.20