Synthesis of TiB
2-TiC-Ti
3SiC
2Composites by Reactive Hot Pressing
of B
4C-SiC-Ti Powder Mixtures
Hitoshi Taimatsu
1, Shigeaki Sugiyama
2and Shuhou Koseki
1;*1
Department of Materials Science and Engineering, Faculty of Engineering and Resource Science, Akita University, Akita 010-8502, Japan
2Akita Prefectural Research and Development Center, Akita 010-1623, Japan
TiB2-TiC-Ti3SiC2composites were reaction-sintered from B4C-xSiC-(3þ2x)Ti (x¼0to 1) powder mixtures using reactive hot pressing,
and the phase relation of reaction products and sintering behavior were investigated. The reaction B4CþxSiCþ(3þ2x)Ti!
2TiB2þ(1x)TiCþxTi3SiC2 proceeded fundamentally during hot pressing. Although the reaction demands no production of TiC phase
atx¼1, TiC phase was formed due to the nonstoichiometry of TiC and Ti3SiC2phases produced. The hot-pressed composites containing the
layered compound Ti3SiC2had no preferential texture. Both TiB2and TiC were first produced near 960C during heating, and then Ti3SiC2near
1200C. The product Ti
3SiC2contributed effectively to the densification of the composites above 1450C.
[doi:10.2320/matertrans.MRA2008174]
(Received May 30, 2008; Accepted July 10, 2008; Published August 20, 2008)
Keywords: titanium boride, titanium carbide, titanium silicon carbide, reaction sintering, solid state reactions
1. Introduction
Titanium boride and carbide, TiB2and TiC, are very hard
and chemically stable compounds with good electrical conductivity like WC. If they can be consolidated easily, their use will increase as hard engineering ceramics possible to be readily formed using electro-discharge machining. Unfortunately their sinterability is so bad that they can not be easily sintered even by hot pressing. For TiB2-TiC
compo-sites, however, a reactive hot pressing technique can be applied. Barsoum et al.1) and Brodkin et al.2,3) obtained dense TiB2-TiC composites at 1600C using the reactive
hot-pressing of B4C and Ti powder mixtures, in which
the displacement reaction B4Cþ3Ti!2TiB2þTiC
pro-ceeded. This sintering temperature is much lower than that in the ordinary hot pressing of TiB2 and TiC powder
mixtures.4)We also successfully applied basically the same technique to prepare dense composites of TiB2-TiC,5)B4
C-TiB2-TiC6) and TiB2-Ti(C, N).7) Thus the reactive hot
pressing accompanied by the solid state reaction is very effective for the consolidation of TiB2-TiC ceramics.
Titanium silicon carbide, Ti3SiC2, have been drawn
attention as a machinable ceramic.8,9) This ceramic, which is a layered compound with a hexagonal crystal structure, is deformable at high temperatures and resistant to thermal shock.10–12)Because of these properties, Ti
3SiC2addition to
improve fracture toughness of ceramics has been
investigat-ed.13–15) However, these properties also propose a use of
Ti3SiC2 as a ceramic sintering aid for the hot pressing of
difficultly sinterable ceramics. When B4C-SiC-Ti powder
mixtures are used as the starting powder and the reaction B4CþxSiCþ(3þ2x)Ti!2TiB2þ(1x)TiCþxTi3SiC2
is allowed to proceed during hot pressing, TiB2-TiC-base
ceramics may be consolidated at lower temperatures because of the displacement reaction and the deformable product Ti3SiC2. Furthermore, these ceramics probably promise to
have better properties in oxidation resistance as well as in fracture toughness, because Ti3SiC2is much more
oxidation-resistant than TiC.16)In this study, therefore, we intended to prepare dense TiB2-TiC-Ti3SiC2ceramics by the reactive hot
pressing of the B4C-SiC-Ti powder mixtures. Reaction
products and microstructure were surveyed for sintered bodies, and the phase relation of the reaction products and sintering behavior were investigated.
2. Experimental
The starting materials for reaction sintering were B4C
powder (Rare Metallic, average particle diameter 1.05mm, purity 99 mass%, B/C molar ratio 4.0), SiC powder (Ibiden, average particle diameter 0.31mm, impurities (mass%): free SiO2 0.39, free C 1.08, total Al 0.0153, total Fe
0.0173, H2O 0.20) and Ti powder (Rare Metallic, average
particle diameter 24.5mm, purity 99.5 mass%). These pow-ders were weighed and mixed in an Al2O3mortar at ratios to
produce TiB2-TiC-Ti3SiC2 composites in accordance with
the reaction
B4CþxSiCþ(3þ2x)Ti
!2TiB2þ(1x)TiCþxTi3SiC2 (x¼0to 1)
ð1Þ
during reactive hot pressing. Since both the TiC and Ti3SiC2
practically have nonstoichiometry as described later, precise quantity of each product does not obey eq. (1). The mole fractions of the reactants are1=ð4þ3xÞfor B4C,x=ð4þ3xÞ
for SiC andð3þ2xÞ=ð4þ3xÞfor Ti.
The powder mixture was pressed at 50 MPa in a graphite die with an inner diameter of 20 mm and outer diameter of 50 mm. The powder compact was sintered in the die using a resistance-heated hot-pressing system (the Spark-Plasma Sintering Machine, Sumitomo Coal Mining, SPS-2080) in a vacuum under the following conditions: sintering temper-ature 2000C for x¼0, 1600C for x¼0:1 to 0.5 and 1500C for x¼0:5 to 1; heating rate 50C min1; applied pressure 50 MPa; holding time at each sintering temperature *Graduate Student, Akita University
10 min. The temperature was measured 10 mm inside the outer surface of the die (5 mm outside the sample) through a small hole using an optical pyrometer. The displacement of a pressing ram was monitored during heating. The decrease in length per unit length of a sample for a temperature rise of 1C, i.e., the shrinkage coefficient of the sample, was calculated from net displacement obtained by correcting measured displacement for the expansion of load train spacers and work punches during heating. Sintered bodies were examined for reaction products and microstructure using a high-power X-ray diffractometer (Rigaku, RINT-2500VHF, output 18 kW, Cu K) and an electron probe
microanalyzer (JEOL, JXA-8200), respectively. Their bulk density was measured by the Archimedean method.
3. Results and Discussion
3.1 Reaction products
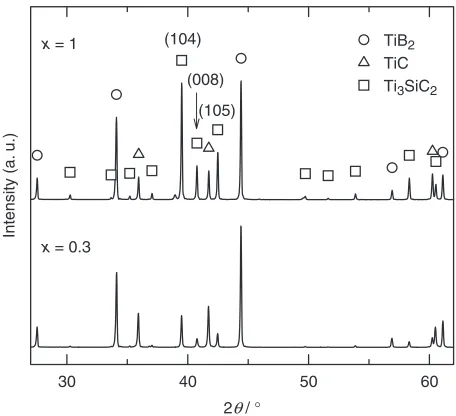
X-ray diffraction (XRD) patterns for the sintered bodies, which were obtained from their polished surfaces perpen-dicular to the compression direction in hot pressing, showed that TiB2, TiC and Ti3SiC2 were produced as expected in
eq. (1) and that any unreacted B4C, Ti and SiC did not
remained. The XRD patterns of the composites of x¼0:3 and 1 are shown in Fig. 1. The lattice plane having the strongest reflection peak listed in the JCPDS file17–19)is (101) for TiB2, (200) for TiC and (008) for Ti3SiC2. The relative
intensities of diffraction peaks were very close to those in the JCPDS file for both TiB2and TiC, but were not for Ti3SiC2.
In the JCPDS file, the firstly, secondly and thirdly strongest intensities for Ti3SiC2 are reflected from (008), (104) and
(105) planes, respectively. In this study, the strongest intensity for Ti3SiC2 was obtained from (104) plane and
the relative intensities agreed well with calculated ones20) based on its crystal structure. Such inconsistency with the JCPDS file in the relative intensities for Ti3SiC2 was found
in many XRD analyses, e.g., Ti3SiC2 powder10,20–24) and
surfaces of pressure-sintered Ti3SiC2 polycrystals.12,26) The
pole figure analysis for surfaces of Ti3SiC2 polycrystals
prepared by the reactive hotpressing of Ti, SiC and C powders showed clearly that they had no preferential texture.27) Tang et al.28) examined the effect of the glass-mounting of Ti3SiC2powder samples for XRD on the change
in orientation of crystallites, and pointed out that the powder samples easily formed {001} texture in the preparation because of the planner structure of Ti3SiC2 crystallites and
that the relative intensities for a powder prepared to have randomly distributed crystal planes were in agreement with calculated ones.20)These facts strongly suggest that such hot pressing as that used in this study did not bring about a particular texture in a polycrystalline Ti3SiC2due to applied
pressure. According to Murugaiahet al.,24)crystal grains at free surfaces of pressureless-sintered Ti3SiC2 easily have
(008) orientation.
The relative intensity of each product, Ix=Ii, was
calculated as a measure of the product concentration, where
Ixis the peak intensity of the strongest reflection for a product X andIithe sum of those for the all products. The Ti3SiC2
phase increased with xin eq. (1), and correspondingly the TiB2and TiC phases decreased, as shown in Fig. 2. Although
eq. (1) demands no existence of TiC phase at x¼1, an unignorable amount of TiC was detected. TiC has wide nonstoichiometry for carbon as widely known, and Ti3SiC2
also is nonstoichiometric. Their nonstoichiometry requires a modification in eq. (1).
TiC can have a large carbon deficiency: in TiC ranges
from 1 to about 0.5. Storms29) summarized many lattice constant data of TiC, and concluded that the lattice constant
of oxygen-free TiC increases a little with decreasingdown to 0.8 and below this value greatly decreases with decreasing
. Oxygen soluble in TiC lowers the lattice constant. Oxygen is an inevitable impurity in TiC under such an ordinarily-controlled atmosphere as in this work. The lattice constant of TiC phase formed in the sintered bodies is shown in Fig 3. The lattice constant slightly increased withxbelowx¼0:1, and above this value decreased. The lattice constant of TiC phase at x¼0, where TiC of ¼1 must be produced, is smaller than that of oxygen-free TiC of ¼1. This fact
30 40 50 60
Intensity (a.
u.)
TiB2 TiC Ti3SiC2
x = 0.3
x = 1 (104)
(008)
(105)
2θ/ °
Fig. 1 X-ray diffraction patterns of the composites ofx¼0:3and 1.
0 0.2 0.4 0.6 0.8 1
0 0.2 0.4 0.6 0.8 1
x
TiC Ti3SiC2
Σ
Ii
Relativ
e
intensity
,
Ix
/ TiB2
1500°C 1600°C 2000°C
[image:2.595.313.541.74.278.2] [image:2.595.55.283.558.766.2]means that TiC phase contained oxygen and its carbon content decreased with x. The lattice constants a and cof Ti3SiC2 phase formed in the sintered bodies were not
changed withxas shown in Fig. 4. The constantsaandcare in agreement with the values reported by Jeitschko and Nowtony.30)
3.2 Sintering behavior
The bulk density of sintered bodies was shown in Fig. 5. Fully dense bodies were prepared at 2000C for x¼0, at 1600C forx¼0:1and 0.3 and at 1500C forx¼0:5to 1. In the previous study,5) the powder mixture of x¼0, which produced only TiB2and TiC, requires a sintering temperature
above 1800C for full densification by the reactive hot pressing. The formation of Ti3SiC2 significantly improves
the sinterability of TiB2and TiC.
In every shrinkage coefficient curve during heating, several peaks were observed. Shrinkage coefficient curves
during heating are shown in Fig. 6. There are two local maximum points A and B in the coefficient curve forx¼0, where TiB2 and TiC were only produced as reaction
products, and three local maximum points C, D and E in the curves for x0:3, where TiB2, TiC and Ti3SiC2 were
produced. The points A and C are located at the same temperature. According to the study of the solid-state reactions between B4C and Ti powders,31) TiB2 and TiC
are substantially produced at 1000C. In our study, temper-ature was measured for a graphite die. Although real sample temperature becomes higher than die temperature with increasing temperature in the resistance-heated hot-pressing system used in this study, the temperature differences is small below 1200C, e.g., 1231C at a die temperatures of 1200C.32) Points A and C are both located near 960C. The reaction of eq. (1) accompanies a volume reduction.
0 0.2 0.4 0.6 0.8 1
0.431 0.432 0.433
x
Lattice constant,
a
/ nm
2000°C 1500°C 1600°C
Fig. 3 Lattice constants of TiC phase formed in the composites.
0.2 0.4 0.6 0.8 1
1.76 1.765 1.77
x
Lattice constant,
c
/ nm c-axis 0.3 0.305 0.31
a-axis
Lattice constant,
a
/ nm
1500°C 1600°C
Fig. 4 Lattice constants of Ti3SiC2phase formed in the composites.
0 0.2 0.4 0.6 0.8 1
3.5 4.0 4.5 5.0
x
Bulk density
,
d
/ 10
3 kg
m
-3
1500°C 1600°C 2000°C
Fig. 5 Bulk densities of the composites.
1000 1500 2000
0 2 4 6 8 10 12
Temperature, T / °C
Shr
inkage coefficient,
χ
x = 0.1
x = 0.3
x = 0.5
x = 0.8
x = 1 C
D 0
2 4 6 8 10 12
x = 0
shr
inkage
A
E B
/ 10
-3 K
-1
Fig. 6 Shrinkage coefficient curves for the composites during heating. A and C: formation of TiB2and TiC, B: densification of TiB2and TiC,
[image:3.595.56.285.71.273.2] [image:3.595.313.540.76.278.2] [image:3.595.314.538.320.533.2] [image:3.595.56.283.320.530.2]Although TiC was in fact produced more than in eq. (1), a volume reduction must occur because the molar volume of the product TiC is the smallest in the reactants and products. Hence, the shrinkage in points A and C was caused by the production of TiB2and TiC mixtures, and that in point B near
1700C resulted from their densification.
In the synthesis of Ti3SiC2 from a Ti-Si-TiC powder
mixture, Ti3SiC2is not produced at 1000C, but at 1100C.23)
Gaoet al.24)reported that, in the synthesis of Ti
3SiC2from a
Ti-Si-C powder mixture by the same hot-pressing system as in this study, a large sample volume change due to the production of Ti3SiC2 occurred at 1170C during heating.
These facts suggest that the shrinkage in point D near 1200C is due to the formation of Ti3SiC2. The samples ofx¼0:1
and 0.3 were fully consolidated at 1600C, and those ofx¼ 0:5to 1 at 1500C. Consequently, the shrinkage near point E is caused by the densification of TiB2, TiC and Ti3SiC2
mixtures. Ti3SiC2 contributes to the densification of the
composites above 1450C.
3.3 Microstructure
The sintered bodies had characteristic morphology for microstructure, in which the shapes of starting large Ti particles remained strongly. The microstructure is shown in Fig. 7, where dark phases are TiB2, grey ones TiC and white
ones Ti3SiC2. There are Ti3SiC2 phases outside and inside
of rings composed of very fine TiB2 grains. As shown in
Fig. 7(b), contacts between grains in TiB2 rings are not
necessarily complete. There are very thin Ti3SiC2 layers at
interfaces between grains in many places. Many angular TiB2grains are also formed inside of TiB2rings. Most TiC
phases are formed near centers of TiB2rings. As mentioned
above, TiB2 and TiC phases were first produced. The TiB2
phases were probably formed first on the peripheries of Ti particles, and the TiC phases inside the TiB2phases forming
rings. The outer diffusion of Ti through the TiB2 rings, the
inner diffusion of C and Si through the rings and the inner diffusion of B through the rings are needed for the respective formation of Ti3SiC2 outside the rings, Ti3SiC2 inside the
rings and angular TiB2grains inside the rings.
The analysis of TiB2 phases by EPMA scarcely showed
solubility of Si and C. The nonstoichometry of TiB2is small:
65.6 to 66.7 mol% B.33)Assuming that TiB2 is
stoichiomet-ric, the average composition of the total TiC and Ti3SiC2
phases is given by the rational formula Ti0:5Six=ð2þ4xÞ Cð1þxÞ=ð2þ4xÞ because the equation
B4Cþ(3þ2x)TiþxSiC
¼2TiB2þ(1þ2x)TiþxSiþ(1þx)C
ð2Þ
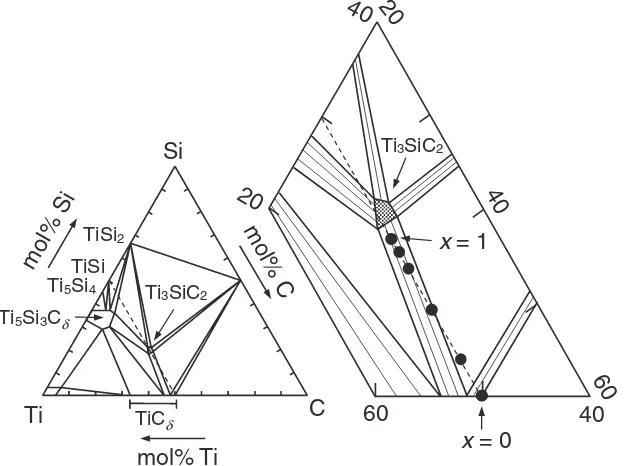
holds. The experimental points estimated in the Ti-Si-C phase diagram34) are shown in Fig. 8. This diagram well explains the fact that a large amount of Ti3SiC2and a small
amount of TiC were formed atx¼1. In the diagram, a very slight amount of SiC should coexist in the composite of
x¼0:1. In fact, any SiC phases were not detected by XRD. As thexvalue approaches 1 in the diagram, the correspond-ing tie line between the Ti3SiC2 and TiC phases at
equi-librium moves to the high carbon-deficient TiC side: the
10
(a)
µ
m
10
(c)
µ
m
10
(d)
µ
m
5
TiB
2Ti
3SiC
2
TiC
(b)
µ
m
Fig. 7 Microstructures (backscattered electron images) of the composites. (a):x¼0:5, 1500C; (b): enlarged view of (a); (c):x¼0:1,
[image:4.595.78.517.72.386.2]carbon content of TiC phase formed in a sintered body decreases with increasing x. This is consistent with the experimental results. The phase diagrams35,36)different in the constitutional range of Ti3SiC2 phase from the diagram
shown in Fig. 8 were also presented. In these diagrams, Ti3SiC2 phase only must be produced at x¼1. This is
incoherent from the results shown in Fig. 2.
4. Conclusions
The Ti3SiC2 phase in the TiB2-TiC-Ti3SiC2 composites
which were prepared by the reactive hotpressing of B4 C-xSiC-(3þ2x)Ti (x¼0 to 1) powder mixtures increased withx, and correspondingly the TiB2and TiC phases in the
composites decreased fundamentally in accordance with the reaction B4CþxSiCþ(3þ2x)Ti!2TiB2þ(1x)TiCþ xTi3SiC2. At x¼1, however, TiC was formed due to the
nonstoichiometry of TiC and Ti3SiC2 phases. The powder
mixtures of x0:1 which produced Ti3SiC2 were fully
densified by hot pressing at much lower temperatures than that producing TiB2 and TiC only. No preferential texture
existed in the hot-pressed composites containing Ti3SiC2
phase. Both TiB2 and TiC were first produced near 960C
during heating, and their densification without Ti3SiC2
formation occurred near 1700C. Ti
3SiC2 phase was
pro-duced near 1200C, and it contributed to the densification of the composites above 1450C. The carbon deficiency of the product TiC phase was increased with x because the tie line between the Ti3SiC2 and TiC phases at equilibrium
in the Ti-Si-C phase diagram moves to the high carbon-deficient TiC side.
REFERENCES
1) M. W. Barsoum and B. Houng: J. Am. Ceram. Soc.76(1993) 1445– 1451.
2) D. Brodkin, S. R. Kalidindi, M. W. Barsoum and A. Zavaliangos: J. Am. Ceram. Soc.79(1996) 1945–1952.
3) D. Brodkin, A. Zavaliangos, S. R. Kalidindi and M. W. Barsoum: J. Am. Ceram. Soc.82(1999) 665–672.
4) I. I. Spivac, R. A. Andrievskii, V. V. Klimenko and V. D. Lazarenko: Porosh. Metall.140(1974) 17–21.
5) S. Sugiyama, M. Kimura, K. Asari, T. Yoshida, T. Atsumi and H. Taimatsu: J. Jpn. Soc. Powder Powder Met.45(1998) 1065–1070. 6) S. Sugiyama, K. Asari and H. Taimatsu: J. Jpn. Soc. Powder Powder
Met.47(2000) 308–314.
7) S. Sugiyama, K. Asari and H. Taimatsu: J. Ceram. Soc. Jpn.108(2000) 747–752.
8) R. Pampuch, J. Lis, J. Piekarczyk and L. Stobierski: J. Mater. Synth. Process.1(1993) 93–100.
9) J. Lis, R. Pampuch, J. Piekarczyk and L. Stobierski: Ceram. Intern.19 (1993) 219–222.
10) M. W. Barsoum and T. El-Raghy: J. Am. Ceram. Soc. 79 (1996) 1953–1956.
11) M. W. Barsoum, D. Brodkin and T. El-Raghy: Scripta Mater.36(1997) 535–541.
12) M. W. Barsoum and T. El-Raghy: J. Mater. Synth. Process.5(1997) 197–216.
13) Y. M. Luo, S. Q. Li, J. Chen, R. G. Wang, J. Q. Li and W. Pan: Am. Ceram. Soc.85(2002) 3099–3101.
14) W. Pan and S. Shi: J. Euro. Ceram. Soc.27(2007) 413–417. 15) C. Qin, L. Wang, S. Bai, W. Jiang and L. Chen: Key Eng. Mater.336–
338(2007) 1383–1385.
16) M. W. Barsoum, T. El-Raghy and L. U. J. T. Ogbuji: J. Electrochem. Soc.144(1997) 508–2516.
17) Powder Diffraction File, (JCPDS-International Center for Diffraction Data, Pennsylvania, 1994) No. 35-741.
18) Powder Diffraction File, (JCPDS-International Center for Diffraction Data, Pennsylvania, 1994) No. 32-1383.
19) Powder Diffraction File, (JCPDS-International Center for Diffraction Data, Pennsylvania, 1994) No. 40-1132.
20) S. Arunajatesan and A. H. Carim: Mater. Lett.203(1994) 19–324. 21) Z. Sun, S. Yang and H. Hashimoto: J. Alloys Comp. 368 (2004)
312–317.
22) H. Li, D. Chen, J. Zhou, J. H. Zhao and L. H. He: Mater. Lett.58(2004) 1741–1744.
23) S. Yang, Z. M. Sun and H. Hashimoto: J. Alloys Comp.368(2004) 312–317.
24) A. Murugaiah, A. Souchet, T. El-Ragy, M. Radovic, M. Sundburg and
C
m
o
l%
C
Ti5Si3Cδ
Ti5Si4
TiSi
Si
TiSi2
Ti3SiC2
Ti
mol% Ti
mo
l%
S
i
TiCδ
60
40
20
40
Ti3SiC2
x
= 0
x
= 1
20
6
0
4
0
[image:5.595.142.454.77.310.2]M. W. Barsoum: J. Am. Ceram. Soc.87(2004) 550–556.
25) N. F. Gao, J. T. Li, D. Znag and Y. Miyake: J. Euro. Ceram. Soc.22 (2000) 2365–2370.
26) Z. Zhang, Z. Sun, H. Hashimoto and T. Abe: J. Am. Ceram.86(2003) 431–436.
27) B. J. Kooi, R. J. Poppen, N. J. M. Carvalho, J. Th. M. De Hosson and M. W. Barsoum: Acta Mater.51(2003) 2859–2872.
28) K. Tang, C. Wang, X. Xu and Y. Huang: Mater. Lett. 55 (2002) 50–54.
29) E. K. Storms:The Refractory Carbides, (Academic Press, New York, 1967) pp. 1–17.
30) W. Jeitschko and H. Nowtony: Monatsch. Chem.98(1967) 329–337. 31) H. Taimatsu, T. Atsumi, T. Okaniwa and K. Kodama: J. Ceram. Soc.
Jpn.107(1999) 1041–1045.
32) H. Taimatsu, Y. Kodaira and S. Sugiyama: Mater. Trans.46(2008) 1256–1261.
33) T. B. Massalsky:Binary Alloy Phase Diagrams, Vol. 1, (The Materials Information Society, Materials Park, Ohio) pp. 544–548.
34) L. Ratiff and G. W. Powell: Research on Diffusion in Multiphase Ternary Systems, AFML Tech. Rep. 70-42, (National Technical Information Service, Alexandria, Virginia, 1970).
35) W. J. J. Wakelkamp, F. J. J. van Loo and R. Metselaar: J. Euro. Ceram. Soc.8(1991) 135–139.