Quantitative Evaluation of Hydrogen Solubility and Diffusivity of V–Fe Alloys
toward the Design of Hydrogen Permeable Membrane for Low Operative
Temperature
A. Suzuki
1,*1, H. Yukawa
1,*2, T. Nambu
2, Y. Matsumoto
3and Y. Murata
11Department of Materials Science and Engineering, Graduate School of Engineering, Nagoya University, Nagoya 464–8603, Japan 2National Institute of Technology, Suzuka College, Suzuka 510–0294, Japan
3National Institute of Technology, Oita College, Oita 870–0152, Japan
A concept for alloy design of hydrogen permeable membrane with high hydrogen permeability and long-term durability has been proposed in view of the PCT factor, fPCT, and the ductile-to-brittle transition hydrogen concentration, DBTC. As an example, V–10mol%Fe alloy has been designed for low operative temperature, which exhibits excellent and stable hydrogen permeability for at least 1000 hours at 573 K without brittle fracture.
In addition, the alloying effects of iron on the hydriding property and the hydrogen diffusivity have been investigated quantitatively in order to establish a way to design optimal composition of V-Fe based hydrogen permeable alloy under any given conditions. It is found that the addition of iron into vanadium increases linearly the partial molar enthalpy change, ∆H¯0.2 , of hydrogen for hydrogen dissolution, but scarcely affects on the partial molar entropy change, ∆¯S0.2 . It is also found that both the activation energy, E and the pre-exponential factor, B0, of the mobility for hydrogen diffusion decrease linearly with increasing the mole fraction of iron, meaning that the addition of iron enhances the hy-drogen diffusivity at low temperature below about 700 K. The evaluation in view of the four parameters, ∆H¯0.2 , ∆¯S0.2 , E and B0, is useful for deep understanding of the property of hydrogen permeable metal membrane. Following the concept for alloy design in view of these four pa-rameters, optimal alloy composition can be designed under any given conditions. The hydrogen permeability of the designed alloy under the condition can also be estimated quantitatively. [doi:10.2320/matertrans.MAW201604]
(Received April 19, 2016; Accepted July 1, 2016; Published August 12, 2016)
Keywords: hydrogen permeation, hydrogen chemical potential, pressure–composition–isotherm, hydrogen mobility, V–based alloy membrane
1. Introduction
Hydrogen permeable alloy membranes are important key materials for hydrogen separation and purification technolo-gies1–5). For example, Pd–Ag and Pd–Cu alloy membranes are widely used practically for these purposes5). Recently, there has been a great demand for the development of new hydrogen permeable alloys instead of Pd–based alloys in or-der to reduce the material cost as well as to improve the hy-drogen permeability6–11). Nb–based and V–based alloys are promising materials for hydrogen permeable membranes to be substituted for currently used Pd–based alloys. This is be-cause they are less expensive and possess higher hydrogen permeability than currently used Pd–based alloys. However, there is still a large barrier to the practical application due to their poor resistance to hydrogen embrittlement6,12).
Recently, the mechanical properties of niobium (Nb) and vanadium (V) membrane in hydrogen gas atmosphere at high temperature have been investigated by the in-situ small punch (SP) test method13,14). It is found that a ductile–to–brittle tran-sition occurs drastically at the hydrogen concentration around 0.2 0.25 (H/M) for both Nb and V membranes13,14). This critical hydrogen concentration is referred to as the DBTC (the Ductile–to–Brittle Transition hydrogen Concentration). In order to prevent a brittle fracture of the membrane with group 5 metals such as Nb and V, the hydrogen concentration in the membrane must be controlled and kept below 0.2 (H/M) during the operation of hydrogen permeation.
On the other hand, the hydrogen permeation coefficient,
Φ = D × K, is widely used as a measure indicating the hydro-gen permeation ability of metals and alloys, where D is the Fick s diffusion coefficient and K is the Sieverts solubility constant. However, the hydrogen flux through metal mem-brane cannot be explained consistently with Φ15,16). Recently, we have proposed the following new description of hydrogen permeation based on hydrogen chemical potential16).
J=RT B
2L
c1
c2
cdln(P/P0) dc dc=
RT B
2L fPCT, (1)
where J is the hydrogen flux, R is the gas constant, T is abso-lute temperature, B is the mobility of hydrogen atom, L is the membrane thickness, c1 and c2 are the hydrogen concentra-tions at the feed and permeation sides of the membrane, re-spectively. P is applied hydrogen pressure and P 0 is the stan-dard hydrogen pressure (i.e., 101325 Pa). The mobility, B, corresponds to the inverse of friction coefficient to atomic migration, and is related to the diffusion coefficient, D =
RTBftherm, where ftherm is the thermodynamic factor. Here, it is important to note that the term d ln(P/P 0)/dc in eq. (1) re-flects the gradient of the pressure-composition-isotherm (PCT curve), meaning that the hydrogen flux, J, is directly linked with the shape of the PCT curve of the material. The integral term in eq. (1) is redefined as the PCT factor, fPCT, because it can be determined by analyzing the PCT curve of the alloy under given pressure condition. The validity of eq. (1) has been confirmed by various hydrogen permeation tests with pure niobium, Nb–based and Pd–based alloy mem-branes16–18). Thus, the hydrogen flux through metal mem-brane can be explained consistently with eq. (1). From these two points of the fPCT and the DBTC, we have recently pro-posed the most practical way to design non Pd–based alloy *1
Graduate Student, Nagoya University *2
composition with high hydrogen flux while preventing brittle fracture during the operation16,18,19). Following the concept, designed alloy possesses high hydrogen permeability without brittle failure due to hydrogen embrittlement.
For such non Pd–based alloy membranes, the catalytic overlayers on the surface with Pd or Pd-based alloy are con-sidered to be essential to obtain practical hydrogen flux through them20). However, another problem arises when such Pd-coated composite membranes are used at high tempera-ture, i.e., a significant degradation of hydrogen permeability occurs within a short time due to the interdiffusion of base metal and palladium to form intermetallic compounds such as Pd3Nb21).
Recently, Nakamura et al. have reported a novel phenome-non that the surface–oxidized pure V and V–based alloy membranes without Pd overlayer exhibits excellent hydrogen permeability and durability at high temperature as high as 823 K22). However, there are still many unknown factors for this phenomenon and further investigation is needed. There-fore, another way is desired to obtain good durability of the Pd-coated composite membranes.
One of the simplest ways to improve the durability of the membrane is lowering the operating temperature because the rate of the interdiffusion is expected to be reduced significant-ly at low temperature. In addition, the thermal efficiency of the production of high purity hydrogen will be improved by operating the membrane at low temperature. It is also possi-ble to reduce greatly the demand for heat resistance of the materials of the surrounding components. Thus, lowering the operating temperature has many merits for the production of high purity hydrogen using hydrogen permeable metal mem-branes.
In this study, V-based hydrogen permeable alloy membrane suitable for low operating temperature has been designed fol-lowing the concept for alloy design. In addition, the alloying effects of iron on the hydriding property and hydrogen diffu-sivity of V–Fe alloy membrane are investigated quantitatively in order to establish a way to design optimal composition un-der any tempearture and pressure given conditions.
2. Concept for Alloy Design to Obtain High Hydrogen Permeability with Long Time Durability at Low Tem-perature
As mentioned above, one of the most realistic ways to keep the hydrogen permeability for long period is to decrease the operating tempearture of the membrane. However, decreasing the operationg temperature causes the following two prob-lems.
First problem is decreasing the hydrogen permeability. The hydrogen diffusion in metal membranes is generally the rate– limiting process of the total reaction of hydrogen permeation through them. It is thought that reduce in the diffusion rate by lowering the operating temperature results in the low hydro-gen permeability. Among group 5 metals, vanadium has the largest hydrogen diffusion coefficient and the smallest activa-tion energy for hydrogen diffusion23). Therefore, in this study, vanadium is chosen for the base metal in order to obtain high hydrogen diffusivity even at low temperature.
Second problem is the hydrogen embrittlement. As
men-tioned before, a ductile–to–brittle transition occurs drastical-ly at the hydrogen concentration around 0.2 0.25 (H/M) for both Nb and V membranes13,14). However, for group 5 metals, the hydrogen concentration increases significantly with de-creasing temperature under the constant hydrogen pressure. Therefore, the hydrogen solubility needs to be suppressed largely in some way, for example by alloying. Recently, we have investigated the alloying effects on the hydring property of vanadium systematically19). It is found that iron and cobalt are the effective alloying elements to improve the resistance to hydrogen embrittlement by lowering hydrogen concentra-tion. In this study, iron is chosen as an alloying element.
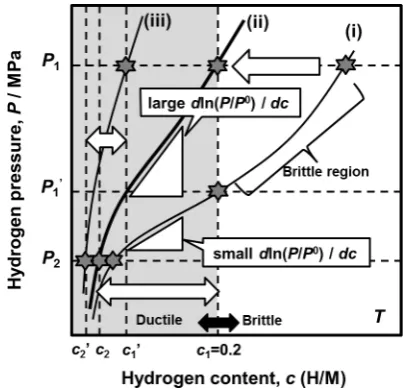
Figure 1 is a schematic illustration of the PCT curves showing the concept for alloy design16,18,19). According to the concept, high hydrogen flux through metal membrane will be obtained at a given temperature and pressure condition by controlling the corresponding PCT curve, i.e., by shifting largely the PCT curve upper and left region. This is because the gradient of the PCT curve dln(P/P 0)/dc in eq. (1) come steeper while keeping the hydrogen concentration be-low 0.2 (H/M). On the other hand, when the PCT curve is shifted excessively, the integral interval (c2 c1) and the hy-drogen concentration, c, in eq. (1) become small. Therefore, the alloy composition must be designed to control the hydrid-ing properties in an appropriate manner under given pressure and temperature conditions such as the PCT curve (ii) shown in Fig. 1.
3. Experimental Procedure
3.1 Sample preparation
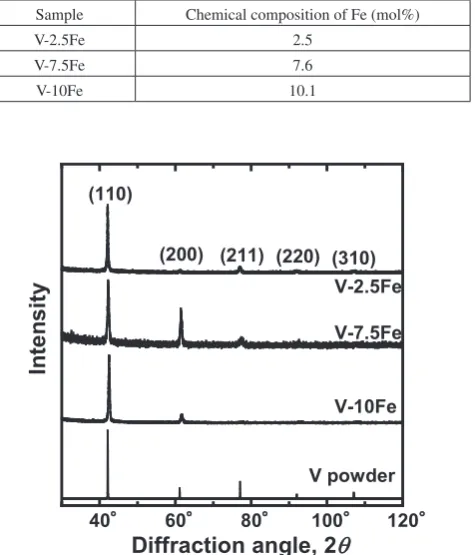
V–2.5mol%Fe, V–7.5mol%Fe and V–10mol%Fe alloys are melted by using a tri–arc furnace in a purified argon gas atmosphere. Each alloy is defined as V-2.5Fe, V-7.5Fe and V-10Fe, respectively. The raw materials used in this study are 99.9 mass% for vanadium (Taiyo Koko, Co., Ltd.) and 99.99 mass% for iron (Kojundo Chemical Laboratory, Co., Ltd.). The chemical composition of each sample investigated in this study is listed in Table 1. According to the V–Fe equi-Fig. 1 Schematic illustration of the PCT curves showing the concept for
[image:2.595.324.526.69.264.2]librium binary phase diagram24), all these alloys are com-posed of a single solid solution phase with simple bcc crystal structure. In addition, XRD measurements are performed us-ing Cu Kα radiation operatus-ing at 40 kV and 40 mA. Figure 2 shows the XRD profile of each sample prepared from the as-cast ingot. For comparison, the calculated powder diffraction pattern for pure V is also presented in the figure. It is con-firmed that all the samples are composed of a single bcc phase, although the ratios of the peak intensities are different from that of powder diffraction due to large grain size of the as-cast ingot.
3.2 Pressure–composition–isotherm measurements The pressure–composition–isotherms (PCT curves) are measured for V–2.5Fe, V–7.5Fe and V–10Fe alloys by using a Sieverts–type apparatus in order to investigate the hydrogen solubility. A small piece of each sample is set into a cell and activated several times prior to the measurements. The PCT curves are measured at 473 K–773 K up to about 2.5 MPa.
3.3 Hydrogen permeation tests
For hydrogen permeation test, disk samples of V–7.5Fe and V–10Fe alloys are prepared from the as–cast ingots. Also, a disk of pure vanadium is prepared from a pure vanadium ingot from Taiyo Koko Co., Ltd with the purity of 99.9 mass%. They are cut into disks with about ϕ12 mm in diameter and 0.65 mm in thickness by using a wire–cut electrical discharge machine. All the disk samples are annealed in vacuum at 1273 K for 24 hours. After the heat treatment, both sides of the disk samples are mechanically polished by alumina abra-sive papers followed by the final polishing with 9 μm and
1 μm diamond slurry. The final thickness, L, of each sample is 0.542 mm for pure V, 0.508 mm for V–7.5Fe alloy and 0.437 mm for V-10Fe alloy, respectively.
Subsequently, Pd-27mol%Ag alloy of about 200 nm in thickness is deposited at 573 K on both sides of the sample surfaces by using an RF magnetron sputtering apparatus. This palladium overlayer acts as catalyst for hydrogen dissocia-tion, dissolution and recombination reactions on the surfaces. It is noted here that Pd–27mol%Ag alloy is selected as cata-lytic overlayer in purpose. According to the Pd-H binary phase diagram, the α–α phase transition occurs at low tem-Table 1 Chemical composition of each alloy investigated in this study.
Sample Chemical composition of Fe (mol%)
V-2.5Fe 2.5
V-7.5Fe 7.6
[image:3.595.55.293.85.363.2]V-10Fe 10.1
Table 2 Temperature and pressure conditions of hydrogen permeation tests, and the mobility for hydrogen diffusion for pure V, V–7.5Fe and V–10Fe.
Sample Temperature, T/K
Hydrogen Pressure, P/MPa Mobility, B/m2 s−1 mol J−1 Feed Permeation
pure V
573 0.015 0.005 3.91 × 10⁻¹³
0.020
623
0.020
0.010 6.64 × 10⁻¹³ 0.030
0.044
673
0.020
0.010 1.12 × 10⁻¹² 0.030
0.044
V-7.5Fe 573
0.050
0.010 6.09 × 10⁻¹³ 0.060
0.070
623
0.070
0.010 9.40 × 10⁻¹³ 0.100
0.130 0.150 0.180
673
0.050
0.010 1.21 × 10⁻¹² 0.100
0.150 0.180 0.200 0.250 0.300 0.350 0.400
V-10Fe
573
0.100
0.010 7.03 × 10⁻¹³ 0.130
0.150 0.200
623
0.100
0.010 9.57 × 10⁻¹³ 0.200
0.300 0.350 0.400
673
0.100
0.010 1.22 × 10⁻¹² 0.200
0.300 0.400 0.500 0.600 Fig. 2 XRD profiles for V–2.5Fe, V–7.5Fe, and V–10Fe alloys. For
[image:3.595.305.550.96.628.2]perature below 566 K25), i.e., α phase with high hydrogen concentration forms in the α matrix. The crystal lattice of Pd expanses drastically and the coating layer is likely to be de-tached. It is well known that the addtion of silver into palladi-um suppresses the α-α phase trainsition by lowering critical temperature. For (Pd–27mol%Ag)-H pseudobinary system, the critical temperature of α–α phase trainsition is about 244 K26). Thus, the overlayer of Pd–27mol%Ag alloy is con-sidered to be more suitable than that of pure Pd at low opera-tive temperature.
The hydrogen permeation tests are performed at 573 K, 623 K and 673 K by the conventional gas permeation meth-od. The testing conditions of the temperature as well as the feed and permeation hydrogen pressures applied in this study are listed in Table 2. The hydrogen flux, J, which permeate through the disk sample is evaluated from monitoring the pressure change of a reserve tank with known volume. A de-tailed explanation of the hydrogen permeation test is given elsewhere8).
The steady–state hydrogen flux, J, is divided by the inverse of the membrane thickness, 1/L, in order to estimate the nor-malized hydrogen flux, J・L. It is noted here that the atomic hydrogen flux, mol H m−1 s−1, is evaluated in this study, which is twice as large as the gaseous hydrogen flux, mol H2 m−1 s−1.
4. Results and Discussion
4.1 Design of hydrogen permeable alloy membrane with long term durability
As an example of alloy design for low operative tempera-ture, the temperature condition of hydrogen permeation test is set to be at 573 K and the hydrogen pressures at feed and permeation sides are fixed to be 0.200 MPa and 0.010 MPa, respectively. Figure 3 shows the PCT curves for pure V27), V–2.5Fe, V–7.5Fe and V–10Fe alloys at 573 K. As shown in this figure, the PCT curves are shifted largely to upper and left region by the addition of iron into vanadium. The equilib-rium hydrogen pressure at a constant hydrogen concentration 0.2 (H/M) for each metal or alloy is 0.005 MPa, 0.010 MPa,
0.070 MPa and 0.230 MPa, respectively. Thus, the hydrogen concentration in V–10Fe alloy can be kept below the DBTC (i.e., 0.2 (H/M)) even applying 0.200 MPa of hydrogen pres-sure at 573 K. Thus, V–10Fe has the appropriate hydriding property and is optimal composition among the V–Fe binary alloys tested in this study under the given temperature and pressure condition.
Figure 4 shows the time dependence of the normalized hy-drogen flux, J・L, for V–10Fe alloy membrane under the giv-en condition mgiv-entioned above. For comparison, the value of the normalized hydrogen flux for Pd–23mol%Ag alloy mem-brane at the same condition is estimated from the previous study26) and drawn in the figure by a broken line. As shown in Fig. 4, the normalized hydrogen flux, J・L, for V–10Fe alloy membrane is about 5 times higher than that for Pd–23mol%Ag alloy membrane. The value of J・L for V–10Fe alloy mem-brane is about 55 × 10−6 mol H m−1 s−1. For example, when the membrane thickeness is 50 μm, hydrogen flux, J, is esti-mated to be about 75 mL cm−2 min−1. Thus, the hydrogen flux through V–10Fe alloy membrane is sufficiently large even at 573 K. In addtion, it is surprising that the hydrogen flux is very stable and nearly constant at least 1000 hours. According to Nakamura et al., the Pd–coated V membrane degrades drastically within a short time at 823 K, e.g., the hydrogen flux becomes almost zero during the first 30 min-utes22). Thus, an excellent durability of the membrane can be achieved by lowering the opertating tempertature down to 573 K.
After the hydrogen permeation test, the system is evacuat-ed. Then the gas leak test is performed using helium in order to check the existence of any cracks on the disk sample. In addition, the disk sample is observed carefully. There is no evidence of cracking on the sample due to hydrogen embrit-tlement. Thus, the designed V–10Fe alloy membrane pos-sesses excellent hydrogen permeability together with good durability without any brittle cracks due to hydrogen embrit-tlement.
4.1.1 Alloying effects on hydriding property
As explained above, it is demonstrated that our concept is
Fig. 3 PCT curves for V–Fe alloys measured at 573 K. The PCT curve for pure V is also shown27).
[image:4.595.325.525.562.752.2] [image:4.595.69.268.572.761.2]useful for designing the alloys with high hydrogen permeabil-ity at low temperature. On the other hand, in order to design alloy composition under any given condition based on the concept, the alloying effects on the hydriding property must be understood. Therefore, in this study, the alloying effects of iron into vanadium on the hydriding property are evaluated quantitatively.
Figure 5 shows the PCT curves for V–2.5Fe, V–7.5Fe and V–10Fe alloys. In view of the concept for the alloy design, the equilibrium hydrogen pressure at 0.2 (H/M) is one of the
[image:5.595.63.276.67.622.2]important parameter. Therefore, the equilibrium hydrogen pressure at 0.2 (H/M) for each alloy at each temperature is estimated by analyzing the PCT curves for V–Fe system shown in Fig. 5 and for pure V reported in the literature27).
Figure 6 shows the correlation between the equilibrium hy-drogen pressure at 0.2 (H/M) and the inverse of temperature. As shown in Fig. 6, there is a linear correlation for each sys-tem. This relationship is expressed in the following van t Hoff equation.
ln P
P0 =
2∆H¯ RT −
2∆¯S
R , (2)
where ∆H¯ and ∆¯S are the partial molar enthalpy change and entropy change of hydrogen for hydrogen dissolution into metal or alloy, respectively. The linear correlations shown in Fig. 6 mean that ∆H¯ and ∆¯S are almost independent of tem-perature at 0.2 (H/M). Therefore, the partial molar enthalpy change and entropy change of hydrogen for hydrogen disso-lution into metal or alloy at 0.2 (H/M), ∆H¯0.2 and ∆¯S0.2 are estimated from the slope and the intercept of the line shown in Fig. 6.
Fig. 5 PCT curves for (a) V–2.5Fe, (b) V–7.5Fe, and (c) V–10Fe alloys.
Fig. 6 Correlation between the hydrogen pressure, P, at 0.2(H/M) and the inverse of temperature, T −1, for pure V and V–Fe alloys.
[image:5.595.323.523.73.259.2] [image:5.595.325.525.308.473.2]Figure 7 shows ∆H¯0.2 and ∆¯S0.2 as a function of the mole fraction, x, of iron. ∆H¯0.2 reflects the affinity of hydrogen for metal or alloy, and increases almost linearly by the addition of iron (i.e., endothermic element). On the other hand, ∆¯S0.2 is almost constant and independent of x. The majority of ∆¯S0.2 is the loss of the entropy of gaseous hydrogen due to hydrogen dissolution into metal. The partial molar entropy of hydrogen in metal or alloy also contributes to ∆¯S0.2 . It is thought that the contribution of the configuration entropy is the largest among the partial molar entropy of hydrogen in metal. Therefore, the constant ∆¯S0.2 shown in Fig. 7 means that the effects of iron atom on the interstitial site of hydrogen in vanadium is small. Thus, for V-Fe alloy, ∆H¯0.2 and ∆¯S0.2 are expressed by the following equations.
∆H¯0V.−2xmol%Fe = ∆H¯0V.2+hV0.−2Fex, (3)
∆¯SV0.−2xmol%Fe ≈∆¯SV0.2=const.for x, (4)
where ∆H¯i
0.2 and ∆¯S0i.2 are the partial molar enthalpy change and entropy change of hydrogen for hydrogen dissolution into metal or alloy i at 0.2 (H/M). hV−Fe
0.2 is the regression coefficient which corresponds to the alloying effects of iron on the hydriding property of vanadium. The value of hV−Fe
0.2 in this study is estimated to be about 0.92 kJ mol−1. It is import-ant to noted that applying eqs. (2) (4), the equilibrium hy-drogen pressure at 0.2 (H/M) can be estimated at any tem-peratures and mole fraction of iron without measuring PCT curve experimentally.
4.1.2 Alloying effects on the hydrogen diffusivity According to eq. (1), not only the PCT factor, fPCT, but also the mobility for hydrogen diffusion, B, is important to esti-mate the hydrogen flux through metal membrane. Therefore, the alloying effects of iron on the mobility for hydrogen dif-fusion are evaluated quantitatively.
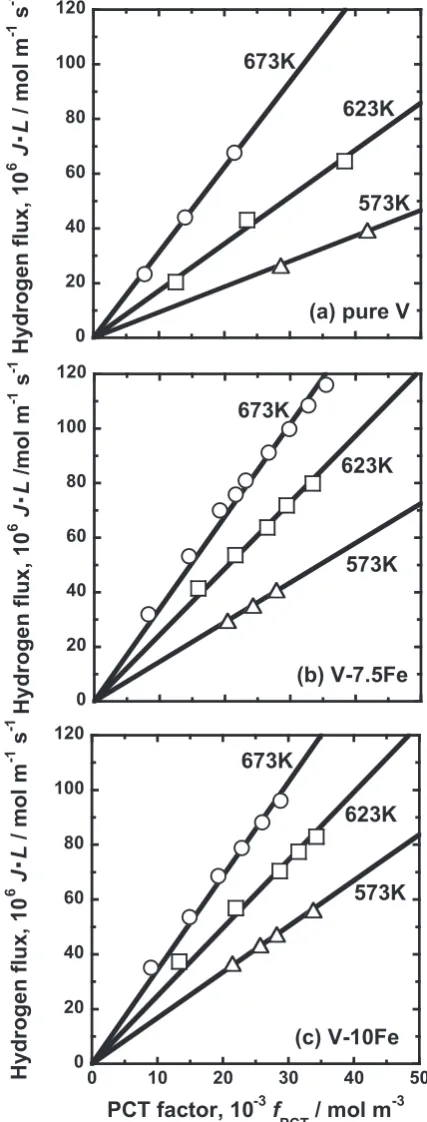
Figure 8 shows the correlation between the normalized hy-drogen flux, J・L and the PCT factor, fPCT, for (a) pure V, (b) V–7.5Fe and (c) V–10Fe alloys, respectively. The value of PCT factor, fPCT, for each condition listed in Table 2 is esti-mated by analyzing the corresponding PCT curve shown in Fig. 5. There is a linear relationship between the normalized hydrogen flux, J・L, and the PCT factor, fPCT, for each sys-tem and each sys-temperature. All the lines shown in Fig. 8 cross at the origin, indicating that the hydrogen permeation reac-tion takes place following eq. (1). The slope of the line shown in Fig. 8 corresponds to RTB/2, indicating that the mobility,
B, for hydrogen diffusion is almost constant under the condi-tion tested in this study and independent of hydrogen concen-tration. Thus, the new description of hydrogen permeability expressed by eq. (1) is applicable to not only Nb–based16,17) and Pd–based18,26) alloy membrane, but also V–based alloy membrane.
The mobility for hydrogen diffusion during hydrogen per-meation can be evaluated from the slope of the line shown in Fig. 8. The estimated value of the mobility is summarized in Table 2. Figure 9 shows the Arrhenius plot of the mobility for hydrogen diffusion during hydrogen permeation for pure V, V–7.5Fe and V–10Fe alloys. As shown in Fig. 9, there is a linear relationship for each system. Thus, the mobility, B, for hydrogen diffusion can be expressed in the following Arrhe-nius equation.
ln B=ln B0−RTE , (5)
where E is the activation energy and B0 is the pre–exponential factor. The activation energy, E, and the pre–exponential fac-tor, B0, of the mobility for hydrogen diffusion are estimated from the straight line for each system shown in Fig. 9, and they are summarized in Table 3.
Figure 10 shows the activation energy, E, and the pre–ex-ponential factor, B0, as a function of the mole fraction, x, of iron. As shown in Fig. 10, E and B0 are expressed by the fol-lowing equation.
EV−xmol%Fe=EV−eV−Fex, (6)
ln BV−xmol%Fe
0 =ln BV0 −bV−Fex, (7) where E i and Bi
0 are the activation energy, E, and the pre–ex-ponential factor, B0 for hydrogen diffusion in metal or alloy
i. eV−Fe and bV−Fe correspond to the slope of the lines for E
and B0 shown in Fig. 10, which represent the alloying effects of iron on the hydrogen diffusivity in vanadium. The values of eV−Fe and bV−Fe in this study are estimated to be about 1.54 kJ mol−1 and 0.26, respectively. From eqs. (1)–(7) and also from the results of Fig. 5, the hydrogen flux can be esti-mated at any temperature, pressure conditions and mole frac-tion of iron.
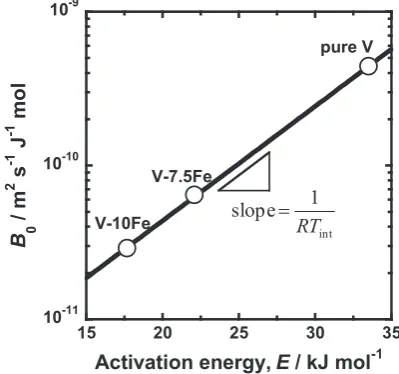
Figure 11 shows the correlation between the activation en-ergy, E, and the pre–exponential factor, B0. As shown in this figure, there is a linear relationship. Thus, when the value of one factor decreases by alloying, the other factor also de-creases linearly. Similar correlation has also been observed for Nb–based alloys17). The linear correlation between the activation energy and the pre-exponential factor in the Arrhe-nius equation is known as the Meyer–Neldel rule28). In this case, as shown in Fig. 9, a line for a certain alloy (e.g., V–10Fe) intersects with the line for the base metal (i.e., pure vanadium) at a certain temperature, which is defined as the intersection temperature, Tint17). Here, Tint is determined by the balance of the alloying effects on the activation energy and the pre–exponential factor, and the slope of the line shown in Fig. 11 corresponds to 1/RTint. Then, the value of
Tint for the system studied in this paper is estimated to be about 700 K. At lower temperature below Tint, the hydrogen mobility is larger for V–Fe alloys than pure vanadium be-cause the activation energy for hydrogen diffusion is smaller for V–Fe alloys than pure vanadium. Thus, the addition of iron into vanadium enhances the hydrogen diffusivity at low temperature below 700 K, which has positive effects on hy-drogen permeable alloy membrane for low operative tem-perature. It is noted here that Tint for V-based alloy membrane is little different from that for Nb-based alloy membrane, i.e., about 780 K17)
4.2 Alloy design under given condition in view of the four parameters, ∆¯H0.2 , ∆¯S0.2 , E and B0
In this study, the alloying effects on the hydriding property and the hydrogen diffusivity are evaluated separately by the partial molar enthalpy and entropy of hydrogen for hydrogen dissolution at 0.2 (H/M), ∆H¯0.2 and ∆¯S0.2 , and the activation
[image:7.595.71.268.71.255.2]Fig. 9 Arrhenius plots of the mobility for hydrogen diffusion during hydro-gen permeation for pure V and V–Fe alloys.
Table 3 Activation energy and pre-exponential factor of the mobility for hydrogen diffusion in pure vanadium and V–Fe alloys.
Sample Temperature,T/K Activation energy,E/kJ mol−1 Pre-exponential factor,B 0/m2 s−1 J−1 mol pure V
573 673
33.5 4.40 × 10⁻¹⁰
V-7.5Fe 22.1 6.43 × 10⁻¹¹
V-10Fe 17.7 2.89 × 10⁻¹¹
Fig. 10 Correlation between the activation energy for hydrogen diffusion, E, and the pre-exponential factor, B0, and the mole fraction, x, of iron V-Fe alloy.
[image:7.595.325.525.72.259.2] [image:7.595.61.274.332.588.2]energy, E, for hydrogen diffusion and the pre-exponential fac-tor, B0. On the other hand, as mentioned before, the hydrogen permeation coefficient, Φ, is widely used as a measure indi-cating the hydrogen permeation ability. Φ consists of the hy-drogen diffusivity, D, and the hyhy-drogen solubility, K, and these two properties have been evaluated individually in the previous study10). However, the hydrogen permeability can-not be explained consistently with Φ. For example, the hy-driding property of the metal or alloy is not always expressed in a format of the Sieverts law.
On the other hand, the four parameters, ∆H¯0.2 , ∆¯S0.2 , E and
B0, are useful for the deep understanding of the property of hydrogen permeable alloy membrane. Also, these four pa-rameters are essential for the alloy design.
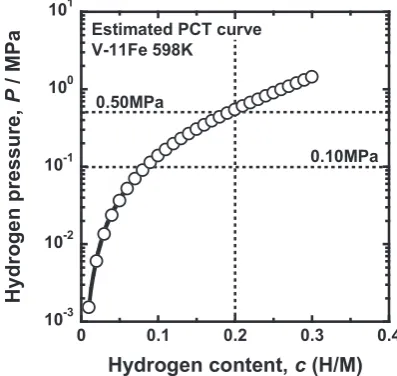
Figure 12 shows the flow chart for the design of alloy com-position, and the estimation of hydrogen flux through the de-signed alloy in view of the four parameters, ∆H¯0.2 , ∆¯S0.2 , E and B0. As an example, the temperature condition, T, is set to be 598 K. The pressure conditions at feed and permeation sides, P1 and P2, are set to be 0.50 MPa and 0.10 MPa, re-spectively. As shown in Fig. 7, the value of ∆¯S0.2 is almost constant to be about −47 J mol−1 K−1. Applying 0.50 MPa for
P1, 598 K for T and −47 J mol−1 K−1 for ∆¯S0.2 in eq. (2), the value of ∆H¯0.2 is estimated to be about −24 kJ mol−1. Substi-tuting this value into ∆H¯V−xmol%Fe
0.2 in eq. (3), the iron concen-tration is estimated to be about 11 mol% to control the hydro-gen concentration below 0.2 (H/M) under this condition. Thus, the appropriate iron concentration can be determined. From eqs. (6) and (7), the values of E V−11mol%Fe and
BV−11mol%Fe
0 are estimated to be about 16 kJ mol−1 and 2.3 × 10⁻¹¹ m2 s−1 mol J−1, respectively. Substituting these values into eq. (5), the mobility for hydrogen diffusion in V-11mol%Fe alloy, B V−11mol%Fe, at 598 K is estimated to be about 8.7 × 10⁻¹³ m2 s−1 mol J−1. On the other hand, from eqs. (2)–(4), and also from Fig. 5, the PCT curve for V-Fe alloy with any composition of iron at any temperature can be estimated. Figure 13 shows the estimated PCT curve for V-11mol%Fe alloy at 598 K. From eq. (1) and Fig. 13, the PCT factor, fPCT, under the condition applied is estimated to be about 24 × 103 mol m−3. Substituting the values of B and
fPCT into eq. (1), the normalized hydrogen flux, J・L, is esti-mated to be about 50 × 10−6 mol H m−1 s−1. For example,
when the thickness of the membrane, L, is 50 μm, the hydro-gen flux, J, is estimated to be about 70 mL cm−2 min−1. Thus, applying ΔH¯0.2 , ∆¯S0.2 , E and B0 to alloy design, the appropri-ate alloy composition and the hydrogen permeability for the designed alloy can be estimated.
In this study, the alloying effects of iron into vanadium have been evaluated. However, the alloying effects of other elements need to be evaluated based on the four parameters, ∆H¯0.2 , ∆¯S0.2 , E and B0. It is also necessary to investigate not only V–based alloys, but also Nb–based and Ta–based alloys. Further investigation enables the design of optimal alloy composition under any temperature and pressure condition.
5. Summary
A concept for alloy design of hydrogen permeable mem-brane has been explained in view of the PCT factor, fPCT, and the ductile–to–brittle transition hydrogen concentration, DBTC. Following the concept, V–10Fe alloy for low opera-tive temperature has been designed. It is demonstrated that the hydrogen flux through V–10Fe alloy membrane is excel-lent and very stable for at least 1000 hours without brittle fracture.
The alloying effects of iron on the hydriding property and the hydrogen diffusivity of vanadium have been investigated quantitatively in order to establish a way to design optimal composition under any given conditions. The addition of iron into vanadium increases monotonically the partial molar en-thalpy change of hydrogen for hydrogen dissolution at 0.2 (H/M), ∆H¯0.2 , but have little effects on the partial molar en-tropy change, ∆¯S0.2 . In addition, both the activation energy, E, and the pre-exponential factor, B0, of the mobility for hydro-gen diffusion decreases linearly with increasing the mole fraction of iron. As a result, the addition of iron into vanadi-um enhances the hydrogen diffusivity at low temperature be-low about 700 K.
Evaluation with the four parameters, ∆H¯0.2 , ∆¯S0.2 , E and
[image:8.595.55.284.67.233.2]B0, instead of D and K, or Φ, is useful for the deep under-standing of the property of hydrogen permeable alloy mem-brane. Also, in view of these parameters, alloy composition Fig. 12 Flow chart for design of alloy composition and estimation of
[image:8.595.325.524.72.260.2]hy-drogen flux through the designed alloy.
can be designed and the hydrogen permeability of the de-signed alloy can be estimated quantitatively.
Acknowledgement
We appreciate Dr. Hideo Yoshinaga of Taiyo Koko Co., Ltd. for supporting and preparation of the samples in this study. This research was supported in part by CREST project from Japan Science and Technology Agency (JST) and Grant–in–Aid for Scientific Research from Japan Society for the Promotion of Science (JSPS).
REFERENCE
1) E. Kikuchi: Catal. Today 56 (2000) 97–101.
2) G. Meunier and J.P. Manaud: Int. J. Hydrogen Energ. 17 (1992) 599– 602.
3) S. Tosti: Int. J. Hydrogen Energ. 28 (2003) 1445–1454.
4) S.C. Chen, C.C.Y. Hung, G.C. Tua and M.H. Rei: Int. J. Hydrogen En-erg. 33 (2008) 1880–1889.
5) S.N. Paglieri and J.D. Way: Sep Purif Rev 31 (2002) 1–169.
6) M.D. Dolan: J. Membr. Sci. 362 (2010) 12–28.
7) R.E. Buxbaum and A.B. Kinney: Ind. Eng. Chem. Res. 35 (1996) 530– 537.
8) T. Nambu, N. Shimizu, H. Ezaki, H. Yukawa and M. Morinaga: J. Japan Inst. Metals 69 (2005) 841–847.
9) K. Hashi, K. Ishikawa, T. Matsuda and K. Aoki: J. Alloy. Compd. 425 (2006) 284–290.
10) C. Nishimura, M. Komaki and M. Amano: Mater. Trans., JIM 32 (1991) 501–507.
11) SA. Steward: Lawrence Livermore National Laboratory report UCRL-53441, 1983.
12) S. Gahr and H.K. Birnbaum: Acta Metall. 26 (1978) 1781–1788.
13) T. Nambu, K. Shimizu, Y. Matsumoto, R. Rong, N. Watanabe, H. Yuka-wa, M. Morinaga and I. Yasuda: J. Alloy. Compd. 446–447 (2007) 588–592.
14) Y. Matsumoto, H. Yukawa and T. Nambu: Metall. J LXIII (2010) 74– 78.
15) B.D. Morreale, M.V. Ciocco, R.M. Enick, B.I. Morsi, B.H. Howard and A.V. Cugini: J. Membr. Sci. 212 (2003) 87–97.
16) A. Suzuki, H. Yukawa, T. Nambu, Y. Matsumoto and Y. Murata: Int. J. Hydrogen Energ. 39 (2014) 7919–7924.
17) A. Suzuki, H. Yukawa, T. Nambu, Y. Matsumoto and Y. Murata: J. Al-loy. Compd. 645 (2015) S107–S111.
18) A. Suzuki, H. Yukawa, T. Nambu, Y. Matsumoto and Y. Murata: J. Membr. Sci. 503 (2016) 110–115.
19) A. Suzuki, H. Yukawa, S. Ijiri, T. Nambu, Y. Matsumoto and Y. Murata:
Mater. Trans. 56 (2015) 1688–1692.
20) R.E. Buxbaum, R. Subramanian, J.H. Park and D.L. Smith: J. Nucl. Mater. 233–237 (1996) 510–512.
21) K. Sasaki, M. Hattori, K. Tsuchimoto, H. Yukawa, S. Arai, T. Tokuna-ga, Y. Murata and T. Yamamoto: J. Alloy. Compd. 573 (2013) 192–197.
22) Y. Nakamura, H. Yukawa, A. Suzuki, T. Nambu, Y. Matsumoto and Y. Murata: J. Alloy. Compd. 645 (2015) S275–S279.
23) Y. Fukai: The Metal-Hydrogen System. Springer, (1993) 229–231. 24) J.F. Smith: Bulletin of Alloy Phase Diagram 5 (1984) 184.
25) F.D. Manchester, A. San-Martin and J.M. Pitre: J. Phase Equilib. 15 (1994) 62–83.
26) A. Suzuki, H. Yukawa, T. Nambu, Y. Matsumoto and Y. Murata: Mater. Trans. 57 (2016) 695–702.
27) E. Veleckis and R.K. Edwards: J. Phys. Chem. 73 (1969) 683–692.