Munich Personal RePEc Archive
Differential market entry determinants
for for-profit and non-profit at-home care
providers in large Japanese cities
Nakazawa, Katsuyoshi
Toyo University
11 May 2016
Online at
https://mpra.ub.uni-muenchen.de/70215/
1
Differential market entry determinants for for-profit and non-profit
at-home care providers in large Japanese cities
∗Katsuyoshi Nakazawa
†Abstract
Japan’s long-term care insurance system requires that for-profit and non-profit at-home care
service providers provide the same services at the same prices. Both types of providers compete
on completely equal terms, though they may have different determinants of entry. This study
considers market entry determinants for both for-profit and non-profit at-home long-term care
providers in large Japanese cities. The estimation results show that potential for-profit entrants
were sensitive to issues of profit, and that potential non-profits enter disadvantaged
municipalities. The net entry rates of both potential entrants have gradually declined. The results
show that both providers’ entries compensate for the gap between at-home long-term care
demand and supply in each religion. Non-profit entrants supplement for-profit entrants because
non-profits enter regions with low profitability. However, the insurance systems will face an
issue due to the increase in premiums and decrease in unit prices, which discourage new entries.
Keywords: Determinants of Entry; Long-term care; For-profit; Non-profit
JEL classification codes: I11, L33, R30
∗ This work was supported by Toyo University under the INOUE ENRYO Memorial
Grant.
† Department of Economics, Toyo University; 5-28-20 Hakusan, Bunkyo-ku, Tokyo
2
1.
Introduction
The Japanese long-term care (LTC) insurance system requires that for-profit and non-profit
at-home care service providers offer the same services at the same unit-prices. Both types of
providers compete on completely equal terms, though they may have different determinants of
entry.
For-profit providers aim to maximize profits, while non-profit providers may have different
goals, such as increasing common welfare (e.g., Anthony and Young, 2003; Hansmann, 1980;
Salamon and Anheier, 1994). Non-profit providers do occasionally have profit-oriented aims,
such as business expansion or borrowing from a bank (e.g., Chang and Tuckman, 1990;
Eldenburg et al., 2011). If both types of providers have the same determinants for entry, then
both will enter only profitable areas.
A potential entrant decides whether to enter based on expected profit and market structure.1
This paper investigates the difference in market entry determinants between for-profit and
non-profit at-home LTC providers in large Japanese cities.
2.
Variables and dataI calculate rate of entry based on the number of providers in each municipality by year. Thus,
I could use the net data of for-profit/non-profit providers.
i t i Total p t i p t i p t i
N
N
N
Ent
, , , , 1 , , , , ,)
(
(1)
1 Geroski and Schwalbach (1991) discuss the relationship between entry and market structure.
Siegfried and Evans (1994) survey the empirical studies on the determinants of entry/exit. Pehrsson
3
Ent is the net entry rate. The right denominator N of expression (1) represents the number
of existing providers. The subscripts i, t, and p represent municipality, year, and provider type
(for-profit/non-profit), respectively.
Potential (for-profit) entrants would prefer profitable municipalities. It is important for
potential entrant to determine how much it will cost to acquire a potential user in the new
municipality because providers must charge the prices established for LTC services under the
LTC insurance scheme. In addition, it is better for the provider if potential clients use the LTC
services often.
Potential user acquisition is a strong incentive for market entry. The first variable is the ratio
of eligible insured individuals to total employees of professional caregivers of at-home LTC
services (EII_care), which indicates the degree of accessibility to potential users2. The second
variable is the at-home LTC benefit per user (benefit), which is the average number of LTC uses
in a municipality. I adopt the current facility care services per elderly resident (faci) because the
amount of facility care services might substitute for at-home care service.
Potential entrants should compete with existing providers on non-price characteristics (e.g.,
service quality). The ratio of full-time caregivers to total employees (r_full) represents the cost
of supply of each municipality. Moreover, the provider also needs to know the cost to employ
caregivers because LTC services have the feature of a labor-intensive business. Providers should
pay a comparatively higher salary to employ full-time caregivers, who are difficult to replace. A
high ratio of full-time caregivers is a cost-pushing factor for potential entrants. However, this
2 When an elderly resident needs long-term care, the municipality’s Certification Committee for
4
indicator is not a barrier to entry for non-profit entrants that intend to invest in the quality.
Potential for-profit entrant should be more sensitive to these variables than potential
non-profit entrants. The empirical analysis is limited to large-scale municipalities with 200,000
or more residents because they have at-home LTC data (e.g., number of employee) publicly
available. Municipal-level benefit data are available from 2003. This study uses unbalanced
panel data for 60 municipalities from 2003 to 2012 (525 observations). However, some
municipalities were amalgamated in this period. To control for the influence of amalgamation, I
adopt a dummy variable for amalgamated municipalities from the year of amalgamation
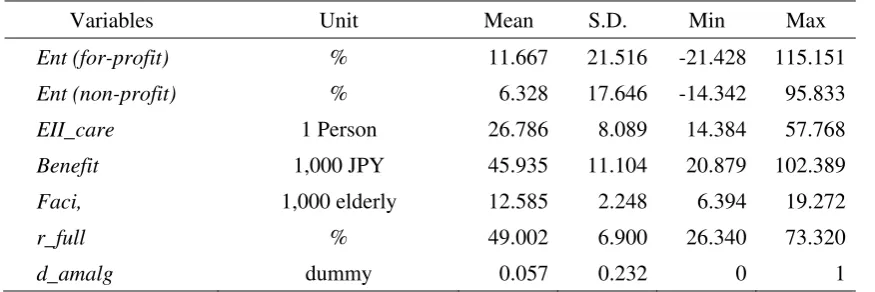
(d_amalg). Table 1 reports the descriptive statistics.
[Table 1 here]
3.
Estimation resultsThis study uses a fixed effect estimation and balanced panel data as a robustness check.
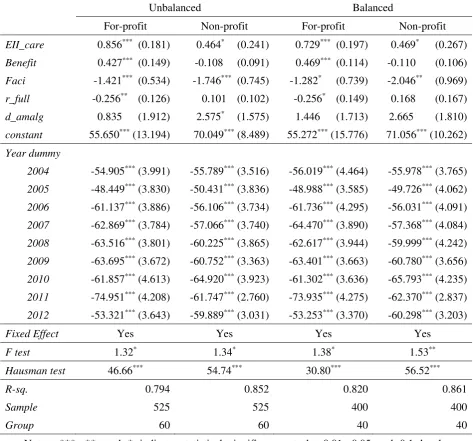
Table 2 presents the estimation results.
[Table 2 here]
The results of the F and Hausman tests indicate the presence of fixed effects. The estimation
results for for-profit entrants seem to support the hypothesis that potential for-profit entrants
strongly consider the (regional) market structure of profitability. On the other hand, potential
non-profit entrants did not react to EII_care, as do the for-profit entrants. Moreover, non-profit
entrants did not react to benefit and Full. The results support the hypothesis that potential
5
The year dummies were strongly negative for all estimation results. The LTC insurance
unit-prices and benefits change every three years, called the program management period. These
were reduced from the 3rd program management period (2006-2008), which led to a fall in new
entries.
The results of the balanced panel data matched those from the unbalanced data. The
estimation results were robust.
Finally, I ran seemingly unrelated regression (SUR) to estimate a system of equations
involving contemporaneous correlations between the errors of different equations for the same
period. After estimating SUR, I checked the hypothesis of independence of both equations using
the Breusch-Pagan (BP) test. The BP test results, of 0.732 and 1.646 for unbalanced and
balanced data, respectively, did not reject the independency of both estimation equations for
all estimation results.
4.
Conclusion
The reform of the Japanese LTC care system in 2000 allowed for-profit providers to offer
LTC services, though must charge the same price for its services as non-profit providers in the
same region. This study examines the differential determinants of entry both for-profit and
non-profit entrants using unbalanced or balanced panel data for large Japanese cities. The results
show that both types of entrants tend to enter regions where there are few professional
caregivers compared to the number of eligible elderly residents who need LTC. In addition,
potential for-profit entrants were more sensitive to profitability factors than non-profit entrants,
who did not avoid entering low profitability regions. Finally, the year dummies were strongly
negative for both for-profit and non-profit entrants.
6
at-home LTC demand and supply in each region. Moreover, non-profit entrants supplement
for-profit entrants because non-profit entrants do enter regions with low profitability. However,
the year dummies indicate that the net entry rate did decline, implying that municipalities should
improve unit-prices to encourage new entrants of both business types. Despite this result, raising
the prices may be untenable for regional LTC insurance systems because the premiums has
increased over the period.
Though the results in this study are robust, it is limited to large cities due to data limitations.
For-profit and non-profit entrants may make different decisions for other types of municipalities,
which will become an issue in the future.
References
Anthony, R. N. and D. W. Young. 2003. Management control in nonprofit organizations, 7th ed.,
New York, McGraw-Hill/Irwin.
Chang, C. F. and H. P. Tuckman. 1990. “Why do nonprofit managers accumulate surpluses, and
how much do they accumulate?”, Nonprofit Management & Leadership, 1(2): 117-135.
Eldenburg, L. G., K. A. Gunny, K. W. Hee, and N. Soderstrom. 2011. Earnings management
using real activities: Evidence from nonprofit hospitals. The Accounting Review, 86(5):
1605-1630.
Geroski, P. A. and J. Schwalbach. (Eds.). 1991. Entry and market contestability. Oxford:
Blackwell.
Hansmann, H. 1980. “The role of nonprofit enterprise”, Yale Law Journal, 89(5): 835-901.
Pehrsson, A. 2009. “Barriers to entry and market strategy: A literature review and a proposed
model”, European Business Review, 21(1): 64-77.
7
Hopkins University.
Siegfried, J. J. and L. B. Evans. 1994. “Empirical studies of entry and exit: A survey of the
8
Table 1. Descriptive statistics and data sources
Variables Unit Mean S.D. Min Max
Ent (for-profit) % 11.667 21.516 -21.428 115.151
Ent (non-profit) % 6.328 17.646 -14.342 95.833
EII_care 1 Person 26.786 8.089 14.384 57.768
Benefit 1,000 JPY 45.935 11.104 20.879 102.389
Faci, 1,000 elderly 12.585 2.248 6.394 19.272
r_full % 49.002 6.900 26.340 73.320
d_amalg dummy 0.057 0.232 0 1
Sources: National survey of long-term care facilities and offices (2002–2012), Ministry of
Health, Labour and Welfare. Annual reports of long-term care insurance (2002–2013), Ministry
9
Table 2. Estimation results
Notes: ***, **, and * indicate statistical significance at the 0.01, 0.05 and 0.1 levels,
respectively. Figures in parentheses are robust standard errors.
Unbalanced Balanced
For-profit Non-profit For-profit Non-profit
EII_care 0.856*** (0.181) 0.464* (0.241) 0.729*** (0.197) 0.469* (0.267)
Benefit 0.427*** (0.149) -0.108 (0.091) 0.469*** (0.114) -0.110 (0.106)
Faci -1.421*** (0.534) -1.746*** (0.745) -1.282* (0.739) -2.046** (0.969)
r_full -0.256** (0.126) 0.101 (0.102) -0.256* (0.149) 0.168 (0.167)
d_amalg 0.835 (1.912) 2.575* (1.575) 1.446 (1.713) 2.665 (1.810)
constant 55.650*** (13.194) 70.049*** (8.489) 55.272*** (15.776) 71.056*** (10.262)
Year dummy
2004 -54.905*** (3.991) -55.789*** (3.516) -56.019*** (4.464) -55.978*** (3.765)
2005 -48.449*** (3.830) -50.431*** (3.836) -48.988*** (3.585) -49.726*** (4.062)
2006 -61.137*** (3.886) -56.106*** (3.734) -61.736*** (4.295) -56.031*** (4.091)
2007 -62.869*** (3.784) -57.066*** (3.740) -64.470*** (3.890) -57.368*** (4.084)
2008 -63.516*** (3.801) -60.225*** (3.865) -62.617*** (3.944) -59.999*** (4.242)
2009 -63.695*** (3.672) -60.752*** (3.363) -63.401*** (3.663) -60.780*** (3.656)
2010 -61.857*** (4.613) -64.920*** (3.923) -61.302*** (3.636) -65.793*** (4.235)
2011 -74.951*** (4.208) -61.747*** (2.760) -73.935*** (4.275) -62.370*** (2.837)
2012 -53.321*** (3.643) -59.889*** (3.031) -53.253*** (3.370) -60.298*** (3.203)
Fixed Effect Yes Yes Yes Yes
F test 1.32* 1.34* 1.38* 1.53**
Hausman test 46.66*** 54.74*** 30.80*** 56.52***
R-sq. 0.794 0.852 0.820 0.861
Sample 525 525 400 400