techniques evaluation and development.
DOGMAN, Aboagela A.
Available from Sheffield Hallam University Research Archive (SHURA) at:
http://shura.shu.ac.uk/19569/
This document is the author deposited version. You are advised to consult the
publisher's version if you wish to cite from it.
Published version
DOGMAN, Aboagela A. (2014). Multimedia computer networks quality of service
techniques evaluation and development. Doctoral, Sheffield Hallam University
(United Kingdom)..
Copyright and re-use policy
See
http://shura.shu.ac.uk/information.html
Sheffield Hallam University Research Archive
S??'/v ti0,|L d^OjUf p u s 6UIUJB9-|
ti«s.:,»,un ojepH Piayjaijg .
All rights reserved
INFORMATION TO ALL USERS
The quality of this reproduction is dependent upon the quality of the copy submitted.
In the unlikely event that the author did not send a com plete manuscript and there are missing pages, these will be noted. Also, if material had to be removed,
a note will indicate the deletion.
uest
ProQuest 10694450
Published by ProQuest LLC(2017). Copyright of the Dissertation is held by the Author.
All rights reserved.
This work is protected against unauthorized copying under Title 17, United States C ode Microform Edition © ProQuest LLC.
ProQuest LLC.
789 East Eisenhower Parkway P.O. Box 1346
Techniques Evaluation and Development
Aboagela A. Abolghasm Dogman
A thesis submitted in partial fulfilment of the requirements of
Sheffield Hallam University
for the degree of
Doctor of Philosophy
Quality of Service Evaluation and Improvement of Multimedia Computer Networks
The growth in the transmission of time-sensitive applications over computer networks means that Quality of Service (QoS) needs to be managed in an efficient manner. Network QoS management in this thesis refers to evaluation and improvement of QoS provided by integrated wired and wireless computer networks. Evaluation of QoS aims to analyse and quantify network performance with respect of meeting multimedia applications' transmission requirements. QoS improvement involves the ability to take actions to change network performance toward improved operation. Therefore, the main aims of this thesis are: (i) to develop techniques for evaluation QoS in multimedia computer networks, (ii) to develop techniques that uses the information from (i) to manage and improve network performance.
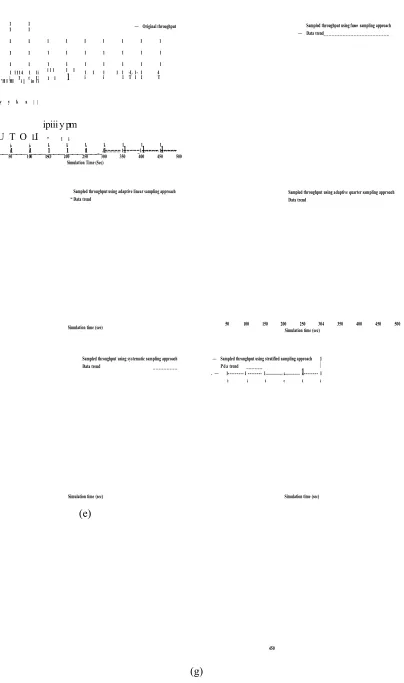
Multimedia traffic generates a large amount of data. Collecting this information poses a challenge as it needs to be sufficiently fast and accurate. A contribution of this thesis is that adaptive statistical sampling techniques to sample multimedia traffic were developed and their effectiveness was evaluated. Three different adjustment mechanisms were incorporated into statistical sampling techniques to adjust the traffic sampling rate: simple linear adjustment, quarter adjustment, and Fuzzy Inference System (FIS). The findings indicated that the developed methods outperformed the conventional non-adaptive sampling methods of systematic, stratified and random.
The data collected included important QoS parameters, i.e. delay, jitter, throughput, and packet loss that indicated network performance in delivering real-time applications. An issue is that QoS needs evaluation in an informative manner. Therefore, the second contribution of this thesis is that statistical and Artificial Intelligent (AI) techniques were developed to evaluate QoS for multimedia applications. The application’s QoS parameters were initially analysed either by Fuzzy C-Means (FCM) clustering algorithm or by Kohonen neural network. The analysed QoS parameters were then used as inputs to a regression model or Multi-Layer Perceptron (MLP) neural network in order to quantify the overall QoS. The proposed QoS evaluation system differentiated the network’s QoS into a number of levels (Poor to Good QoS) and based on this information, the overall network’s QoS was successfully quantified. In order to facilitate QoS assessment, a portable hand-held device for assessing the QoS in multimedia networks was designed, regression model was implemented on the microcontroller board and its performance was successfully demonstrated.
I dedicate this work to:
o To the soul of my mother, I still owe to her. Without her encouragement when she was a live, I could not be able to reach this stage.
o My father, for his invaluable support throughout the years, who devoted his life
to the achievement of this dream,
o My lovely wife whose unconditional love makes everything possible,
o My sons Yousf, Ahmed, and Abdul-Aziz who make every day new and precious.
In the name of Allah, the Most Gracious, the Most Merciful.
All thanks to Almighty ALLAH for giving me the guidance and the strength to achieve my aim of obtaining PhD degree.
First, I would like to express my deep thanks to my director of studies, Dr. Reza Saatchi, for his guidance, support, encouragement, valuable suggestions and comments on various aspects throughout my PhD study. The initial help I have received from Dr. Reza in setting up my research focus and his subsequent professional support throughout my research process were very valuable. I really appreciate your support!
Special thanks to my supervisor, Dr. Samir Al-Khayatt for being very helpful and supportive. His valuable guidance, advice, and expertise throughout my research were really helpful. Dr. Samir Al-Khayatt taught me how a supervisor can be a sincere friend.
I will never forget your help and support!
• Dogman, A., Saatchi, R., and Al-Khayatt, S. (2014), Collaborative Scheme to Improve QoS in WLAN-Wired Networks, The Mediterranean Journal of Computers and Networks, Accepted for publication.
• Dogman, A., and Saatchi, R. (2014), Multimedia Traffic Quality of Service Management Using Statistical and Artificial Intelligence Techniques, Institute of Engineering and Technology Journal of Circuits, Devices, and Systems, Accepted for publication.
• Dogman, A., Saatchi, R., and Al-Khayatt, S. (2013), Network Quality of Service Assessment Implementation Using a Microcontroller Board, Malaysian Journal of Fundamental and Applied Sciences, Vol.9, No.2, pp 57 - 61.
• Dogman, A., Saatchi, R., and Al-Khayatt, S. (2012), Quality of Service Evaluation using a Combination of Fuzzy C-Means and Regression Model, International Journal of Electronics and Electrical Engineering, World Academy of Science Engineering and Technology (WASET12), Vol. 6, pp. 58 - 65.
• Dogman, A., Saatchi, R., and Al-Khayatt, S. (2012), Evaluation of Computer Network Quality of Service Using Neural Networks, In Proceedings of IEEE Symposium on Business, Engineering and Industrial Applications (ISBEIA12), 23rd - 26th September, Bandung, Indonesia, UK, IEEE Xplore, pp. 217 - 222. • Dogman, A., Saatchi, R., and Al-Khayatt, S. (2012), Computer Network Quality of
Service Monitoring Using KEIL ARM Microcontroller, In Proceedings of Regional Annual Fundamental Science Symposium (RAFSS12), 10th - 13th December, Persada Johor International Convention Centre, Johor Bahru, Malaysia.
• Dogman, A., Saatchi, R., and Al-Khayatt, S. (2012), Improving Quality of Service in IEEE 802.1 le Enhanced Distributed Channel Access Protocol, In Proceedings of the 8th IEEE International Symposium on Communication Systems Networks and Digital Signal Processing (CSNDSP12), 18th - 20th July, Poznan University, Poznan, Poland, UK, IEEE Xplore, pp. 1-6.
• Dogman, A., Saatchi, R., Nwaizu, H., and Al-Khayatt, S. (2011), Adaptive Statistical Sampling of VoIP Traffic in WLAN and Wired Networks using Fuzzy Inference System, In Proceedings of the 7th IEEE International Wireless
Bahcesehir University, Istanbul, Turkey, UK, IEEE Xplore, pp. 1731 - 1736.
Dogman, A., Saatchi, R., and Al-Khayatt, S. (2010), An Adaptive Statistical Sampling Technique for Computer Network Traffic, In Proceedings of the 7th IEEE, DET International Symposium on Communication Systems Networks and Digital Signal Processing (CSNDSP10), 21st -23rd July, University of Northumbria, Newcastle, UK, IEEE Xplore, pp. 479 - 483.
Dogman, A., Saatchi, R., and Al-Khayatt, S. (2010), Evaluation of Adaptive Statistical Sampling versus Random Sampling for Video Traffic, In Proceedings of the 11th International Arab Conference on Information Technology (ACIT10),
ABSTRACT... H
DEDICATION...HI
ACKNOWLEDGMENTS... IV
LIST OF PUBLICATIONS...V
TABLE OF CONTENTS...VII
LIST OF FIGURES... XI
LIST OF TABLES... XV
GLOSSARY TERMS...XVII
LIST OF VARIABLES...XX
CHAPTER 1 INTRODUCTION...1
1.1 Research Motivatio ns...1
1.2 Research Aimand Ob jectiv es...4
1.3 Research Co n t r ib u t io n s... 4
1.4 Thesis Organisation... 7
CHAPTER 2 RELEVANT THEORY AND BACKGROUND 2.1 In tr o d u ctio n... 2.2 Qualityo f Service (QoS): Ano v erv iew... 2.2.7 Definition of QoS:... 2.2.2 QoS Parameters... 72
2.2.2.1 Throughput...12
2.2.2.2 Delay ...13
22.23 Jitter...13
2.2.2.4 Packet Loss Ratio...14
2.2.3 QoS Requirements of Multimedia Applications...14
2.2.4 Service Levels of QoS... 75
2.2.5 QoS Components...75
2.3 QoS in Wirelessand Wired Ne tw o r k s...16
2.3.1 QoS in Wireless Networks...16
2.3.1.1 IEEE 802.1 le Standard... 17
2.3.1.1.1 HCF Controlled Channel Access (HCCA)...17
2.3.1.1.2 Enhanced Distributed Channel Access (EDCA)... 19
2.3.2 QoS in Wired Networks...22
2.3.2.1 Packet Scheduling Mechanisms... 23
2.3.2.1.1 First-In, First-Out (FIFO) queuing mechanism... 23
2.3.2.1.2 Priority Queuing Mechanism (PQ)...24
2.3.2.1.4 Weighted Fair Queuing Mechanism (WFQ)...25
2.3.2.1.5 Weighted Round Robin queuing mechanism (WRR)...26
2.4 Statistica land Artific ia l Intelligence Tec h n iq u es... 28
2.4.1 Regression Model...28
2.4.1.1 Multi-Linear Regression Model... 29
2.4.2 Fuzzy logic...30
2.4.2.1 Fuzzy Inference System (FIS)... 30
2.4.2.1.1 Fuzzification... 31
2.4.2.1.2 Rule Base... 31
2.4.2.1.3 Inference Engine...32
2.4.2.1.4 Defuzzification...32
2.4.3 Fuzzy clustering... 34
2.4.3.1 Fuzzy C-Means Clustering (FCM)...34
2.4.4 Artificial Neural Network (ANN)...36
2.4.4.1 Multi-Layer Perceptron (MLP)... 37
2.4.4.2 Kohonen Neural Network... 39
2.5 Su m m a r y...40
CHAPTER 3 LITERATURE REVIEW...41
3.1 In tr o d u ctio n...41
3.2 Sam pling Approachesfor Measuring QoS Para m eters...42
3.2.1 Non-adaptive Sampling Techniques...42
3.2.2 Adaptive Sampling Techniques...43
3.3 Netw ork Qualityo f Service Ev a lu a tio n... 45
3.3.1 Quality of Service Analysis Techniques...46
3.3.2 Quality of Service Measurement Techniques...47
3.4 Im proving Qualityo f Servicein Com puter Ne t w o r k s... 51
3.5 Qualityo f Service Monitoring To o l s...55
3.6 Applicationo f Statistica land Artificial Intelligent Techniquesto Com puter Ne t w o r k... 56
3.7 Su m m a r y... 58
CHAPTER 4 EXPERIMENTAL METHODOLOGY...59
4.1 In tr o d u ctio n...59
4.2 Netw ork Evaluation Appr o a c h es...59
4.2.1 Network Simulation...60
4.2.1.1 An overview of Evalvid Framework... 61
4.2.2 Network Topologies...63
4.2.3 Physical Layer (PHY) Parameters...64
4.2.4 Medium Access Layer (MAC) Parameters...64
4.2.5 Routing Protocols...65
4.2.6 Queuing Mechanisms...66
4.3.1 Transmission Requirements of Applications...68
4.3.2 Calculation of QoS Parameters...69
4.4 Su m m a r y...70
CHAPTER 5 DEVELOPMENT AND EVALUATION OF ADAPTIVE STATISTICAL SAMPLING TECHNIQUES FOR MULTIMEDIA TRAFFIC... 71
5.1 Intro d u ctio n... 71
5.2 Related Wo r k... 72
5.3 Ad aptiv e Statistica l Sam pling Appr o a c h e s...72
5.3.1 Description of Statistical Sampling Algorithm...73
5.3.2 Adjustment of Inter-Sampling Section Interval (ISSI)...75
5.3.2.1 Linear Adjustment Mechanism of ISSI... 76
5.3.2.2 Quarter Adjustment Mechanism of ISSI... 76
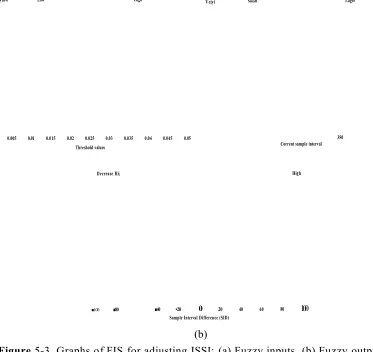
5.3.2.3 ISSI Adjustment using Fuzzy Inference System... 77
5.3.3 Implementations of Conventional Sampling Techniques...80
5.3.4 Calculation of Sampling QoS Parameters and Sampling Analysis...80
5.3.5 Network Topology and Traffic Characteristics...82
5.4 ResultsandDisc u ssio n...83
5.4.1 Throughput...83
5.4.2 Delay...90
5.4.3 Jitter...95
5.4.4 Packet Loss Ratio...100
5.5 Su m m a r y...105
CHAPTER 6 TECHNIQUES TO EVALUATE NETWORK QUALITY OF SERVICE USING STATISTICAL AND ARTIFICIAL INTELLIGENCE...106
6.1 In tr o d u ctio n... 106
6.2 Related Wo r k s...106
6.3 Descriptiono fthe Appr o a c h e s... 107
6.3.1 Analysis of QoS using Fuzzy C-means Clustering Algorithm... 109
6.3.2 Analysis of QoS using Kohonen Neural Network...110
6.3.3 QoS Assessment using Regression Model...112
6.3.4 QoS Assessment using Multi-Layer Perceptron...114
6.3.5 Measuring Predication Accuracy...116
6.3.6 Network Simulation and Traffic Models...117
6.4 Resultsand Disc u ssio n...118
6.4.1 QoS Analysis using FCM Clustering Algorithm...118
6.4.2 QoS Assessment using Regression Model:...123
6.4.3 QoS Analysis using Kohonen Neural Network...127
6.4.4 QoS Assessment using Multi Layer Perceptron...130
7.1 In tr o d u ctio n...136
7.2 Related Wo r k...!...136
7.3 Descriptiono f QoS En ha ncem ent Ap p r o a c h... 138
7.3.1 Adaptive Traffic Allocation Algorithm...138
7.3.1 Integration of Weighted Round Robin Queuing Mechanism...140
7.1 Netw ork Modellingand Sim u la tio n...141
7.2 Resultsand Disc u ssio n...143
7.2.1 Delay... 143
7.2.2 Jitter... 146
7.2.3 Packet loss ratio... 149
7.2.4 Overall QoS...152
7.3 Su m m a r y...156
C H A P T E R 8 M IC R O C O N T R O L L E R B O A R D IM P L E M E N T A T IO N O F Q U A L IT Y O F S E R V IC E A SSESSM EN T S Y S T E M ... 157
8.1 In tr o d u ctio n... 157
8.2 Related Wo r k...158
8.3 KEIL ARM M CB2300 Evaluation Bo a r d... 159
8.3.1 MCB2300 Hardware Components...159
8.3.2 MDK-ARM Microcontroller Development Kit...159
8.4 QoS Assessm ent Im plem entation Using KEIL M CB2300 A R M ... 161
8.4.1 Proposed Regression Model to Assess QoS....162
8.4.2 Implementation of QoS Assessment Technique using KEIL ARM Microcontroller 163 8.5 Experim entalpro ced u re... 165
8.5.1 Modelling and Simulation...165
8.5.2 Hardware and Software Setup....166
8.5.2.1 Hardware Setup...166
8.5.2.2 Software Setup ...168
8.6 Resultsand Disc u ssio n...170
8.6.1 VoIP Traffic...170
8.6.2 Video Traffic...172
8.7 Su m m a r y...174
C H A P T E R 9 C O N C L U SIO N S, AND F U T U R E W O R K ...175
9.1 Co n c l u s io n s...175
9.2 Future Wo r k... 178
Figure 1-1. Th eschem aticoverviewo ftheth esis...10
Figure 2-1. Theconstructiono f IEEE 802.1 1e HCCA... 18
Figure 2-2. Uplinkanddow nlinktransm issionbetw een AP andw irelessstatio n... 18
Figure 2-3. Th e IEEE 802.1 1e EDCA m o d el. ... 19
Figure 2-4. IEEE 802.1 1e ED CA operation...21
Figure 2-5. Theprocesso f FIFO schedulingm echanism...24
Figure 2-6. Priorityqueuingsch edulin gm echanism...24
Figure 2-7. Fairqueuingsch edulin gm echanism...25
Figure 2-8. W FQ usingaw eightedbit-by-bitroundrobinsch eduler...26
Figure 2-9. Theoperationo f W R R ...27
Figure 2-10. Binarylogicversusfuzzylogic... 30
Figure 2-11. Blockdiagramo ffuzzyinferencesystem. ... 30
Figure 2-12. Degreeso fm em bershipinGaussianm em bershipfunction...31
Figure 2-13. Theprocesso ffuzzyinferencesystem... 33
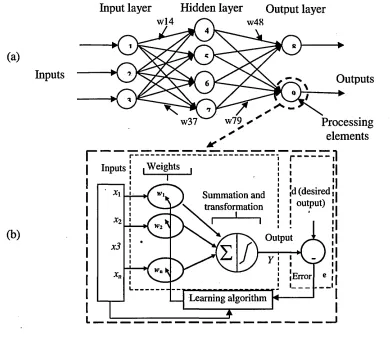
Figure 2-14. Multi-Layer Perceptron: (a) Thearchitecture, (b) M LP o peration... 38
Figure 2-15. Thestructureo fkohonenneuralnetw ork...39
Figure 3-1. Classificationo fsam plingtechniques: (a) Nonadaptivesam pling, (b) Thec oncept OF ADAPTIVE SAMPLING...43
Figure 3-2. Integrated W LAN-w irednetw ork... 51
Figure 4-1. Thesim ulationprocesso f N S-2... 61
Figure 4-2. Th eprocesso ftransm ittingvideousing Evalvidfram ew orkand N S-2...62
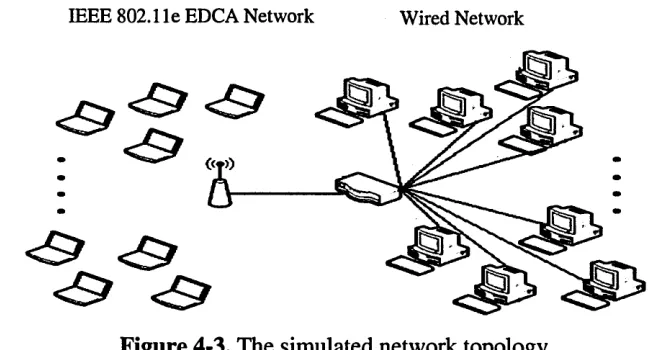
Figure 4-3. Th esim ulatednetw orktopolog y... 63
Figure 4-4. GOP sequencein M P E G -4...67
Figure 5-1. Operatingparam eterso fadaptivestatisticalsam plingalg orithm ... 73
Figure 5-2. Theflowcharto ftheadaptivestatisticalsam plingalg o rith m... 75
Figure 5-3. Blockdiagramo f FIS foradjusting ISSI: (a) Fuzzy in puts, (b) Fuzzyo u t pu t... 78
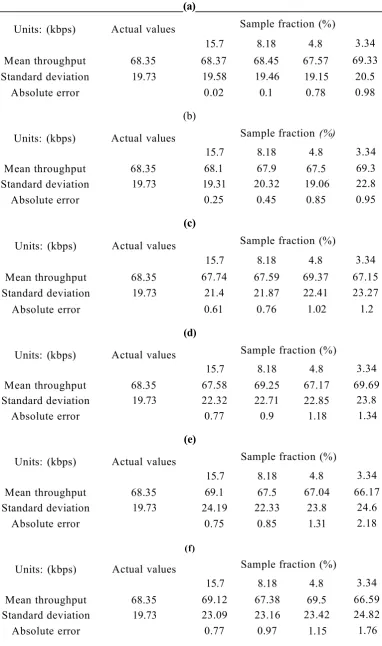
Figure 5-4. Com parisono fthroug hpu tw ithitssam pledversionsu sin g: (a) Ac tu a l, (b) Adaptivesam plingbasedo n FIS, (c) Adaptivesam plinglineara dju stm ent, (d) Adaptive SAMPLING QUARTER ADJUSTMENT, (E) SYSTEMATIC, (F) STRATIFIED, (G) RANDOM SAMPLING...84
WITH BIAS OBTAINED USING: (A) ADAPTIVE SAMPLING BASED ON FIS, (B) ADAPTIVE SAMPLING
BASED ON LINEAR ADJUSTMENT, (C) ADAPTIVE SAMPLING BASED ON QUARTER ADJUSTMENT 88
Figure 5-7. RSE o fsam pledthroug hpu tu singconventionalsam plingv er su s: (a) Adaptiv e
SAMPLING BASED ON FIS, (B) ADAPTIVE SAMPLING BASED ON LINEAR ADJUSTMENT, (C) ADAPTIVE
SAMPLING BASED ON QUARTER ADJUSTMENT... 89
Figure 5-8. Com parisonofdelayw ithitssam pledversionsu sing: (a) Ac tu a l, (b) Adaptive SAMPLING BASED ON FIS, (C) ADAPTIVE SAMPLING LINEAR ADJUSTMENT, (D) ADAPTIVE SAMPLING QUARTER ADJUSTMENT, (E) SYSTEMATIC, (F) STRATIFIED, (G) RANDOM SAMPLING...91
Figure 5-9. Com parisono fbiaso fsam pleddelayobtainedfromn on-adaptivesam plingw ith BIAS OBTAINED USING: (A) ADAPTIVE SAMPLING BASED ON FIS, (B) ADAPTIVE SAMPLING BASED ON LINEAR ADJUSTMENT, (C) ADAPTIVE SAMPLING BASED ON QUARTER ADJUSTMENT...93
Figure 5-10. RSE o fsam pleddelayusingc onven tiona lsam plingv er su s: (a) Adaptiv e SAMPLING BASED ON FIS, (B) ADAPTIVE SAMPLING BASED ON LINEAR ADJUSTMENT, (C) ADAPTIVE SAMPLING BASED ON QUARTER ADJUSTMENT...94
Figure 5-11. Com parisono fjitterw ithitssam pledversionsu sin g: (a) Ac tu a l, (b) Adaptiv e SAMPLING BASED ON FIS, (C) ADAPTIVE SAMPLING LINEAR ADJUSTMENT, (D) ADAPTIVE SAMPLING QUARTER ADJUSTMENT, (E) SYSTEMATIC, (F) STRATIFIED, (G) RANDOM SAMPLING...96
Figure 5-12. Com parisono fbiaso fsam pledjitterobtainedfromn on-adaptivesam plingw ith BIAS OBTAINED USING: (A) ADAPTIVE SAMPLING BASED ON FIS, (B) ADAPTIVE SAMPLING BASED ON LINEAR ADJUSTMENT, (C) ADAPTIVE SAMPLING BASED ON QUARTER ADJUSTMENT...98
Figure 5-13. RSE o fsam pledjitteru singconven tiona lsam plingv er su s: (a) Ad a ptiv esam pling BASED ON FIS, (B) ADAPTIVE SAMPLING BASED ON LINEAR ADJUSTMENT, (C) ADAPTIVE SAMPLING BASED ON QUARTER ADJUSTMENT...99
Figure 5-14. Pa cketlossratiow ithitssam pledversionsu sin g: (a) Actu a l, (b) Adaptiv e SAMPLING BASED ON FIS, (C) ADAPTIVE SAMPLING LINEAR ADJUSTMENT, (D) ADAPTIVE SAMPLING QUARTER ADJUSTMENT, (E) SYSTEMATIC, (F) STRATIFIED, (G) RANDOM SAMPLING... 101
Figure 5-15. Com parisono fbiaso fsam pledpacketlossesobtainedfromn on-ada ptive SAMPLING WITH BIAS OBTAINED FROM ADAPTIVE SAMPLING BASED ON: (A) FIS, (B) LINEAR ADJUSTMENT APPROACH, (C) QUARTER ADJUSTMENT APPROACH... 103
Figure 5-16. RSE ofsam pledpacketlossratiousingconven tiona lsam plingv er su s: (a) Adaptivesam plingbasedo n FIS, (b) Adaptivesam plingbasedonlineara d ju stm en t, (c) Adaptivesam plingbasedo nquarteradju stm ent... 104
Figure 6-1. QoS evaluationsystem...108
Figure 6-2. Kohonenneuralnetw ork...111
Figure6-3. Structureo fanMLP...114
(a) Vo IP , (b) Vid eoa p p l ic a t io n... 120
Fig u r e 6-7. Th epr o g r e sso fo b je c t iv efu n c t io n sd u r in g F C M a n a l y siso f: (a) VoIP, (b) Vid e o APPLICATION...121
Fig u r e 6-8. Cl u s t e r in g QoS pa r a m e t e r so f VoIP ...122
Fig u r e 6-9. Cl u s t e r in g Q oS pa r a m e t e r so fv id e o...123
Fig u r e 6-10. Th e QoS o f VoIP u s in gr e g r e s sio nm o d e l...124
Fig u r e 6-11. Th e QoS o fv id e ou s in gr e g r e s sio nm o d e l... 125
Fig u r e 6-12. Cl a s sif y in g QoS pa r a m e t e r so f VoIP u s in gk o h o n e nn e t w o r k: (a) De l a y, (b) Jit t e r, (c) Pa c k e tlo ssr a t io, (d) QoS pa r a m e t e r sl a b e l s, (e) SO M s a m p l eh it s...128
Fig u r e 6-13. Cl a s sif y in g QoS p a r a m e t e r so fv id e oa p pl ic a t io nu s in gk o h o n e nn e t w o r k: (a) De l a y, (b) Jit t e r, (c) Pa c k e tl o ssr a t io, (d) QoS pa r a m e t e r sl a b e l s, (e) S O M s a m p l eh it s. ... 129
Fig u r e 6-14. Th epr o g r e s so f t r a in in g M L P t oa s s e sst h e QoS f o r: (a) VoIP , (b) Vid e o...130
Fig u r e 6-15. Co m p a r iso nb e t w e e nn o r m a l is e da c t u a l QoS a n dc a l c u l a t e do u t p u t sf r o m M L P inc a s eo f: (a) VoIP QoS a s s e s s m e n t, a n d (b) Vid e o QoS a s s e s s m e n t...131
Fig u r e 6-16. Th e QoS a s s e s s m e n to f: (a) VoIP, a n d (b) Vid e oa p pl ic a t io n u s in g Mu l t i-La y e r Pe r c e p t r o n... 132
Fig u r e 7-1. Ad a p t iv et r a f f ica l l o c a t io na l g o r it h m f l o wc h a r t... 139
Fig u r e 7-2. Ba rc h a r tr e p r e s e n t a t io no fa v e r a g ed e l a yw it h a n dw it h o u t QoS e n h a n c e m e n t sc h e m ef o r: (a) VoIP , (b) Vid e o, (c) Be s te f f o r tt r a f f ic, (d) Ba c k g r o u n dt r a f f ic...145
Fig u r e 7-3. Ba rc h a r tr e pr e s e n t a t io no fa v e r a g ejit t e rw it ha n dw it h o u t QoS e n h a n c e m e n t sc h e m ef o r: (a) VoIP, (b) Vid e o, (c) Be s te f f o r tt r a f f ic, (d) Ba c k g r o u n dt r a f f ic...148
Fig u r e 7-4. Ba rc h a r tr e pr e s e n t a t io no fa v e r a g ep a c k e tlo ssw it ha n dw it h o u t QoS ENHANCEMENT SCHEME FOR: (A) V o IP , (B) VIDEO, (C) BEST EFFORT TRAFFIC, (D) BACKGROUND TRAFFIC... 151
Fig u r e 7-5. Ba rc h a r tr e pr e s e n t a t io n o fo v e r a l la s se ss e d QoS w it h a n dw it h o u t QoS ENHANCEMENT SCHEME FOR: (A) V o IP , (B) VIDEO, (C) BEST EFFORT TRAFFIC, (D) BACKGROUND TRAFFIC... 154
Fig u r e 7-6. Visu a lc o m p a r iso no fr e c o n st r u c t e d Fo r e m a nv id e ou s in g: (a) QoS e n h a n c e m e n t SCHEME, (B) LEGACY NETWORK SCHEME...155
Fig u r e 8-1. K E IL M C B 2300 Ev a l u a t io n Bo a r d... 161
Fig u r e 8-2. MD K -A R M Mic r o c o n t r o l l e r De v e l o p m e n t Kit... 161
Fig u r e 8-3. Q oS m o n it o r in g Sy s t e m... :... 162
Fig u r e 8-4. Q oS Ass e s s m e n t Co d e...164
Fig u r e 8-5. Th e Sim u l a t e d Ne t w o r k...166
Table 2-1. Th esensitivityo fsom ecom m onapplicationstotheir QoS param eters...15
Table 4-1. Sim ulationsettingso f M AC and PHY param etersin IEEE 802.1 1e... 64
Table 4-2. IEEE 802.1 1eaccesscategoriesparam eters...65
Table 4-3. W R R Param eters...66
Table 4-4. Th enum bero fvideofram esandpacketso fthevideostream ingso u r ces... 67
Table4-5. Q oS requirem entsforvoice, vid eo, anddataasreco m m endedb y ITU g r oup (Zh a ie t a l, 2005)...68
Table 5-1. Meanandstandarddeviationo fo verallstatisticin putfuzzym em bership function s...78
Table 5-2. Meanandstandarddeviationo fcu rren tsam pleintervalin putfuzzym em bership function s...78
Table 5-3. Meanandstandarddeviationo fsam pleintervaldifferenceou tpu tfuzzy MEMBERSHIP FUNCTIONS... 78
Table 5-4. Th efuzzyrulesusedby FIS toadju st ISSI... 79
Table 5-5. Operatingparam etersofadaptivestatisticalsam plinga pproa ch es... 85
Table 5-6. Throughputm easurem entresultsusingd ifferentsam plingm eth o d s: (a) Adaptiv e SAMPLING BASED ON FIS, (B) ADAPTIVE SAMPLING BASED ON LINEAR ADJUSTMENT, (C) ADAPTIVE SAMPLING BASED ON QUARTER ADJUSTMENT, (D) SYSTEMATIC, (E) STRATIFIED, (F) RANDOM SAMPLING...87
Table 5-7. Delaym easurem entresultsusingdifferentsam plingm eth o d s: (a) Adaptiv e SAMPLING BASED ON FIS, (B) ADAPTIVE SAMPLING BASED ON LINEAR ADJUSTMENT, (C) ADAPTIVE SAMPLING BASED ON QUARTER ADJUSTMENT, (D) SYSTEMATIC, (E) STRATIFIED, (F) RANDOM SAMPLING... 92
Table 5-8. Jitterm easurem entresultsusingdifferentsam plingm etho ds: (a) Adaptiv e SAMPLING BASED ON FIS, (B) ADAPTIVE SAMPLING BASED ON LINEAR ADJUSTMENT, (C) ADAPTIVE SAMPLING BASED ON QUARTER ADJUSTMENT, (D) SYSTEMATIC, (E) STRATIFIED, (F) RANDOM SAMPLING...97
Table 5-9. Pa cketlossratiom easurem entresultsusingdifferentsam plingm eth o d s: (a) Adaptivesam plingbasedon FIS, (b) Adaptiv esam plingbasedonlineara d ju stm en t, (c) Adaptivesam plingbasedonquarteradju stm ent, (d) System atic, (e) Str a tified, (f) Random sam pling... 102
Table 6-1. QoS param eterso f VoIP andexpected QoS u sin g: fuzzyinferencesy stem, d istan ce MEASUREMENT, AND REGRESSION MODEL...126
Table 6-2. QoS param eterso fvideoandexpected QoS u sin g: fuzzyinferencesy st em, distan ce MEASUREMENT, AND REGRESSION MODEL...126
Distance Measurem ent(DM), Regression Model(RM), Multi-Layer Perceptron(MLP)
... 133
Table 6-4. QoS param eterso fvideoandexpected QoS u sin g: Fuzzy Inference System (FIS), Distance Measurem ent(DM), Regression Model(RM), Multi-Layer Perceptron(MLP) ... 134
Table 7-1. WRR queuew eights... 140
Table 7-2. Trafficcharacteristics... 141
Table 7-3. WRR Param eters... 142
Table 7-4. The Am o u n to fsent, received, andlost Forem anvideofra m es...155
Table 8-1. IEEE 802.1 1e Access Categ ories... 166
AC Access Category
ACR Absolute Category Rating
ADC Analog to Digital Converter
AI Artificial Intelligent
AIFS Arbitration Inter Frame Space
AIFSN Arbitration Inter Frame Space Number
ANN Artificial Neural Network
AODV Ad hoc On-Demand Distance Vector
AP Access Point
CAC Call Admission Control
CAN Controller Area Network
CAP Controlled Access Phase
CBR Constant Bit Rate
CFP Contention Free Period
CF-Poll Contention Free Poll
cwmax
Maximum Contention WindowCW min Minimum Contention Window
DAC Digital to Analog Converter
DCF Distributed Coordination Function
DiffServ Differentiated Service
DIFS Distributed Inter Frame Space
DoS Denial of Service
DSDV Destination Sequenced Distance Vector
EDCA Enhanced Distributed Channel Access
FCM Fuzzy C- means
FIFO First In First Out
FIS Fuzzy Inference System
FLC Fuzzy Logic Controller
FQ Fair Queuing
FTP File Transfer Protocol
GloMoSIM Global Mobile Information System Simulator
GOP Group Of Picture
GUI Graphical User Interface
HC Hybrid Coordinator
HCCA HCF Controlled Channel Access
HCF Hybrid Coordination Function
HID Human Interface Devise
IC Integrated Circuit
IDE Integrated Development Environment
IDS Intrusion Detection System
IEEE Internet of Electrical and Electronic Engineering
IntServ Integrated Service
IP Internet Protocol
IPTV Internet Protocol Television
ISSI Inter-Sampling Section Interval
KSOM Kernel SOM
LCD liquid crystal display
LED light-emitting diode
LSP Label Switched Path
MAC Medium Access Control
MANET Mobile Ad hoc Network
MCB Microcontroller Board
MDK Microcontroller Development Kit
MLP Multi- Layer Perceptron
MOS Mean Opinion Score
MSC Massage Storage Class
MSDU MAC Service Data Unit
MSE Mean Square Error
NAM Network Animator
NS-2 Network Simulator -2
OMNET++ Optical Micro Networks Plus Plus
OPNET Optimized Network Evaluation Tool
OSI Open System Interconnection
OTcl Object Tool Command Language
OWD One Way Delay
PAR Packet Arrival Rate
PCF Point Coordination Function
PCM Plus Code Modulation
PESQ Perceptual Evaluation of Speech Quality
PIFS PCF Inter Frame Space
PLCP Physical Layer Convergence Procedure
PLR Packet Loss Ratio
PQ Priority Queuing
PSNR Peak Signal to Noise Ratio
PSQM Perceptual Speech Quality Measure
QoS Quality of Service
RAM Random Access Memory
RED Random Early Detection
RNN Random Neural Network
ROM Read Only Memory
RSE Relative Standard Error
RST Request to Send
SD Secure Digital
SI Service Interval
SID Sample Interval Difference
SIFS Short Inter Frame Space
SOM Self Organising Map
TCL Tool Command Language
TCP Transmission Control Protocol
TD Transmission opportunity Duration
TORA Temporally Ordered Routing Algorithm
TSW Time Sliding Window
TXOP Transmission Opportunity
VBR Variable Bit Rate
VoIP Voice over Internet Protocol
VVoIP Voice and Video over Internet Protocol
WFQ Weighted Fair Queuing
WLAN Wireless Local Area Network
WRR Weighted Round Robin
Symbol Definition Equation
n e t ) Throughput in bit per second (bps) during ith time interval
2.1
Pi ( 0 No. of bits of all successfully received packets during interval ith
D, Delay of the ith packet arrives at its final destination
2.2
Ri Sending timestamp of the ith packet.
Si Arrival timestamp of ith packet.
Ji
Jitter of ith packet 2.4P h Packet Loss ratio in percentage (%) during ith timeinterval 2.6
w,
Associated weight for queue (i) in weithed round robin 2.8R Link capacity
y Dependent variable in regression model formula
2.9 ••• • > No. formulan of Independent variables in regression model
b0,b lf b2, ...bn No. independent variables in regression model formulan of regression coefficients determined from e A column vector of formula n error terms in regression model
Mx Degrees of membership functions for fuzzy sets X 2.14
My Degrees of membership functions for fuzzy sets Y
X In FCM, is matrix of size feature data n X Nrepresenting a given set of
2.16
u
Membership matrix of size n x C generated by FCMV Matrix of clusters' centres generated by FCM
c
No. of clusters generated by FCMm Controls the degree of fuzziness for the membership of thecluster
N Degree of membership between cluster i Xj to the centre v t of
D2
u u Euclidian distance between Xj to the centre of cluster i
s Resulting value of summation function of MLP
2.21
Xi
Input i to MLPWj Associated neuron connection weight of input i
y The output of activation function <p (s) of MLP
2.22
d Desired output of training example
e Calculated error between d and y
Xi Input i to SOM 2.23
wu Associated connection weight between input i and neuron j
Wij (n) Current weight of winning neuron
2.24
wif (n + 1 ) Updated weight of winning neuron
V
Learning ratetraffic being sampled
5.1
medianl Median value of pre- sampling section for throughput oftraffic being sampled
median2 Median value of post- sampling section for throughput oftraffic being sampled
stdl throughput of traffic being sampledStandard deviation value of pre- sampling section for
std2 Standard deviation value of post- sampling section forthroughput of traffic being sampled
Updated ISSI Updated length of Inter- Sampling Section Interval 5.2
Ail Update the length of ISSI by increasing it linearly
p2 Update the length of ISSI by decreasing it linearly 5.3
V Update the length of ISSI in quarter adjustment mechanism 5.4 - 5.5
VMM Gaussian membership of value (x) of ith fuzzy set A1
5.6
Ct The mean of the ith fuzzy set A1
Standard deviation of the ith fuzzy set A1
Y Deffuzzification output using centroid method
5.7
Vi Centroid of fuzzy region i
Hi Output membership value
m Number of fuzzy sets after implication process
SID Sample Interval Difference 5.8
Bias Shows the difference between mean of sampled version ofQoS parameter and the mean of its original population
Mt Mean of QoS parameters for the sampled version
5.9
M Mean of QoS parameters for original population
N Number of simulation runs
RES Relative Standard Error
5.10
SE Standard Error of sampled version
n Sample size
Quality of Service (QoS) management is currently one of the principle technological fields of development in computer networks. Computer networks are increasingly integrated and carry a diverse set of traffic such as Voice over Internet Protocol (VoIP), video streaming, video conferencing, and traditional data. The interconnection of wired and wireless networks and the rapid growth of real-time and non real-time applications transmitted over these networks have made QoS management an area that requires further research and development. QoS management of these networks is important to both users as well as the network service providers. Users are interested in determining how well they receive applications. The network service providers and network managers need QoS information to determine how well their networks are preforming. Therefore, the main focus of the study is to develop mechanisms associated with QoS management processes for multimedia computer networks.
The purpose of this chapter is to: clarify the rationales behind this research which are presented in section 1.1, outline the aim and objectives in section 1.2, summarise the contribution of this research in section 1.3, and present the outline and organisation of this thesis in section 1.4.
1.1
Research Motivations
In this study, network QoS management refers to evaluation and improvement of QoS in wired and wireless computer networks. Evaluation of QoS aims to analyse and quantify a network performance with respect to meet the applications1 transmission requirements. QoS improvement involves the ability to take actions to enhance network performance. However, there are complexities associated with realising QoS management and so the area is an important field of research. The following points summarise the QoS management issues considered in this study:
accurately sample packets and present them to the network management entities responsible for their interpretation and decision making. Most of current sampling techniques use a predetermined and fixed sampling rate irrespective of the extent of traffic fluctuation with time. The sampling therefore is not the optimal as the multimedia traffic is time varying. In a fixed rate sampling method, two situations could occur: (a) If the traffic fluctuation (i.e. frequency of variation) is high, there is a risk of losing important information (caused by under sampling), (b) If the traffic fluctuation is low, resources would be under utilised (by over sampling) (Giertl et al, 2006). In order to reduce the biasness presented in conventional fixed rate sampling and to enhance the process of gathering Quality of Service (QoS) information, traffic should be sampled adaptively. In other words, a small sample interval is required during the period of high activity, whereas a larger sample interval is required during the period of low traffic fluctuation.
(ii) Gathered network information is indicative of its performance in delivering real time and non-real-time applications. The data collected include parameters related to QoS such as delay, jitter, throughput, and packet loss. These parameters need evaluating in an informative and effective manner. The evaluation of QoS is currently carried out either by analysis or measurement techniques. The analysis techniques are used to examine the characteristics of the traffic (Chen et al, 2009) and (Timo et al, 2002), whereas the measurement techniques are applied to determine how well the network treats the ongoing traffic (Palomar et al, 2008), (Teyeb et al, 2006), (Cranley and Davis, 2005), and (Mishra and Sharma, 2003). The current state-of-the-art of QoS analysis and measurement approaches have several limitations. For example, they are not combined to form a mechanism to evaluate QoS from an analysis and measurement point of view. Moreover, current QoS measurement techniques can generate an excessive traffic load that affect the operation of the network as in active measurement approach or they perform by measuring the actual network traffic that requires collecting and processing a large amount of recorded data packets in order to provide an indication of network performance as in passive approaches (Brekne et al, 2002). Subjective and objective QoS measurement approaches have also some limitations. The former approach cannot be automated since it requires a controlled environment, and it is time consuming to be repeated frequently due to its dependence on human subjects (Palomar et al, 2008). Objective approaches are computationally
intensive because their operations are at the pixel level and they cannot take into the account all the affected network parameters (Mohammed et al, 2001). These limitations highlight the need for further development in evaluation of QoS. In order to evaluate QoS effectively, the proposed methods need to combine analysis and measurement techniques. The methods require evaluation of QoS in a manner similar to human subjects and quantify the QoS without the necessity for complex mathematical models, taking into the account the QoS requirements of every type of multimedia applications. In addition, the methods should not add a significant extra load to the network as is the case with active approaches, nor should it depend on collection of all traffic packets.
(iii) Delivery of multimedia applications is still with limitations, especially for wireless networks. A major bottleneck in transmission of real-time multimedia applications is insufficient channel bandwidth. Accordingly, QoS could be unpredictable. Therefore, deployment of network QoS enhancement techniques can be beneficial for multimedia transmission. However, most previous studies considered QoS support either in wireless local area networks (WLANs) or in wired networks. There are few studies to enable end-to-end QoS in wired and wireless networks (Skyrianoglou et al, 2002), (Park et al, 2003), and (Senkindu and Chan2008). The limitations of these studies were the inclusion of an intermediate layer between the MAC and IP layers in wireless stations, which in turn added more complexity in managing the wireless side of the network, or the low priority traffic was starved due to link congestions and QoS prioritisation. The challenge to enable end-to-end QoS is the inclusion of both parts of the network (i.e. wired and wireless) to provide different treatments for different classes of traffic and efficient use of network resources.
Therefore, developing a portable hand-held device that accurately determines the overall network QoS for multimedia applications can be very valuable. In this study, a mechanism that assesses QoS by taking into the account the requirements of multimedia applications is implemented on a portable microprocessor board.
1.2
Research Aim and Objectives
The focus in this research is on network QoS management which entails evaluation and improvement of QoS. This raises the following research question: to what extent, the QoS evaluation and improvement can be interrelated, and do they require different mechanisms to be integrated.
The overall aim of this study is to develop techniques to evaluate QoS in multimedia networks and to use this information as part of a network management process to improve its performance. The study uses IEEE 802.1 le standard for the wireless side of the network. The wireless is connected to a wired network. The objectives of the study are to:
i. Develop approaches that allow QoS parameters of multimedia applications to be collected efficiently and accurately.
ii. Develop techniques to analyse and interpret QoS parameters of multimedia networks.
iii. Develop techniques to allow the QoS information to be used as part of network management to improve its performance.
iv. Develop an electronic portable device that facilitates accurate QoS assessment of multimedia networks.
v. Critically evaluate the developed techniques to determine their effectiveness and accuracy.
This study will involve multimedia type networks that integrate both wired and wireless parts.
1.3
Research Contributions
Improvement in managing QoS of multimedia applications is essential, particularly when dealing with hybrid wired and wireless structures. The techniques proposed in this study contribute to extending the knowledge in QoS management. This section outlines
the contributions of this research in line with its objectives. The research contributions of this study are included in relevant chapters. These contributions are outlined below.
(i) Develop approaches that allow QoS parameters of multimedia applications to
be collected efficiently and accurately. In order to facilitate effective traffic data gathering, novel statistical adaptive sampling techniques are developed that utilised traffic's statistical features. These techniques adjust the sampling interval by considering the traffic's statistical features between two consecutive sampled sections using: quarter adjustment approach (Dogman, et al., 2010a), simple linear adjustment approach (Dogman, et al., 2010b) and fuzzy inference system (Dogman, et al., 2011). Chapter 5 of this thesis introduces the adaptive statistical sampling techniques which were based on three adjustment mechanisms: quarter adjustment mechanisms, simple linear adjustment mechanisms, and fuzzy inference system. Also, a comparison of the devised methods versus conventional non-adaptive sampling techniques (i.e. systematic sampling, stratified sampling, and random sampling) was carried out to validate the effectiveness of proposed sampling techniques.
(ii) Develop techniques to analyse and assess QoS parameters of multimedia
networks. The contribution of this study is development of mechanisms that
combines analysis and measurement techniques to evaluate QoS of multimedia applications in an effective manner. Two innovative QoS evaluation systems are proposed based on Artificial Intelligence (Al) and traditional techniques. The latter combines Fuzzy C-Means (FCM) and the regression model to analyse and assess the QoS of multimedia applications (Dogman, et al., 2012a). The former system analyses and assesses the QoS of multimedia applications based on a combination of supervised and unsupervised neural networks (Dogman, et al.,
successfully quantified. The process of evaluating QoS is explained in details in Chapter 6.
(iii) Develop techniques to allow the QoS information to be used as part of network
management to improve its performance. A scheme that improves QoS in both
wired and wireless domains of the network is proposed in (Dogman, et al., 2012c). A description of the proposed QoS enhancement scheme is provided in Chapter 7. The scheme uses a combination of MAC layer QoS control in the wireless domains and network layer QoS control in the wired domains. A novel aspect of the scheme is that an adaptive access category (AC) traffic allocation is devised and incorporated into wireless access point (AP) in order to improve the QoS of IEEE 802.lie Enhanced Distributed Channel Access (EDCA) protocol, and Weighted Round Robin (WRR) queuing scheduling mechanism is implemented into congestion point (i.e. router) in wired networks to support fair distribution of bandwidth among different traffic classes. The adaptive traffic allocation algorithm determines the packet arrival rate (PAR) of the up- and down-link traffic for each access category (AC). It then dynamically allocates traffic of a lower priority AC to the next higher AC, when the higher AC is not receiving traffic at the time. Whereas, WRR shares the network resources, based on the traffic’s QoS requirements. The results explained in Chapter 7 show the improvement in QoS provided by wired and wireless sides when the QoS enhancement scheme was implemented.
(iv) Develop an electronic portable device that facilitates accurate QoS assessment
of multimedia networks. A hardware QoS monitoring system is designed
(Dogman, et al., 2013). The system is used regression modelling, implemented on the MCB2300 KEIL ARM microcontroller board. More details about QoS monitoring system are provided in Chapter 8. The hardware QoS monitoring system analysed the QoS requirements (i.e. delay, jitter and packet loss ratio) of multimedia applications to determine their overall QoS. The evaluation of QoS monitoring system was carried out by comparing the results obtained with other QoS assessment methods to indicate the effectiveness of the developed system in monitoring multimedia QoS accurately.
1.4
Thesis Organisation
Figure 1-1 shows the schematic overview of the thesis. In addition to the introduction chapter, which outlines the rationales for this study, study’s aim and objectives, and a summary of the contribution of the research to QoS management area are explained. There are eight further chapters in this thesis.
Chapter 2 covers the theoretical background essential for this research. This includes the definitions of QoS and its parameters, QoS requirements of multimedia applications, the service levels of QoS, and QoS components. Chapter 2 also provides a detailed description of IEEE 802.1 le as an emerging WLANs standard to provide QoS, and packet scheduling mechanisms as the most commonly mechanisms implemented in wired network to support QoS. In addition to that, the theories of statistical and Al techniques used in this study are provided. Regression model as one of the most widely employed statistical analysis methods is described. The fundamental principles of three important paradigms in Al system: fuzzy logic, fuzzy clustering, and neural network with their operational steps are also discussed.
In Chapter 3, the previous studies relevant to the aforementioned issues of managing the QoS in multimedia networks in section 1.1 are critically analysed and discussed. The aim is to identify the potential limitations associated with these issues which in turn are further developed. Chapter 3 is organised to review the sampling techniques used to gather information from network traffic, and discuss the state-of-the-art o f QoS analysis and assessment techniques used to evaluate network QoS. The relevant studies considering QoS support in the context of wireless-wired networks are also analysed, and the exiting monitoring tools used to assess the network performance are reviewed. Moreover, the applications of statistical and Al techniques used in this study into the field of network QoS management are reviewed in that chapter.
The main results of this research are provided in Chapters 5-8. In Chapter 5, statistical adaptive sampling techniques to adjust sampling rate based on traffic’s statistics are introduced. A detailed description of the proposed adaptive statistical sampling techniques which are based on three adjustment mechanisms: quarter adjustment mechanisms, simple linear adjustment mechanisms, and fuzzy inference system is provided. An implementation of conventional sampling techniques (i.e. systematic sampling, stratified sampling, and random sampling) is explained. The experimental results in Chapter 5 show the effectiveness of statistical sampling techniques by carrying out a comparison of devised statistical sampling technique versus the conventional sampling techniques using a simulated computer network.
Chapter 6 introduces the use of statistical and Al techniques in the area of QoS management. Two innovative QoS evaluation approaches are explained. The first approach combines Fuzzy C-Means (FCM) and regression model to analyse and assess QoS of multimedia applications in a simulated network, whereas the other approach analyses and assesses QoS in multimedia applications using a combination of supervised and unsupervised neural networks. The transmitted application’s QoS parameters are initially analysed either by FCM clustering algorithm or by the unsupervised learning Kohonen neural network (i.e. Self-Organising Maps (SOM)). The analysed QoS parameters are then used as inputs to a regression model or supervised learning Multi-Layer Perceptron (MLP) neural network in order to quantify the overall QoS. Results in Chapter 6 show how the proposed QoS evaluation systems provide information about the network’s QoS patterns and based on this information, how the overall network’s QoS is quantified.
In Chapter 8, a network QoS monitoring system is designed and evaluated. The proposed monitoring system incorporates the QoS assessment approach developed by (Dogman et al, 2012a) that is based on regression model. The microcontroller board
MCB2300 KEIL ARM is used. Chapter 8 explains the MCB2300 KEIL ARM
microcontroller board, and outlines how the QoS assessment technique using regression modelling is devised, and implemented on the MCB2300 KEIL ARM microcontroller board. The performance of QoS monitoring system is compared with other QoS assessment methods (e.g. QoS assessment using Fuzzy Inference System introduced by (Al-Sbou et al, 2006), and Neural Network QoS monitoring approach proposed by (Dogman et al, 2012b). The results indicated that the developed system is capable of accurately assessing QoS.
QoS overview
IEEE 802.lie QoS mechanisms
QoS in wired networks
Fuzzy logic Fuzzy clustering Neural networks Regression model Simulation package Network settings Traffic types Measurement process
FCM analysis technique
SOM analysis technique
RM assessment technique
MLP assessment technique
Chapter 1: Introduction Chapter2: Theory and background Chapter3: Literature review
QoS assessment using keil MDK-ARM evaluation
board
Comparison between software and hardware QoS
assessment techniques Chapter4: Experimental procedure Results chapters Chapter5: Adaptive sampling
using FIS and linear techniques
Chapter6: Evaluation of QoS
using Al techniques Chapter7: QoS improvement in WLAN-wired networks Chapter8: Implementing QoS measurement techniques on hardware Chapter9: Conclusions, and further work V_ Research Motivations
Aim and objectives
Research contributions
Thesis organisation
Sampling techniques for computer network traffic
QoS analysis and measurement techniques
Improvement of QoS in computer networks
Hardware implementation of QoS assessment
techniaues
Quarter adjustment of adaptive sampling scheme
Adaptive sampling scheme based on linear adjustment
Adaptive sampling using Fuzzy Inference System
Comparison between adaptive and non adaptive
sampling techniques
Adaptive allocation traffic algorithm in 802.1 le
Implement WWR in wired side of the network
Comparison between QoS enhancement scheme and network legacy scheme
Conclusions
r
Further work ^—
Figure 1-1. The schematic overview of the thesis.
[image:34.615.106.509.43.727.2]2.1
Introduction
The aim of this chapter is to provide the background related to the main issues of this study. Section 2.2 of this chapter gives an overview of QoS in multimedia networks. This includes definitions of QoS and its parameters, QoS requirements of multimedia applications, the service levels required of QoS, and QoS components. Section 2.3 discusses the QoS in wireless and wired networks. This section includes a detailed description of IEEE 802.lie as an emerging WLAN standard to provide QoS, and packet scheduling mechanisms as the most commonly used mechanisms implemented in wired network to support QoS. Section 2.4 introduces the theory of statistical and Al techniques used in this study. This includes the basic concepts of regression analysis as one of the most widely employed statistical modelling methods and the fundamental principles of three important paradigms in Al system: fuzzy logic, fuzzy clustering, and neural network.
2.2
Quality of Service (QoS): An overview
Wired and wireless networks are becoming increasingly integrated. This is coupled with the rapid growth of real-time and non-real-time applications transmitted over these networks. These developments necessitated a greater emphasis on QoS of networks. As its aim is to provide guaranteed services for different applications, QoS is currently one of the principle research topics in computer network.
2.2.1 Definition of QoS:
In the world of telecommunications, each of the terms: “quality” and “service” has its own definition. The latter term means the ability of network as specified by the service
provider to transmit information to the end user, whereas the term “quality” is used to
performance, which determines the degree of satisfaction of the user of the service” (ITU, 1994). While from the technical aspects, QoS can be defined as the ability of network to provide a better service to selected traffic over a variety of technologies. QoS is thus "a collection of technologies, which allow network-aware applications to request and receive predictable service levels in terms of data throughput capacity (bandwidth), latency variations (jitter) or propagation latency (delay)" (Saliba et al, 2005). From service provider perspective, QoS is "a set of service requirements to be met by the network, while transporting a flow." (Crawley et al, 1998). In this study, the term QoS refers to the ability of network to assess and provide desired QoS requirements in terms of delay, jitter, throughput, and packet loss for transmitted multimedia applications.
2.2.2 QoS Parameters
In packet-switched networks, there are a number of QoS parameters that can be assessed and measured to determine QoS. These parameters can express how well the network treats packets during their journey from the source, throughout the network, and finally to their destinations. However, as different applications require different QoS parameters, a correct set of QoS parameters for a particular application being transmitted should be determined in order to effectively evaluate the QoS provided by the network for that particular application (Cheong and Lai, 1999). For instance, time sensitive applications such as video and Voice over IP (VoIP) are susceptible to transmission parameters such as packet delay, jitter, loss and throughput whereas time insensitive operations such as a file transfer are more sensitive to packet loss, but can tolerate transmission jitter (Kurose and Ross, 2005). In this study, multimedia applications will be considered. Therefore, the most important QoS parameters would be examined and quantified are throughput, delay, jitter, and packet loss ratio. The following subsections explain these parameters.
2.2.2.1
Throughput
Throughput is used to assess the capability of network to transmit data over a given period of time (Heckmann et al, 2002). It could be defined as the maximum transmission rate of packets that can be sustained between two endpoints. Wang et al (2000) defined the throughput as the amount of successfully received packets in a predefined time. Equation (2.1) is used to calculate the throughput:
T,
(t) =
(2.1)
l iWhere T* is the measured throughput in bit per second (bps) during the ith interval, £ P i(t) is the total bits of all successfully received packets during the ith interval, and
tt is the time duration of the ith interval.
2.2.2.2
Delay
Delay is defined as the elapsed time for a packet to travel from its source to its destination. It can be also defined as the total amount of time that the packet takes to be sent from its source, through the network, until it reaches its destination (Heckmann et al, 2002). However, as the packet travels from its source to its destination, it suffers from various types of delay such as queuing delay, transmission delay, and processing delay. A detailed explanation of these types of delay can be found in (Kurose and Ross, 2005). According to Wang et al (2000), the delay can be calculated using equation (
2
.2
):Di= Rt — St (2.2)
Where Dt is the delay of the ith packet arrived, Rt and St are the arrival and sending timestamps of the ith packet. The average delay can be calculated using equation (2.3):
Average delay = — J]Li A' n (2-3)
Most of real-time applications are delay sensitive. For example, video conferencing and voice over IP (VoIP) have high sensitivity to delay because the transmitted packets need to be replayed back at the receiver in real time (Nortal Networks, 2003).
2.2.2.3
Jitter
Jitter is defined as the variation of delay between two consecutive packets for a given traffic flow (Nortal Networks, 2003). Jitter has a significant effect on real time applications (video and audio) because they require packets to be received with a fixed delay. For example, VoIP requires packets to be arrived at a constant rate, since the received packets will be played back at real time. Therefore, a small amount of jitter might be acceptable but when the jitter increases, its effect becomes obvious and might lead to a stuttering communication with pops and clicks (Heckmann et al, 2002). Wang
et al (2000) pointed out that jitter can be calculated as the difference between the delay of two consecutive packets using equation (2.4):
Ji = I D i~ Di-ll while i>0 (2.4)
Where Ji is the jitter of the ith packet, Dt is the delay of packet i, and is the delay of the previous packet. Average jitter can be calculated as in equation (2.5):
l
Average jitter = — Yi=i Ji (2.5)
2.2.2.4
Packet Loss Ratio
Packets can be lost during their journey from source to destination. Packet loss occurs due to many effects such as inadequate physical transmission medium, collisions between packets, queuing overflow, and hardware failure (Nortal Networks, 2003). The effect of packet loss leads to "distortion, which results in a stuttering and snatch communication” (Heckmann et al, 2002). Packet loss can be defined as the percentage of transmitted packets that failed to reach their destinations as given by (Wang et al,
2000
).PLKt) = 100 X ( l - § m ) (2.6)
Where PL\ is the loss ratio in percentage (%) during the ith interval, and 2 Ri (t) and 2 St (t) are the total number of received and transmitted packets with the ith interval respectively.
2.2.3 QoS Requirements of Multimedia Applications
The QoS requirements of multimedia applications are significantly different from traditional applications. The latter applications such as email, web browsing, and file transfer can be elastic with some QoS parameters such as delay and jitter. However, the former applications (i.e. multimedia applications) such as video conferencing and VoIP have high sensitivity to QoS parameters and require a faster response from the network. A large delay or jitter can seriously degrade their quality (Kurose and Ross, 2005). The allocation of bandwidth usage for these applications can be also challenging to calculate. This is because of the number of different variables, such as codec usage, resolution, and transmission activity levels. In a computer network, some factors constrain realising an acceptable QoS. For instance, network congestion in wired networks and interference
problems in wireless networks are critical issues to provide service guarantee for transmitted multimedia applications. Therefore, the acceptable range of QoS parameters for multimedia applications must be identified. Table (2-1) indicates the sensitivity of some common applications to QoS parameters (Zhai et al, 2005) and (ITU-T, 2001).
Table 2-1. The sensitivity of some common applications to their QoS parameters.
Class Application bandwidthTypical Delay Jitter loss ratioPacket
Real-time VoIP 16-128 kbps
< 150 ms
preferred preferred< 1ms preferred< 3 %
Video 16-384kbps < 150 ms preferred preferred< 30ms preferred< 1 %
Non real
time E-mail, file transfer, web browsing Minutes N/A Zero
2.2.4 Service Levels of QoS
The service levels of QoS can be defined as the actual capability provided by a network to deliver service required by specific application. Computer network could provide three main levels of QoS agreements: best effort service (Floyd and Allman, 2008), Differentiated Service (DiffServ) (Black et al, 1998), and Integrated service (IntServ) (Braden et al, 1994). In the best effort service, the network QoS is unspecified. The packet delivery rate varies depending on the current network load. In this case, the network does not provide any guarantees or priority to the transmitted applications although the diversity of their QoS requirements. The DiffServ architecture provides a service differentiation mechanism to manage network resources based on QoS requirements of transmitted applications. In DiffServ, the transmitted applications are aggregated to a number of classes to receive a particular level of service. In IntServ architecture, end-to-end QoS guarantee per flow is provided. A flow requiring QoS guarantees must acquire sufficient network resources during its transmission to ensure its QoS requirements are met. This is achieved by a reservation of network resources for a specific flow (Shah, 2001) and (Kurose and Ross, 2005).
2.2.5 QoS Components
policing (Koutsakis, 2009), packet queue scheduling (Yu and Meng, 2009), and prioritisation (Senkindu and Chan, 2008).
The conversion of QoS representation between OSI model layers is referred to QoS mapping. In admission control, the network take a set of actions during traffic establishment phase to check if that particular traffic can be admitted or should be rejected. A new traffic is admitted to the network when its desired QoS can be satisfied, without causing any QoS violation to the already established services. The function of traffic shaping mechanism is to ensure that there is a smooth data rate in order to meet the specified QoS agreement. Traffic policing is used to monitor the transmitted traffic by discarding or remarking traffic that exceed limits in order to protect the network from malicious behaviour. Packet queue scheduling determines bandwidth allocation among transmitted packets and the manner to service various applications with different QoS requirements. In a prioritisation scheme, applications are classified based on their QoS requirements and resources are assigned according to classes of priority depending on network resource availability.
2.3