On Coreference Resolution Performance Metrics
Xiaoqiang Luo
1101 Kitchawan Road, Room 23-121
IBM T.J. Wastson Research Center
Yorktown Heights, NY 10598, U.S.A.
[email protected]
Abstract
The paper proposes a Constrained Entity-Alignment F-Measure (CEAF) for evaluating coreference resolution. The metric is com-puted by aligning reference and system entities (or coreference chains) with the constraint that a system (reference) entity is aligned with at most one reference (system) entity. We show that the best alignment is a maximum bipartite matching problem which can be solved by the Kuhn-Munkres algorithm. Comparative exper-iments are conducted to show that the widely-known MUC F-measure has serious flaws in evaluating a coreference system. The proposed metric is also compared with the ACE-Value, the official evaluation metric in the Automatic Content Extraction (ACE) task, and we con-clude that the proposed metric possesses some properties such as symmetry and better inter-pretability missing in the ACE-Value.
1
Introduction
A working definition of coreference resolution is parti-tioning the noun phrases we are interested in into equiv-alence classes, each of which refers to a physical entity. We adopt the terminologies used in the Automatic Con-tent Extraction (ACE) task (NIST, 2003a) and call each individual phrase a mention and equivalence class an
en-tity. For example, in the following text segment,
(1): “The American Medical Association
voted yesterday to install the heir apparent as
its president-elect, rejecting a strong, upstart challenge by adistrict doctorwho argued that the nation’s largest physicians’ group needs stronger ethics and new leadership.”
mentions are underlined, “American Medical Associa-tion”, “its” and “group” refer to the same organization
(object) and they form an entity. Similarly, “the heir ap-parent” and “president-elect” refer to the same person and they form another entity. It is worth pointing out that the entity definition here is different from what used in the Message Understanding Conference (MUC) task (MUC, 1995; MUC, 1998) – ACE entity is called coreference chain or equivalence class in MUC, and ACE mention is called entity in MUC.
An important problem in coreference resolution is how to evaluate a system’s performance. A good performance metric should have the following two properties:
Discriminativity: This refers to the ability to differ-entiate a good system from a bad one. While this criterion sounds trivial, not all performance metrics used in the past possess this property.
Interpretability: A good metric should be easy to in-terpret. That is, there should be an intuitive sense of how good a system is when a metric suggests that a certain percentage of coreference results are correct. For example, when a metric reports
or above correct for a system, we would expect that the vast majority of mentions are in right entities or corefer-ence chains.
A widely-used metric is the link-based F-measure (Vi-lain et al., 1995) adopted in the MUC task. It is computed by first counting the number of common links between the reference (or “truth”) and the system output (or “re-sponse”); the link precision is the number of common links divided by the number of links in the system out-put, and the link recall is the number of common links divided by the number of links in the reference. There are known problems associated with the link-based F-measure. First, it ignores single-mention entities since no link can be found in these entities; Second, and more importantly, it fails to distinguish system outputs with different qualities: the link-based F-measure intrinsically favors systems producing fewer entities, and may result
in higher F-measures for worse systems. We will revisit these issues in Section 3.
To counter these shortcomings, Bagga and Baldwin (1998) proposed a B-cubed metric, which first computes a precision and recall for each individual mention, and then takes the weighted sum of these individual preci-sions and recalls as the final metric. While the B-cubed metric fixes some of the shortcomings of the MUC F-measure, it has its own problems: for example, the men-tion precision/recall is computed by comparing entities containing the mention and therefore an entity can be used more than once. The implication of this drawback will be revisited in Section 3.
In the ACE task, a value-based metric called ACE-value (NIST, 2003b) is used. The ACE-ACE-value is com-puted by counting the number of false-alarm, the num-ber of miss, and the numnum-ber of mistaken entities. Each error is associated with a cost factor that depends on things such as entity type (e.g., “LOCATION”, “PER-SON”), and mention level (e.g., “NAME,” “NOMINAL,” and “PRONOUN”). The total cost is the sum of the three costs, which is then normalized against the cost of a nom-inal system that does not output any entity. The ACE-value is finally computed by subtracting the normalized cost from . A perfect coreference system will get a
ACE-value while a system outputs no entities will get a ACE-value. A system outputting many erroneous
entities could even get negative value. The ACE-value is computed by aligning entities and thus avoids the problems of the MUC F-measure. The ACE-value is, however, hard to interpret: a system with
ACE-value does not mean that
of system entities or mentions are correct, but that the cost of the system, relative to the one outputting no entity, is
.
In this paper, we aim to develop an evaluation metric that is able to measure the quality of a coreference system – that is, an intuitively better system would get a higher score than a worse system, and is easy to interpret. To this end, we observe that coreference systems are to recognize
entities and propose a metric called Constrained
Entity-Aligned F-Measure (CEAF). At the core of the metric is the optimal one-to-one map between subsets of reference and system entities: system entities and reference entities are aligned by maximizing the total entity similarity un-der the constraint that a reference entity is aligned with at most one system entity, and vice versa. Once the to-tal similarity is defined, it is straightforward to compute recall, precision and F-measure. The constraint imposed in the entity alignment makes it impossible to “cheat” the metric: a system outputting too many entities will be pe-nalized in precision while a system outputting two few entities will be penalized in recall. It also has the prop-erty that a perfect system gets an F-measure while a
system outputting no entity or no common mentions gets an F-measure . The proposed CEAF has a clear
mean-ing: for mention-based CEAF, it reflects the percentage
of mentions that are in the correct entities; For entity-based CEAF, it reflects the percentage of correctly recog-nized entities.
The rest of the paper is organized as follows. In Sec-tion 2, the Constrained Entity-Alignment F-Measure is presented in detail: the constraint entity alignment can be represented by a bipartite graph and the optimal alignment can be found by the Kuhn-Munkres algo-rithm (Kuhn, 1955; Munkres, 1957). We also present two entity-pair similarity measures that can be used in CEAF: one is the absolute number of common mentions between two entities, and the other is a “local” mention F-measure between two entities. The two F-measures lead to the mention-based and entity-based CEAF, respectively. In Section 3, we compare the proposed metric with the MUC link-based metric and ACE-value on both artificial and real data, and point out the problems of the MUC F-measure.
2
Constrained Entity-Alignment
F-Measure
Some notations are needed before we present the pro-posed metric and the algorithm to compute the metric.
Let reference entities in a document be
!#"$""%
&'%)(
and system entities be
*
&+,-./!#"$"$"0#%
*
%1(2
To simplify typesetting, we will omit the dependency on
when it is clear from context, and write
& as
and
* as
*
. Let
3
5476)89%
%:#%
*
%1(
;
547< =0 %
%1%
*
%)(
and let?>A@B
and* >C@ *
be any subsets with3
enti-ties. That is,%
?> %!
3
and% * >
%-3
. LetD E?>
* >
be the set of one-to-one entity maps from >
to
*
>
, and
D
>
be the set of all possible one-to-one maps between the size-3
subsets of
and
*
. Or
D
E >
* >
FHGI
>AJK * > (
D
>
ML+NOQPSRTUPWVD X?>
* > Y2
The requirement of one-to-one map means that for any
G[Z\D E?>
*
>
, and any ]Z ?>
and ^_Z ?>
, we have that a`bS^ implies thatG
cd`eG
^f, and
G
c`gG
^f implies thate`h^. Clearly, there are 35i
one-to-one maps from?>
to* >
(or %:D E?>
* > '%c 3Bi
), and%1D
>
%- j
>
3Bi
. Letk
l,m be a “similarity” measure between two
en-tities and , . k
value means that and, have nothing in common. For
example,k
n,m could be the number of common
men-tions shared by and, , andk
l$c the number of
men-tions in entity .
For anyG_ZoD
>
, the total similarityp
G9 for a mapG
is the sum of similarities between the aligned entity pairs:
p G9 qr O P k lYG
c . Given a document , and
its reference entities
and system entities
*
, we can find the best alignment maximizing the total similarity:
Gtsu5< v/wx47< = y r.z
P
p
Gt
5< v/wx47< =
y r.z P qr OQP k n'G
c Y2 (1)
Let s > and* s > bG s X s >
denote the reference and
system entity subsets whereG s is attained, respectively.
Then the maximum total similarity is
p
G s + qr O{P k lYG s
c '2 (2)
If we insist that k
l$,SB| whenever or , is
empty, then the non-negativity requirement of k
l$,S
makes it unnecessary to consider the possibility of map-ping one entity to an empty entity since the one-to-one map maximizingp
Gt must be inD
>
.
Since we can compute the entity self-similarity
k
l$c and k
,t$,m for any }Z
and,~Z
*
(i.e., using the identity map), we are now ready to define the precision, recall and F-measure as follows:
p G s k ,0 ,- (3) p G s k /$ (4) 2 (5)
The optimal alignment G s involves only
3 47618% %:#% *
%)( reference and system entities, and entities
not aligned do not get credit. Thus the F-measure (5) pe-nalizes a coreference system that proposes too many (i.e., lower precision) or too few entities (i.e., lower recall), which is a desired property.
In the above discussion, it is assumed that the sim-ilarity measure k
l,m is computed for all entity pair
l,m. In practice, computation of k
n,m can be
avoided if it is clear that and, have nothing in common
(e.g., if no mention in and, overlaps, thenk
l,m+ ). These entity pairs are not linked and they will not
be considered when searching for the optimal alignment. Consequently the optimal alignment could involve less than3
reference and system entities. This can speed up considerably the F-measure computation when the ma-jority of entity pairs have zero similarity. Nevertheless,
summing over3
entity pairs in the general formulae (2) does not change the optimal total similarity between
and
*
and hence the F-measure.
In formulae (3)-(5), there is only one document in the test corpus. Extension to corpus with multiple test doc-uments is trivial: just accumulate statistics on the per-document basis for both denominators and numerators in (3) and (4), and find the ratio of the two.
So far, we have tacitly kept abstract the similarity mea-surek
l$,m for entity pair and, . We will defer the
discussion of this metric to Section 2.2. Instead, we first present the algorithm computing the F-measure (3)-(5).
2.1 Computing Optimal Alignment and F-measure
A naive implementation of (1) would enumerate all the possible one-to-one maps (or alignments) between
size-3
(recall that 3
46)89 %
%1%
*
%)( ) subsets of
and size-3
subsets of*
, and find the best alignment max-imizing the similarity. Since this requires computing the similarities between3
;
entity pairs and there are
%1D
>
%t j
>
35i
possible one-to-one maps, the complex-ity of this implementation is
'; 3| j > 3Bi . This
is not satisfactory even for a document with a moderate number of entities: it will have about-2 million
opera-tions for;
3
, a document with only
refer-ence and system entities.
Fortunately, the entity alignment problem under the constraint that an entity can be aligned at most once is the classical maximum bipartite matching problem and there exists an algorithm (Kuhn, 1955; Munkres, 1957) (henceforth Kuhn-Munkres Algorithm) that can find the optimal solution in polynomial time. Casting the entity alignment problem as the maximum bipartite matching is trivial: each entity in
and
*
is a vertex and the node pair
n,m, whereZ
,,Z
*
, is connected by an edge with the weightk
l$,m. Thus the problem (1) is
exactly the maximum bipartite matching.
With the Kuhn-Munkres algorithm, the procedure to compute the F-measure (5) can be described as Algo-rithm 1.
Algorithm 1 Computing the F-measure (5). Input: reference entities:
; system entities:*
Output: optimal alignmentG s ; F-measure (5).
1:Initialize:G
s
M ;p
G
s
+o .
2:ForM to%
%
3: For to%
*
%
4: Computek
',-..
5:[G s ,p
G s ]=KM {&XcHWt } .
6: Xx9¡ ¢0£¤ &Xc¥l; XW¡ ¦§£¨uU'!©W .
7:ªn¡C«U¬® {#¯ «&¬ ¤ ¯ ; °c¡C«U¬® {#¯ «&¬ ¨ ¯ ; ±¡²¥³©´ ³Hµ!´ . 8:return¶· and± .
The input to the algorithm are reference entities
and system entities
*
one-to-one mapG
s and F-measure in equation (5). Loop from
line 2 to 4 computes the similarity between all the pos-sible reference and system entity pairs. The complexity of this loop is
Y;
3
. Line 5 calls the Kuhn-Munkres
algorithm, which takes as input the entity-pair scores
k
n,m'( and outputs the best map G s and the
corre-sponding total similarity p
G
s
. The worst case (i.e.,
when all entries ink
n,m'( are non-zeros) complexity
of the Kuhn-Algorithm is ';
3¹¸tº)»
w
3
. Line 6
com-putes “self-similarity” p E
and p *
needed in the
F-measure computation at Line 7.
The core of the F-measure computation is the Kuhn-Munkres algorithm at line 5. The algorithm is initially discovered by Kuhn (1955) and Munkres (1957) to solve the matching (a.k.a assignment) problem for square ma-trices. Since then, it has been extended to rectangu-lar matrices (Bourgeois and Lassalle, 1971) and paral-lelized (Balas et al., 1991). A recent review can be found in (Gupta and Ying, 1999), which also details the tech-niques of fast implementation. A short description of the algorithm is included in Appendix for the sake of com-pleteness.
2.2 Entity Similarity Metric
In this section we consider the entity similarity metric
k
l$,S defined on an entity pair
l,m. It is desirable
thatk
l$,m is large when and, are “close” and small
when and, are very different. Some straight-forward
choices could be
kt¼
l$,m
ifM, - otherwise2
(6)
k
¸
l$,m
if¾½I,F` - otherwise2
(7)
(6) insists that two entity are the same if all the mentions are the same, while (7) goes to the other extreme: two entities are the same if they share at least one common mention.
(6) does not offer a good granularity of similarity: For example, if ¿ÀÁ§Â$Ã( , and one system response
is , ¼ ÄÁ$Â$( , and the other system response ,
¸
Á&( , then clearly , ¼ is more similar to than , ¸ , yet
k
l$,ż$ÆÇk
n,
¸
È . For the same reason, (7)
lacks of the desired discriminativity as well.
From the above argument, it is clear that we want to have a metric that can measure the degree to which two entities are similar, not a binary decision. One natural choice is measuring how many common mentions two entities share, and this can be measured by the absolute number or relative number:
k§É
l,mÊ%1¾½I,% (8)
k§Ë
l,mÊ
-%1¾½?,% %1%
%1,%
2 (9)
Metric (8) simply counts the number of common men-tions shared by and , , while (9) is the mention
F-measure between and, , a relative number measuring
how similar and, are. For the abovementioned
exam-ple,
k É
l$, ¼ Fk É
Á§Â$Ã(Á$Â$(§9B kÉ
l$,
¸
FkÉ
Á§Â$Ã(Á&( 9 kË
l$,¼FkË
Á§Â$Ã(Á$Â$(§9B!2Ì k Ë
l$,
¸
Fk Ë
Á§Â$Ã(Á&( 9B!2
thus both metrics give the desired ranking
k É
l$, ¼ ÊÍk É
l$,
¸
, k Ë
l, ¼ ÊÍMk Ë
n,
¸
.
IfkÉ
"1"X is adopted in Algorithm 1,p
G s is the
num-ber of total common mentions corresponding to the best one-to-one mapG
s while the denominators of (3) and (4)
are the number of proposed mentions and the number of system mentions, respectively. The F-measure in (5) can be interpreted as the ratio of mentions that are in the “right” entities. Similarly, ifkË
":#") is adopted in
Algo-rithm 1, the denominators of (3) and (4) are the number of proposed entities and the number of system entities, respectively, and the F-measure in (5) can be understood as the ratio of correct entities. Therefore, (5) is called mention-based CEAF and entity-based CEAF when (8) and (9) are used, respectively.
k É
"1"X andk Ë
":#") are two reasonable entity similarity
measures, but by no means the only choices. At tion level, partial credit could be assigned to two tions with different but overlapping spans; or when men-tion type is available, weights defined on the type confu-sion matrix can be incorporated. At entity level, entity attributes, if avaiable, can be weighted in the similarity measure as well. For example, ACE data defines three entity classes: NAME, NOMINAL and PRONOUN. Dif-ferent weights can be assigned to the three classes.
No matter what entity similarity measure is used, it is crucial to have the constraint that the document-level similarity between reference entities and system entities is calculated over the best one-to-one map. We will see examples in Section 3 that misleading results could be produced without the alignment constraint.
Another observation is that the same evaluation paradigm can be used in any scenario that needs to mea-sure the “closeness” between a set of system and refer-ence objects, provided that a similarity between two ob-jects is defined. For example, the 2004 ACE tasks include detecting and recognizing relations in text documents. A relation instance can be treated as an object and the same evaluation paradigm can be applied.
3
Comparison with Other Metrics
1 2 3 4 5
6 7
8 9 A B C
(4) system response (c)
1 2 3 4 5
6 7
8 9 A B C
(1) truth
1 2 3 4 5
6 7
8 9 A B C
(2) system response (a)
1 2 3 4 5
6 7
8 9 A B C
(3) system response (b)
1 2 3 4 5
6 7
8 9 A B C
[image:5.612.72.275.52.245.2](5) system response (d)
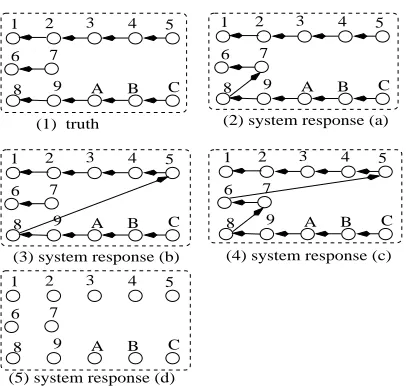
Figure 1: Example entities: (1)truth; (2)system response (a); (3)system response (b); (4)system response (c); (5)system response (d)
proposed metric has fixed problems associated with the MUC and B-cube F-measure, and has better interpretabil-ity than the ACE-value.
3.1 Comparison with the MUC F-measure and B-cube Metric on Artificial Data
We use the example in Figure 1 to compare the MUC link-based F-measure, B-cube, and the proposed mention- and entity-based CEAF. In Figure 1, mtions are represented in circles and menmtions in an en-tity are connected by arrows. Intuitively, if each men-tion is treated equally, the system response (a) is bet-ter than the system response (b) since the latbet-ter mixes two big entities, !/!/Î!
( and
$ÏuÐÑc( , while
the former mixes a small entity $!ÓÒ( with one big
en-tity$Ì!
$ÏQ$ÐÑc( . System response (b) is clearly better
than system response (c) since the latter puts all the men-tions into a single entity while (b) has correctly separated the entity$!ÓÒ( from the rest. The system response (d)
[image:5.612.323.532.56.128.2]is the worst: the system does not link any mentions and outputs single-mention entities.
Table 1 summarizes various F-measures for system re-sponse (a) to (d): the first column contains the indices of the system responses found in Figure 1; the second and third columns are the MUC F-measure and B-cubic F-measure respectively; the last two columns are the pro-posed CEAF F-measures, using the entity similarity met-rick É
"1"X andk Ë
":#"), respectively.
As shown in Table 1, the MUC link-based F-measure fails to distinguish the system response (a) and the system response (b) as the two are assigned the same F-measure. The system response (c) represents a trivial output: all mentions are put in the same entity. Yet the MUC metric will lead to a
recall (
out of
reference links are
System CEAF
response MUC B-cube k É
"1"X k Ë
"1"X
(a) 0.947 0.865 0.833 0.733 (b) 0.947 0.737 0.583 0.667 (c) 0.900 0.545 0.417 0.294 (d) – 0.400 0.250 0.178
Table 1: Comparison of coreference evaluation metrics
correct) and aÌ02
precision (
out of system links
are correct), which gives rise to a
F-measure. It is striking that a “bad” system response gets such a high F-measure. Another problem with the MUC link-based metric is that it is not able to handle single-mention enti-ties, as there is no link for a single mention entity. That is why the entry for system response (d) in Table 1 is empty. B-cube F-measure ranks the four system responses in Table 1 as desired. This is because B-cube met-ric (Bagga and Baldwin, 1998) is computed based on mentions (as opposed to links in the MUC F-measure). But B-cube uses the same entity “intersecting” pro-cedure found in computing the MUC F-measure (Vi-lain et al., 1995), and it sometimes can give counter-intuitive results. To see this, let us take a look at re-call and precision for system response (c) and (d) for B-cube metric. Notice that all the reference entities are found after intersecting with the system responsce (c): §./! -
($!#Ò(#Ì!
$ÏQ$ÐÑc(( . Therefore,
B-cube recall is
(the corresponding precision is
¼
¼
¸Ô
ÔCÕ
¼
¸
Ô
¸
¼
¸
B|!20Ò
). This is counter-intuitive because the set of reference entities is not a sub-set of the proposed entities, thus the system response should not have gotten a
recall. The same prob-lem exists for the system response (d): it gets a
B-cube precision (the corresponding B-cube recall is
¼
¼
¸
Ô
¼
Õ
Ô
¼
¸
Ô
¼
Õ
!2
, but clearly not all
the entities in the system response (d) are correct! These numebrs are summarized in Table 2, where columns with
andÖ represent recall and precision, respectively.
System B-cube CEAF
response R P ×ÓØ -R ×ÓØ -P ×ÓÙ -R ×ÓÙ -P
(c) 1.0 0.375 0.417 0.417 0.196 0.588 (d) 0.25 1.0 0.250 0.250 0.444 0.111
Table 2: Example of counter-intuitive B-cube recall or precision: system repsonse (c) gets
recall (column R) while system repsonse (d) gets
precision (col-umn P). The problem is fixed in both CEAF metrics.
The counter-intuitive results associated with the MUC and B-cube F-measures are rooted in the procedure of “intersecting” the reference and system entities, which al-lows an entity to be used more than once! We will come back to this after discussing the CEAF numbers.
[image:5.612.320.528.533.567.2]col-umn under k É ":#")) CEAF and entity-based (k Ë "1"X)
CEAF are able to rank the four systems properly: sys-tem (a) to (d) are increasingly worse. To see how the CEAF numbers are computed, let us take the system re-sponse (a) as an example: first, the best one-one entity map is determined. In this case, the best map is: the reference entity §. - - Î!
( is aligned to the system
entity §. - - Î!
( , the reference entity $Ì!
$ÏQ$ÐÚ$Ñc(
is aligned to the system $!#Ò
ÏuÐ$Ñc( and the
reference entity !ÓÒ( is unaligned. The number
of common mentions is therefore which results
in a mention-based (k§É
"1"X) recall
ÕÛ
and precision
ÕÛ
. Since k
Ë
§. - - Î!
( - !/Î!
( , and k Ë
ÏuÐ$Ñc($!#Ò
ÏuÐ$Ñc(§t ¼¥Ü
¼
¸
,p
G s
¼¥Ü
¼
¸
(c.f. equation (4) and (3)), and the entity-based F-measure (c.f. equation (9)) is therefore
Ô
¼¥Ü
¼
¸
B!2EÒ-2
CEAF for other system responses are computed similarly. CEAF recall and precision breakdown for system (c) and (d) are listed in column 4 through 7 of Table 1. As can be seen, neither mention-based nor entity-based CEAF has the abovementioned problem associated with the B-cube metric, and the recall and precision numbers are more or less compatible with our intuition: for instance, for system (c), based on k É -CEAF number, we can say
that about Î.2EÒ
mentions are in the right entity, and based on thekË -CEAF recall and precision, we can state
that about
2
of “true” entities are recovered (recall) and about
Ì!2Ì
of the proposed entities are correct. A comparison of the procedures of computing the MUC F-measure/B-cube and CEAF reveals that the cru-cial difference is that the MUC and B-cube F-measure allow an entity to be used multiple times while CEAF in-sists that entity map be one-to-one. So an entity will never get double credit. Take the system repsonse (c) as an ex-ample, intersecting three reference entity in turn with the reference entities produces the same set of reference enti-ties, which leads to
recall. In the intersection step, the system entity is effectively used three times. In con-trast, the system entity is aligned to only one reference entity when computing CEAF.
3.2 Comparisons On Real Data
3.2.1 MUC F-measure and CEAF
We have seen the different behaviors of the MUC F-measure, B-cube F-measure and CEAF on the artificial data. We now compare the MUC F-measure, CEAF, and ACE-value metrics on real data (compasion between the MUC and B-cube F-measure can be found in (Bagga and Baldwin, 1998)). Comparsion between the MUC F-measure and CEAF is done on the MUC6 coreference test set, while comparison between the CEAF and ACE-value is done on the 2004 ACE data. The setup reflects the fact
that the official MUC scorer and ACE scorer run on their own data format and are not easily portable to the other data set. All the experiments in this section are done on true mentions.
Penalty #sys-ent MUC-F kÉ -CEAF
-0.6 561 .851 0.750 -0.8 538 .854 0.756 -0.9 529 .853 0.753
-1 515 .853 0.753
-1.1 506 .856 0.764 -1.2 483 .857 0.768 -1.4 448 .863 0.761 -1.5 425 .862 0.749 -1.6 411 .864 0.740 -1.7 403 .865 0.741
[image:6.612.334.518.113.255.2]-10 113 .902 0.445
Table 3: MUC F-measure and mention-based CEAF on the official MUC6 test set. The first column contains the penalty value in decreasing order. The second column contains the number of system-proposed entities. The column under MUC-F is the MUC F-measure whilek É
-CEAF is the mention-based -CEAF.
The coreference system is similar to the one used in (Luo et al., 2004). Results in Table 3 are produced by a system trained on the MUC6 training data and tested on the official MUC6 test documents. The test set
containsÎ reference entities. The coreference system
uses a penalty parameter to balance miss and false alarm errors: the smaller the parameter, the fewer entities will be generated. We vary the parameter fromÝ-2 toÝc ,
listed in the first column of Table 3, and compare the sys-tem performance measured by the MUC F-measure and the proposed mention-based CEAF.
As can be seen, the mention-based CEAF has a clear maximum when the number of proposed entities is close to the truth: at the penlaty value Ýc2 , the system
pro-ducesÎ Ì entities, very close toÎ , and the k
É -CEAF
achieves the maximum!2EÒ Ì . In contrast, the MUC
F-measure increases almost monotonically as the system proposes fewer and fewer entities. In fact, the best system according to the MUC F-measure is the one proposing only entities. This demonstrates a fundamental flaw
of the MUC F-measure: the metric intrinsically favors a system producing fewer entities and therefore lacks of discriminativity.
3.2.2 ACE-Value and CEAF
Now let us turn to ACE-value. Results in Table 4 are produced by a system trained on the ACE 2002 and 2004 training data and tested on a separate test set, which con-tains Ì
reference entities. Both ACE-value and the
Penalty #sys-ent ACE-value(%) kÉ -CEAF
0.6 1221 88.5 0.726
0.4 1172 89.1 0.749
0.2 1145 89.4 0.755
0 1105 89.7 0.766
-0.2 1050 89.7 0.775
-0.4 1015 89.7 0.780
-0.6 990 89.5 0.782
-0.8 930 88.6 0.794
-1 891 86.9 0.780
-1.2 865 86.7 0.778
-1.4 834 85.6 0.769
[image:7.612.80.291.55.210.2]-1.6 790 83.8 0.761
Table 4: Comparison of ACE-value and mention-based CEAF. The first column contains the penalty value in de-creasing order. The second column contains the number of system-proposed entities. ACE-values are in percent-age. The number of reference entities isÌ
.
when the penalty value is Ý!2 and CEAF is maximum
when the penalty value is Ý!2Ì . However, the optimal
CEAF system produces
entities while the optimal
ACE-value system produces
entities. Judging from
the number of entities, the optimal CEAF system is closer to the “truth” than the counterpart of ACE-value. This is not very surprising since ACE-value is a weighted metric while CEAF treats each mention and entity equally. As such, the two metrics have very weak correlation.
While we can make a statement such as “the system with penalty Ý-2Ì puts about Ò
2Î
mentions in right entities”, it is hard to interpret the ACE-value numbers.
Another difference is that CEAF is symmetric1, but ACE-Value is not. Symmetry is a desirable property. For example, when comparing inter-annotator agreement, a symmetric metric is independent of the order of two sets of input documents, while an asymmetric metric such as ACE-Value needs to state the input order along with the metric value.
4
Conclusions
A coreference performance metric – CEAF – is proposed in this paper. The CEAF metric is computed based on the best one-to-one map between reference entities and sys-tem entities. Finding the best one-to-one map is a maxi-mum bipartite matching problem and can be solved by the Kuhn-Munkres algorithm. Two example entity-pair sim-ilarity measures (i.e., kÉ
":#") andk§Ë
"1"X) are proposed,
resulting one mention-based CEAF and one entity-based CEAF, respectively. It has been shown that the pro-posed CEAF metric has fixed problems associated with the MUC link-based F-measure and B-cube F-measure.
1
This was pointed out by Nanda Kambhatla.
The proposed metric also has better interpretability than ACE-value.
Acknowledgments
This work was partially supported by the Defense Ad-vanced Research Projects Agency and monitored by SPAWAR under contract No. N66001-99-2-8916. The views and findings contained in this material are those of the authors and do not necessarily reflect the position of policy of the Government and no official endorsement should be inferred.
The author would like to thank three reviewers and my colleagues, Hongyan Jing and Salim Roukos, for sugges-tions of improving the paper.
References
Amit Bagga and Breck Baldwin. 1998. Algorithms for scoring coreference chains. In Proceedings of the
Linguistic Coreference Workshop at The First Interna-tional Conference on Language Resources and Evalu-ation (LREC’98), pages 563–566.
Egon Balas, Donald Miller, Joseph Pekny, and Paolo Toth. 1991. A parallel shortest augmenting path al-gorithm for the assignment problem. Journal of the
ACM (JACM), 38(4).
Francois Bourgeois and Jean-Claude Lassalle. 1971. An extension of the munkres algorithm for the assignment problem to rectangular matrices. Communications of
the ACM, 14(12).
R. Fletcher. 1987. Practical Methods of Optimization. John Wiley and Sons.
Anshul Gupta and Lexing Ying. 1999. Algorithms for finding maximum matchings in bipartite graphs. Tech-nical Report RC 21576 (97320), IBM T.J. Watson Re-search Center, October.
H.W. Kuhn. 1955. The hungarian method for the assign-ment problem. Naval Research Logistics Quarterly, 2(83).
Xiaoqiang Luo, Abe Ittycheriah, Hongyan Jing, Nanda Kambhatla, and Salim Roukos. 2004. A mention-synchronous coreference resolution algorithm based on the bell tree. In Proc. of ACL.
MUC-6. 1995. Proceedings of the Sixth Message
Un-derstanding Conference(MUC-6), San Francisco, CA.
Morgan Kaufmann.
MUC-7. 1998. Proceedings of the Seventh Message
Un-derstanding Conference(MUC-7).
NIST. 2003a. The ACE evaluation plan. www.nist.gov/speech/tests/ace/index.htm.
NIST. 2003b. Proceedings of ACE’03 workshop. Book-let, Alexandria, VA, September.
M. Vilain, J. Burger, J. Aberdeen, D. Connolly, , and L. Hirschman. 1995. A model-theoretic coreference scoring scheme. In In Proc. of MUC6, pages 45–52.
Appendix: Kuhn-Munkres Algorithm
Let index the reference entities
and index the
sys-tem entities*
, andk
'! be the similarity between the /ÞEß reference entity and the ÞEß system entity.
Alge-braically, the maximum bipartite matching can be stated as an integer programming problem:
4< = àfáâ®ã©ä
k
Y-)åt1 (10)
subject to:
åW)næ'ç& (11)
å ) æ'ç& (12)
åt1nZÆ-#('ç&'.2 (13)
IfåW)oè , the ÞEß reference entity and the ÞEß system
entity are aligned. Constraint (11) (or (12)) implies that a reference (or system) entity cannot be aligned more than once with a system (or reference) entity.
Observe that the coefficients of (11) and (12) are uni-modular. Thus, Constraint (13) can be replaced by
å )Qé ! ç&Y2 (14)
The dual (cf. pp. 219 of (Fletcher, 1987)) to the opti-mization problem (10) with constraints (11),(12) and (14) is:
47618 àfê
â
ä
R
àfë
ã
ä
ì
í
(15)
î
2ï$20
ì
í ué k
Y-''ç&Y (16)
ì
é !'çU (17)
í
é !'çU.2 (18)
The dual has the same optimal objective value as the pri-mal.
It can be shown that the optimal conditions for the dual problem (and hence the maximum similarity match) are:
ì
í lhk
Y-' if
'! is aligned (19)
ì
B! if is free (i.e., not aligned) (20)
í
B! if is free. (21)
The Kuhn-Munkres algorithm starts with an empty match and an initial feasible set of
ì
( and
í
Ó( , and
iteratively increases the cardinality of the match while
satisfying the optimal conditions (19)-(21). Notice that conceptually, a matching problem with a rectangular matrix ðñk
'!óò can always reduce to a square one by
padding zeros (this is not necessary in practice, see, for instance (Bourgeois and Lassalle, 1971)). For this rea-son, we state the Kuhn-Munkres algorithm for the case where%
%0%
*
% (or
;
3
) in Algorithm 2. The proof of correctness is omitted due to space limit.
Note thatÖWô
ê
y
Y- on line 9 stands for the
augment-ing (i.e., a free node followed by an aligned node, fol-lowed by a free node, ...) path from to in the
corre-sponding bipartite graph.Ï õ_ÖWô
ê
y
'- is understood as
edge “exclusive-or:” if an edgeYö
$÷ø is inÏ and on the
pathÖ ô
ê
y
Y-, it will be removed fromÏ ; if the edge is
in eitherÏ orÖô
ê
y
'! , it will be added.
Algorithm 2 Kuhn-Munkres Algorithm Input: similarity matrix:ð:k
Y-óò
Output: best matchÏM '-'( and similarity p .
1:Initialize:ç& ,
ì
547<=&k
Y- ;ç& ,
í
QB ;Ï .
2:ForM to
;
3: If is not free, Continue; EndIF.
4: ùÇ$( ,úCM ;
5: While true 6: û
ùhF÷t!ü
ö
Zù
î
2ï$2)k Yö
÷ø
ì9ýl¹í§þ
(
7: Ifú
@
û
ùÿ
8: pick7Zû
ùÿú
9: If is free
10: ÏFÏBõ¾Ö
ô
ê
y
Y- ; break
11: Else
12: Find'^ such that
'^'!ÊZÆÏ .
13: ù oùbL?Y^f(úAFúFLIH!( .
14: Goto line 6. 15: EndIf 16: ElseúChû
ùÿ
17: 5476)8
ý
r
R
þ
r
ì ý ¹í þ ݾk
Yö ÷ø'(
18:
-FÁ
GS476)8
ý
r
R
þ
r
ì
ý
¹í
þ
ݾk 'ö
$÷f'(
19: ì9ý
ì9ý
Ý for
ö
Zù .
20: í§þ
í§þ0
for÷tZdú .
21: x
. Goto line 9.
22: EndIf 23: EndWhile 24:EndFor 25:p¾
N
ý
R
þ
V
rk 'ö
$÷f.