Re-evaluating Automatic Summarization with
BLEUand
192 Shades of
ROUGEYvette Graham
ADAPT Centre
School of Computer Science and Statistics Trinity College Dublin
Abstract
We provide an analysis of current evalua-tion methodologies applied to summariza-tion metrics and identify the following ar-eas of concern: (1) movement away from evaluation by correlation with human as-sessment; (2) omission of important com-ponents of human assessment from eval-uations, in addition to large numbers of metric variants; (3) absence of methods of significance testing improvements over a baseline. We outline an evaluation methodology that overcomes all such chal-lenges, providing the first method of sig-nificance testing suitable for evaluation of summarization metrics. Our evaluation re-veals for the first time which metric vari-ants significantly outperform others, op-timal metric variants distinct from cur-rent recommended best variants, as well as machine translation metric BLEU to
have performance on-par withROUGE for
the purpose of evaluation of summariza-tion systems. We subsequently replicate a recent large-scale evaluation that relied on, what we now know to be, suboptimal
ROUGEvariants revealing distinct
conclu-sions about the relative performance of state-of-the-art summarization systems.
1 Introduction
Automatic metrics of summarization evaluation have their origins in machine translation (MT), with ROUGE (Lin and Hovy, 2003), the first and
still most widely used automatic summarization metric, comprising an adaption of theBLEUscore
(Papineni et al., 2002). Automatic evaluation in
MT and summarization have much in common, as both involve the automatic comparison of system-generated texts with one or more human-system-generated reference texts, contrasting either system-output
translations or peer summaries with human
ref-erence translationsormodel summaries,
depend-ing on the task. In both MT and summarization evaluation, any newly proposed automatic metric must be assessed by the degree to which it pro-vides a good substitute of human assessment, and although there are obvious parallels between eval-uation ofsystemsin the two areas, when it comes to evaluation of metrics, summarization has di-verged considerably from methodologies applied to evaluation of metrics in MT.
Since the inception of BLEU, evaluation of
au-tomatic metrics in MT has been by correlation with human assessment. In contrast in summa-rization, over the years since the introduction of
ROUGE, summarization evaluation has seen a
va-riety of different methodologies applied to evalu-ation of its metrics. Evaluevalu-ation of summarizevalu-ation metrics has included, for example, the ability of a metric/significance test combination to distinguish between sets of human and system-generated sum-maries (Rankel et al., 2011), or by accuracy of conclusions drawn from metrics when combined with a particular significance test, Wilcoxon rank-sum (Owczarzak et al., 2012).
Besides moving away from well-established methods such as correlation with human judg-ment, previous summarization metric evaluations have been additionally limited by inclusion of only a small proportion of possible metrics and vari-ants. For example, although the most commonly used metric ROUGE has a very large number of
possible variants, it is common to include only a small range of those in evaluations. This has the
obvious disadvantage that superior variants may exist but remain unidentified due to their omission. Despite such limitations, however, subsequent evaluations of state-of-the-art summarization sys-tems operate under the assumption that recom-mended ROUGE variants are optimal and rely on
this assumption to draw conclusions about the rel-ative performance of systems (Hong et al., 2014). This forces us to raise some important questions. Firstly, to what degree was the divergence away from evaluation methodologies still applied to MT metrics today well-founded? For example, were the original methodology, by correlation with hu-man assessment, to be applied, would a distinct variant of ROUGE emerge as superior and
subse-quently lead to distinct system rankings? Sec-ondly, wereall variantsofROUGE to be included
in evaluations, would a variant originally omitted from the evaluation emerge as superior and lead to further differences in summarization system rank-ings? Furthermore, although methods of statistical significance testing are commonly applied to eval-uation of summarizationsystems, attempts to iden-tify significant differences in performance of met-ricsare extremely rare, and when they have been applied unfortunately have not used an appropriate test.
This motivates our review of past and current methodologies applied to the evaluation of sum-marization metrics. Since MT evaluation in gen-eral has its own imperfections, we do not at-tempt to indiscriminately impose all MT evalua-tion methodologies on summarizaevalua-tion, but specif-ically revisit evaluation methodologies applied to one particular area of summarization, evaluation of metrics. Correlations with human assessment reveal an extremely wide range in performance among variants, highlighting the importance of an optimal choice ofROUGE variant in system
eval-uations. Since distinct variants ofROUGEachieve
significantly stronger correlation with human as-sessment than previous recommended best vari-ants, we subsequently replicate a recent evaluation of state-of-the-art summarization systems reveal-ing distinct conclusions about the relative perfor-mance of systems. In addition, we include in the evaluation of metrics, an evaluation of BLEU for
the purpose of summarization evaluation, and con-trary to common belief, precision-based BLEU is
on-par with recall-basedROUGEfor evaluation of
summarization systems.
2 Related Work
WhenROUGE(Lin and Hovy, 2003) was first
pro-posed, the methodology applied to its evaluation, in one respect, was similar to that applied to met-rics in MT, as ROUGE variants were evaluated
by correlation with a form of human assessment. Where the evaluation methodology diverged from MT, however, was with respect to the precise rep-resentation of human assessment that was em-ployed. In MT evaluation of metrics, although experimentation has taken place with regards to methods of elicitation of assessments from human judges (Callison-Burch et al., 2008), human as-sessment is always aimed to encapsulate the over-all quality of translations. In contrast in summa-rization, metrics are evaluated by the degree to which metric scores correlate withhuman
cover-age scores for summaries, a recall-based
formu-lation of the number of peer summary units that a human assessor believed had the same meaning as model summaries. Substitution of overall qual-ity assessments with a recall-based manual metric, unfortunately has the potential to introduce bias into the evaluation of metrics in favor of recall-based formulations.
One dimension of summary quality omitted from human coverage scores is, for example, the order in which the units of a summary are ar-ranged within the summary. Despite unit order quite likely being something of importance to a human assessor, assessment of metrics by correla-tion with human coverage scores does not in any respect take into account the order in which the units of a summary appear, and evaluation by hu-man coverage scores alone means that a summary with its units scrambled or even reversed in the-ory receives precisely the same metric score as the original. Given current evaluation methodologies for assessment of metrics, a metric that scores two such summariesdifferently would be unfairly pe-nalized for it. Furthermore, when the linguistic
qualityof summaries has been assessed in parallel
with annotations used to compute human cover-age scores, it has been shown that the two dimen-sions of quality do not correlate with one another (no significant correlation) (Pitler et al., 2010), providing evidence that coverage scores alone do not fully represent human judgment of the overall quality of summaries.
fur-ther by evaluating metrics according to the abil-ity of a metric/significance test combination to identify a significant difference between the qual-ity of human and system-generated summaries (Rankel et al., 2011). Unfortunately, the evalua-tion of metrics with respect to how well they dis-tinguish between high-quality human summaries
andall system-generated summaries, does not
pro-vide insight into the task of metrics, to scorebetter
quality system-generated summaries higher than
worse quality system-generated summaries,
how-ever. This is in contrast to evaluation of MT met-rics by correlation with human judgment, where metrics onlyreceive credit for their ability to ap-propriately score system-output documents rela-tive to other system-output documents. Since dif-ferences in quality levels between pairs of system-generated summaries are likely to be far smaller than differences in system and human-generated summaries, the methodology unfortunately sets too low a bar for summarization metrics to meet.
Furthermore, the approach to metric evaluation unfortunately does not work in the long-term, as the performance of summarization systems im-proves and approaches or achieves the quality of a human, a metric that accurately identifies this achievement would be unfairly penalized for it. Separate from the evaluation of metrics, Rankel et al. (2011) make the highly important recommen-dation ofpairedtests for identification of signifi-cant differences in performance of summarization systems. Since data used in the evaluation of sum-marization systems is not independent, paired tests are more appropriate and more powerful.
Owczarzak et al. (2012) diverge further from correlation with human judgment for evaluation of metrics by assessing the accuracy of metrics to identify significant differences between pairs of systems when combined with a significance test. Although the approach to evaluation of metrics provides insight into the accuracy of conclusions drawn from metric/test combinations, the evalua-tion is limited by inclusion of only six variants of
ROUGE, fewer than 4% of possible ROUGE
vari-ants. Despite such limitations, however, subse-quent evaluations relied on recommendedROUGE
variants to rank state-of-the-art systems (Hong et al., 2014).
Although methods of identifying significant dif-ferences in performance are commonly applied to the evaluation of systems in summarization, the
application of significance tests to the evaluation of summarization metrics is extremely rare, and when attempts have been made, unfortunately ap-propriate tests have not been applied. Computa-tion of confidence intervals for individual correla-tion with human coverage scores, for example, un-fortunately does not provide insight into whether or not adifferencein correlation with human cov-erage scores is significant.
3 Summarization Metric Evaluation
When large-scale human evaluation of summa-rization systems takes place, human evaluation commonly takes the form of annotation of whether or not system-generated summary units express the meaning of model summary units, annotations subsequently used to compute human coverage
scores. In addition, an evaluation of the
linguis-tic qualityof summaries is commonly carried out.
As described in Section 2, when used for the eval-uation of metrics, linguistic quality is commonly omitted, however, with metrics only assessed by the degree to which they correlate with human coverage scores. In contrast, we include all avail-able human assessment data for evaluating met-rics.
3.1 Combining Quality and Coverage
In DUC-2004 (Over et al., 2007), human
annota-tions used to compute summarycoverageare car-ried out by identification of matching peer units (PUs), the units in a peer summary that express content of the corresponding model summary. In addition, an overall coverage estimate (E) is pro-vided by the human annotator, the proportion of the corresponding model summary or collective model units (MUs) expressed overall by a given peer summary. Human coverage scores (CS) are computed by combining Matching PUs with cov-erage estimates as follows:
CS = |Matching P Us|MUs| | ·E (1)
In addition to annotations used to compute human coverage scores, human assessors were asked to rate the linguistic quality of summaries under 7 different criteria, providing ratings fromA toE, with A denoting highest and E least quality rat-ing.
0 20 40 60 80 100
0
20
40
60
80
100
Coverage Score (%)
[image:4.595.313.508.82.260.2]Mean Ling. Quality (%)
Figure 1: Scatter-plot of mean linguistic qual-ity and coverage scores for human assessments of summaries in DUC-2004
for all human-assessed summaries from DUC
-2004, where, for the purpose of comparison, each of the 7 linguistic quality ratings are converted to a corresponding percentage quality (A= 100%; B= 75%; C= 50%; D= 25%; E= 0%). The lo-cation of all points almost exclusively within the upper left corner of the plot in Figure 1 indicates that the linguistic quality of almost all summaries reaches at least as high a level as its corresponding coverage score. This follows the intuition that a summary is unlikely to obtain high coverage with-out sufficient linguistic quality, while the same cannot be said for the converse, that a high level of linguistic quality necessarily leads to high cov-erage. More importantly, however, linguistic qual-ity scores provide an additional dimension of hu-man assessment, allowing greater discriminatory power between the quality of summaries than was possible with coverage scores alone.
Figure 2 includes linguistic quality and cover-age score distributions from DUC-2004 human
evaluation, where each distribution is skewed in opposing directions, in addition to the distribution of the average of the two scores for summaries.
For the purpose of metric evaluation, we com-bine human coverage and linguistic quality scores using the average of the two scores, and use this as a gold standard human score for evaluation of metrics:
Human Assessment Score= CS+MLQ2
0.0 0.2 0.4 0.6 0.8 1.0
0.0
0.5
1.0
1.5
2.0
2.5
3.0
Human Assessment
Density
Coverage (%) Quality (%) Mean
Figure 2: Combining linguistic quality and cover-age scores provided by human assessors in DUC
-2004
3.2 ROUGE
ROUGE includes a large number of distinct
vari-ants, including eight choices of n-gram counting method (ROUGE-1; 2; 3; 4; S4; SU4; W; L), binary
settings such as word-stemming of summaries and an option to remove or retain stop-words. Addi-tional configurations include the use of precision, recall or f-score to compute individual summary scores. Finally, options for computation of the overall score for a system is by computation of the mean or median of that system’s summary score distribution. In total, therefore, when employing
ROUGE for the evaluation of summarization
sys-tems, there are 192 (8 x 2 x 2 x 3 x 2) possible system-level variants to choose from.
The fact that final overall ROUGE scores for
systems are comprised of the mean or median of ROUGE scores of individual summaries, is,
again, a divergence from MT evaluation, as n-gram counts used to compute BLEU scores are
computed at the document as opposed to sentence-level. However, in this respect,ROUGEhas a
dis-tinct advantage overBLEU, as the fact thatROUGE
comprises the mean or median score of individ-ual summary scores makes possible the applica-tion of standard methods of significance testing differences in system-level ROUGE scores, while BLEU is restricted to the application of
[image:4.595.77.273.84.260.2]scores can be tested for statistical significance us-ing, for example, Wilcoxon signed-rank test, while paired t-test can be applied to difference of mean
ROUGEscores for systems.
3.3 Metric Evaluation by Pearson’sr
Moses (Koehn et al., 2007) multi-bleu1 was used
to compute BLEU (Papineni et al., 2002) scores
for summaries and prepare4rouge2applied to
sum-maries before running ROUGE (Lin and Hovy,
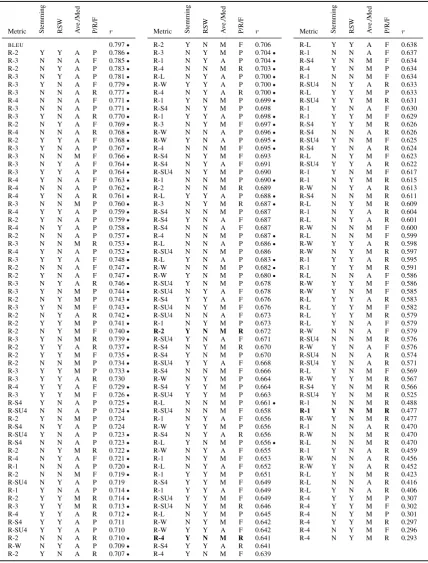
2003). Table 1 shows the Pearson correlation of each variant ofROUGEwith human assessment, in
addition toBLEU’s correlation with the same
hu-man assessment of summaries from DUC-2004.
Somewhat surprisingly,BLEUMT evaluation
met-ric achieves strongest correlation with human as-sessment overall, r = 0.797, with performance ofROUGE variants ranging fromr = 0.786, just
below that of BLEU, to as low as r = 0.293.
For many pairs of metrics, differences in correla-tion with human judgment are small, however, and prior to concluding superiority in performance of one metric over another, significance tests should be applied.
4 Metric Significance Testing
In MT, recent work has identified the suitabil-ity of Williams significance test (Williams, 1959) for evaluation of automatic MT metrics (Graham and Baldwin, 2014; Graham et al., 2015; Gra-ham, 2015), and, for similar reasons, Williams test is suited to significance testing differences in performance of competing summarization met-rics which we detail further below. Williams test has additionally been used in evaluation of sys-tems that automatically assess spoken and writ-ten language quality (Yannakoudakis et al., 2011; Yannakoudakis and Briscoe, 2012; Evanini et al., 2013).
Evaluation of a given summarization metric,
Mnew, by Pearson correlation takes the form of
quantifying the correlation, r(Mnew, H), that
ex-ists between metric scores for systems and corre-sponding human assessment scores, and contrast-ing this correlation with the correlation for some baseline metric,r(Mbase, H).
One approach to testing for significance that may seem reasonable is to apply a significance test
1https://github.com/moses-smt/mosesdecoder/ commits/master/scripts/generic/multi-bleu.perl
2http://kavita-ganesan.com/content/ prepare4rouge-script-prepare-rouge-evaluation
separately to the correlation of each metric with human assessment, with the hope that the new metric will achieve a significant correlation where the baseline metric does not. The reasoning here is flawed however: the fact that one correlation is significantly higher than zero (r(Mnew, H)) and
that of another is not, does not necessarily mean that thedifferencebetween the two correlations is significant. Instead, a specific test should be ap-plied to the difference in correlations. For this same reason, confidence intervals for individual correlations with human assessment are also not useful.
If samples that data are drawn from are inde-pendent, and differences in correlations are com-puted on independent data sets, the Fisher r toz
transformation is applied to test for significant dif-ferences in correlations. Data used for the eval-uation of summarization metrics are not indepen-dent, as evaluations comprise three sets of scores for precisely the same set of summaries (corre-sponding to variables X1, X2 and X3 below),
and subsequently three correlations:r(Mbase, H),
r(Mnew, H)andr(Mnew, Mbase). Ifr(Mbase, H)
and r(Mnew, H) are both > 0, then the third
correlation, between metric scores themselves,
r(Mbase, Mnew), must also be>0. The strength
of this correlation, directly between scores of pairs of summarization metrics, should be taken into account using a significance test of the dif-ference in correlation between r(Mbase, H) and
r(Mnew, H).
Williams test 3 (Williams, 1959) evaluates the
significance of a difference in dependent correla-tions (Steiger, 1980). It is formulated as follows as a test of whether the population correlation be-tween X1 and X3 equals the population
correla-tion betweenX2andX3:
t(n−3) = (r13−r23)
p
(n−1)(1 +r12) q
2K(n(n−−1)3) +(r23+r13)2
4 (1−r12)3
,
whererij is the correlation betweenXi andXj,n
is the size of the population, and:
K = 1−r122−r132−r232+ 2r12r13r23
Since the power of Williams test increases when the third correlation, r(Mbase, Mnew), between
metric scores is stronger, metrics should not be ranked by the number of competing metrics they
Metric Stemming RSW Ave./Med P/R/F r
BLEU 0.797•
R-2 Y Y A P 0.786• R-3 N N A F 0.785• R-2 N Y A P 0.783• R-3 N Y A P 0.781• R-3 Y N A F 0.779• R-3 N N A R 0.777• R-4 N N A F 0.771• R-3 N N A P 0.771• R-3 Y N A R 0.770• R-2 N Y A F 0.769• R-4 N N A R 0.768• R-2 Y Y A F 0.768• R-3 Y N A P 0.767• R-3 N N M F 0.766• R-3 N Y A F 0.764• R-3 Y Y A P 0.764• R-4 Y N A F 0.763• R-4 N N A P 0.762• R-4 Y N A R 0.761• R-3 N N M P 0.760• R-4 Y Y A P 0.759• R-2 Y N A P 0.759• R-4 N Y A P 0.758• R-2 N N A P 0.757• R-3 N N M R 0.753• R-4 Y N A P 0.752• R-3 Y Y A F 0.748• R-2 N N A F 0.747• R-2 Y N A F 0.747• R-3 N Y A R 0.746• R-3 Y N M P 0.744• R-2 N Y M P 0.743• R-3 Y N M F 0.743• R-2 N Y A R 0.742• R-2 Y Y M P 0.741• R-2 N Y M F 0.740• R-3 Y N M R 0.739• R-2 Y Y A R 0.737• R-2 Y Y M F 0.735• R-2 N N M P 0.734• R-3 Y Y M P 0.733• R-3 Y Y A R 0.730 R-4 Y Y A F 0.729• R-3 Y Y M F 0.726• R-S4 Y N A P 0.725• R-SU4 N N A P 0.724• R-2 Y N M P 0.724 R-S4 N Y A P 0.724 R-SU4 Y N A P 0.723• R-S4 N N A P 0.723• R-2 N Y M R 0.722• R-4 N Y A F 0.721• R-1 N N A P 0.720• R-2 N N M F 0.719• R-SU4 N Y A P 0.719 R-1 Y N A P 0.714• R-2 Y Y M R 0.714• R-3 Y Y M R 0.713• R-4 Y Y A R 0.712• R-S4 Y Y A P 0.711 R-SU4 Y Y A P 0.710 R-2 N N A R 0.710• R-W N Y A P 0.709• R-2 Y N A R 0.707•
Metric Stemming RSW Ave./Med P/R/F r R-2 Y N M F 0.706 R-3 N Y M P 0.704• R-1 N Y A P 0.704• R-4 N N M R 0.703• R-L N Y A P 0.700• R-W Y Y A P 0.700• R-4 N Y A R 0.700• R-1 Y N M P 0.699• R-S4 N Y M P 0.698 R-1 Y Y A P 0.698• R-3 N Y M F 0.697• R-W N N A P 0.696• R-W Y N A P 0.695• R-4 N N M F 0.695• R-S4 N Y M F 0.693 R-S4 N Y A F 0.691 R-SU4 N Y M P 0.690 R-1 N N M P 0.690• R-2 N N M R 0.689 R-L Y Y A P 0.688• R-3 N Y M R 0.687• R-S4 N N M P 0.687 R-S4 Y N A F 0.687 R-S4 N N A F 0.687 R-4 N N M P 0.687• R-L N N A P 0.686• R-SU4 N N M P 0.686 R-L Y N A P 0.683• R-W N N M P 0.682• R-W Y N M P 0.680• R-SU4 Y N M P 0.678 R-SU4 N Y A F 0.678 R-S4 Y Y A F 0.676 R-SU4 N Y M F 0.676 R-SU4 N N A F 0.673 R-1 N Y M P 0.673
R-2 Y N M R 0.672 R-SU4 Y N A F 0.671 R-S4 N Y M R 0.670 R-S4 Y N M P 0.670 R-SU4 Y Y A F 0.668 R-S4 N N M F 0.666 R-W N Y M P 0.664 R-S4 Y Y M P 0.664 R-SU4 Y Y M P 0.663 R-L N N M P 0.661• R-SU4 N N M F 0.658 R-1 N Y A F 0.656 R-W Y Y M P 0.656 R-S4 N Y A R 0.656 R-L Y N M P 0.656• R-W N Y A F 0.655 R-1 N Y M F 0.653 R-L N Y A F 0.652 R-1 Y Y M P 0.651 R-S4 Y Y M F 0.649 R-1 Y Y A F 0.649 R-SU4 Y Y M F 0.649 R-SU4 N Y M R 0.646 R-L N Y M P 0.645 R-W N Y M F 0.642 R-W Y Y A F 0.642
R-4 Y N M R 0.641 R-S4 Y Y A R 0.641 R-4 Y N M F 0.639
Metric Stemming RSW Ave./Med P/R/F r R-L Y Y A F 0.638 R-1 N N A F 0.637 R-S4 Y N M F 0.634 R-4 Y N M P 0.634 R-1 N N M F 0.634 R-SU4 N Y A R 0.633 R-L Y Y M P 0.633 R-SU4 Y Y M R 0.631 R-1 Y N A F 0.630 R-1 Y Y M F 0.629 R-S4 Y Y M R 0.626 R-S4 N N A R 0.626 R-SU4 Y N M F 0.625 R-S4 Y N A R 0.624 R-L N Y M F 0.623 R-SU4 Y Y A R 0.622 R-1 Y N M F 0.617 R-1 N Y M R 0.615 R-W N Y A R 0.613 R-S4 N N M R 0.611 R-L N Y M R 0.609 R-1 N Y A R 0.604 R-L N Y A R 0.601 R-W N N M F 0.600 R-L N N M F 0.599 R-W Y Y A R 0.598 R-W N Y M R 0.597 R-1 Y Y A R 0.595 R-1 Y Y M R 0.591 R-L N N A F 0.586 R-W Y Y M F 0.586 R-W Y N M F 0.585 R-L Y Y A R 0.583 R-L Y Y M F 0.582 R-L Y Y M R 0.579 R-L Y N A F 0.579 R-W N N A F 0.579 R-SU4 N N M R 0.576 R-W Y N A F 0.576 R-SU4 N N A R 0.574 R-SU4 Y N A R 0.571 R-L Y N M F 0.569 R-W Y Y M R 0.567 R-S4 Y N M R 0.566 R-SU4 Y N M R 0.525 R-1 N N M R 0.488
[image:6.595.85.514.78.642.2]R-1 Y N M R 0.477 R-W Y N M R 0.477 R-1 N N A R 0.470 R-W N N M R 0.470 R-L N N M R 0.470 R-1 Y N A R 0.459 R-W N N A R 0.456 R-W Y N A R 0.452 R-L Y N M R 0.423 R-L N N A R 0.416 R-L Y N A R 0.406 R-4 Y Y M P 0.307 R-4 Y Y M F 0.302 R-4 N Y M P 0.301 R-4 Y Y M R 0.297 R-4 N Y M F 0.296 R-4 N Y M R 0.293
Table 1: Pearson correlation (r) of BLEU and 192 variants ofROUGE (R-*) with human assessment in
DUC-2004, with (Y) and without (N) stemming, with (Y) and without (N) removal of stop words (RSW),
outperform, as a metric that happens to correlate strongly with a higher number of competing met-rics in a given competition would be at an un-fair advantage. This increased power also means, somewhat counter-intuitively, it can happen for a pair of competing metrics for which the correla-tion between metric scores is strong, that a small difference in competing correlations with human assessment is significant, while, for a different pair of metrics with a larger difference in corre-lation, the difference is not significant, because
r(Mbase, Mnew) is weak. For example, in
Ta-ble 1 the difference in correlation with human as-sessment of BLEU and that of median ROUGE-L
precision with stemming and stop-words retained, 0.141 (0.797 − 0.656), is not significant, while the smaller difference in correlation with human assessment between correlations ofBLEU and
av-erage ROUGE-3 recall with stemming and
stop-words removed, 0.067 (0.797 − 0.73) is signifi-cant, since scores of the latter pair of metrics cor-relate with one another with more strength.
As part of this research, we have made avail-able an open-source implementation of statistical tests for evaluation of summarization metrics, at
https://github.com/ygraham/nlp-williams.
4.1 Significance Test Results
In Table 1,•identifies variants ofROUGEnot
sig-nificantly outperformed by any other variant. Fig-ure 3 shows pairwise Williams significance test outcomes for BLEU, the top ten ROUGE variants,
as well as current recommended ROUGE variants
(Owczarzak et al. (2012)) used to compare sys-tems in Hong et al. (2014). Current recommended best variants of ROUGE are shown to be
signifi-cantly outperformedby several otherROUGE
vari-ants.
Although BLEU achieves strongest correlation
with human assessment overall, Figure 3 reveals the difference between BLEU’s correlation with
human assessment and that of the best-performing
ROUGE variant asnot statistically significant, and
since ROUGE holds the distinct advantage over BLEU of facilitating standard methods of
signif-icance testing differences in scores for systems, for this reason alone we recommend the use of the best-performing ROUGEvariant over BLEU,
aver-ageROUGE-2 precision with stemming and
stop-words removed.
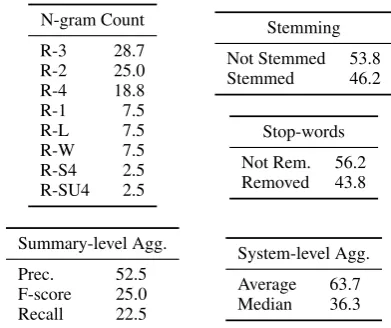
Table 2 shows proportions of optimal ROUGE
BLEU
R2_ST1_RS1_A_P
R3_ST0_RSW0_A_F R2_ST0_RS1_A_P R3_ST0_RS1_A_P R3_ST1_RS0_A_F R3_ST0_RS0_A_R R4_ST0_RS0_A_F R3_ST0_RS0_A_P R4_ST1_RS0_M_R R2_ST1_RS0_M_R R1_ST1_RS0_M_R
[image:7.595.332.497.61.259.2]R1_ST1_RS0_M_R R2_ST1_RS0_M_R R4_ST1_RS0_M_R R3_ST0_RS0_A_P R4_ST0_RS0_A_F R3_ST0_RS0_A_R R3_ST1_RS0_A_F R3_ST0_RS1_A_P R2_ST0_RS1_A_P R3_ST0_RS0_A_F R2_ST1_RS1_A_P BLEU
Figure 3: Pairwise significance test outcomes for
BLEU, best-performing ROUGE (rows 2-9), and ROUGE applied in Hong et al. (2014) (bottom 3
rows), with (ST1) and without (ST0) stemming, with (RS1) and without (RS0) removal of stop words, for average (A) or median (M)ROUGE
pre-cision (P), recall (R) or f-score (F), colored cells denote significant win for row imetric over col-umnjmetric with Williams test.
variants that can be attributed to each ofROUGE’s
configuration options. Contrary to prior belief, the vast majority of optimal ROUGE variants are
precision-based, showing that the assumption that recall-based metrics are superior for evaluation of summarization systems to be inaccurate, and a likely presence of bias in favor of recall-based metrics in evaluations by correlation with human coverage scores alone. Furthermore, since there exists a vast number of possible formulations that could potentially be applied to evaluation of sum-maries that are neither purely precision nor recall-based, evaluation methodologies should avoid liance on assumptions that either precision or re-call is superior and instead base conclusions on empirical evidence where possible.
5 Summarization System Evaluation
Since we have established that the variants of
ROUGE used to rank state-of-the-art and baseline
summarization systems in Hong et al. (2014) have significantly weaker correlations with human as-sessment than several otherROUGE variants, this
N-gram Count R-3 28.7 R-2 25.0 R-4 18.8
R-1 7.5
R-L 7.5
R-W 7.5
R-S4 2.5 R-SU4 2.5
Stemming Not Stemmed 53.8 Stemmed 46.2
Stop-words Not Rem. 56.2 Removed 43.8
Summary-level Agg. Prec. 52.5 F-score 25.0 Recall 22.5
[image:8.595.75.271.61.225.2]System-level Agg. Average 63.7 Median 36.3
Table 2: Proportions of optimal ROUGE variants
attributed to each ROUGE configuration option
(%).
ROUGE ROUGE System Best Original
DPP 8.498 9.62
ICSISumm 8.317 9.78
RegSum 8.187 9.75
Submodular 8.047 9.35 CLASSY11 7.717 9.20 CLASSY04 7.690 8.96 OCCAMS V 7.643 9.76 GreedyKL 6.918 8.53
FreqSum 6.838 8.11
TsSum 6.671 8.15
Centroid 6.660 7.97
LexRank 6.655 7.47
Table 3: Summarization systems originally in-cluded in Hong et al. (2014) evaluated with the best-performing ROUGE variant (Best): average ROUGE-2 precision with stemming and stop words
removed; and evaluated with original suboptimal variant (median ROUGE-2 recall with stemming
and without removal of stop-words)
achieves strongest correlation with human assess-ment, averageROUGE-2 precision with stemming
and stop-words removed.
Table 3 showsROUGEscores for summarization
systems originally presented in Hong et al. (2014). System rankings diverge considerably from those of the original evaluation. Notably, the system now taking first place had originally ranked in fourth position.
Since the best variant ofROUGEis based on
av-erageROUGEscores as opposed to medianROUGE
scores, a difference of means significance test is appropriate provided the normality assumption of score distributions for systems is not violated. In
DPP
ICSISumm RegSum
Submodular CLASSY11 CLASSY04 OCCAMS_V GreedyKL FreqSum
TsSum
Centroid Le
xRank
[image:8.595.313.484.63.263.2]LexRank Centroid TsSum FreqSum GreedyKL OCCAMS_V CLASSY04 CLASSY11 Submodular RegSum ICSISumm DPP
Figure 4: Summarization system pairwise signif-icance test outcomes (paired t-test) for state-of-the-art (top 7 rows) and baseline systems (bot-tom 5 rows) of Hong et al. (2014) evaluated with best-performingROUGEvariant: averageROUGE
-2 precision with stemming and stop words re-moved, colored cells denote a significant greater mean score for rowi system over column j sys-tem according to paired t-test.
addition, since data used to evaluate systems are not independent, paired tests are also appropri-ate (Rankel et al., 2011). ROUGE score
[image:8.595.112.250.292.443.2]distri-butions for systems were tested for normality us-ing the Shapiro-Wilk test (Royston, 1982) where score distributions for none of the included sys-tems were shown to be significantly non-normal.
Figure 4 shows outcomes of paired t-tests for summary score distributions of each pair of sys-tems, revealing three summarization systems not significantly outperformed by any other as DPP,
ICSISUMM and REGSUM. In addition, as
ex-pected, all state-of-the-art systems significantly outperform all baseline systems.
6 Human Assessment Combinations
rep-Metric Stem. RSW Ave/Med P/R/F Mean GeometricMean HarmonicMean CoverageOnly Ling. Qual.Only
BLEU 0.797• 0.901• 0.936• 0.944• 0.642•
ROUGE-2 Y Y A P 0.786• 0.870• 0.887• 0.878 0.660•
ROUGE-3 N N A F 0.785• 0.869• 0.893 0.894 0.650•
ROUGE-2 N Y A P 0.783• 0.868• 0.885• 0.876 0.658•
ROUGE-3 N Y A P 0.781• 0.836• 0.840 0.826 0.682•
ROUGE-3 Y N A F 0.779• 0.866• 0.891 0.893 0.643•
ROUGE-3 N N A R 0.777• 0.871• 0.901 0.907 0.632•
ROUGE-4 N N A F 0.771• 0.843• 0.863 0.866 0.645•
ROUGE-3 N N A P 0.771• 0.837• 0.849 0.843 0.658•
ROUGE-3 Y N A R 0.770• 0.867• 0.899 0.905 0.624•
ROUGE-2 N Y A F 0.769• 0.877• 0.909• 0.910• 0.619•
ROUGE-2 Y Y A F 0.768• 0.875• 0.908• 0.908• 0.618•
ROUGE-3 Y N A P 0.767• 0.835• 0.849 0.843 0.652•
ROUGE-3 Y Y A P 0.764• 0.825• 0.832 0.821 0.660•
ROUGE-4 N N A P 0.762• 0.815• 0.824 0.819 0.657•
ROUGE-4 Y Y A P 0.759• 0.794 0.790 0.774 0.678•
ROUGE-4 N Y A P 0.758• 0.793 0.789 0.772 0.678•
ROUGE-4 Y N A P 0.752• 0.809 0.819 0.815 0.646•
ROUGE-2 N N A F 0.747• 0.867• 0.907• 0.910• 0.587•
ROUGE-2 Y N A F 0.747• 0.868• 0.908• 0.912• 0.586•
ROUGE-2 N Y A R 0.742• 0.862• 0.904• 0.912• 0.578•
ROUGE-2 N Y M F 0.740• 0.855• 0.894• 0.898• 0.584•
ROUGE-2 Y Y A R 0.737• 0.858• 0.900• 0.908• 0.575•
ROUGE-2 N Y M R 0.722• 0.848• 0.895• 0.905• 0.553•
[image:9.595.85.511.63.295.2]ROUGE-2 N N M R 0.689 0.828 0.884• 0.901• 0.508
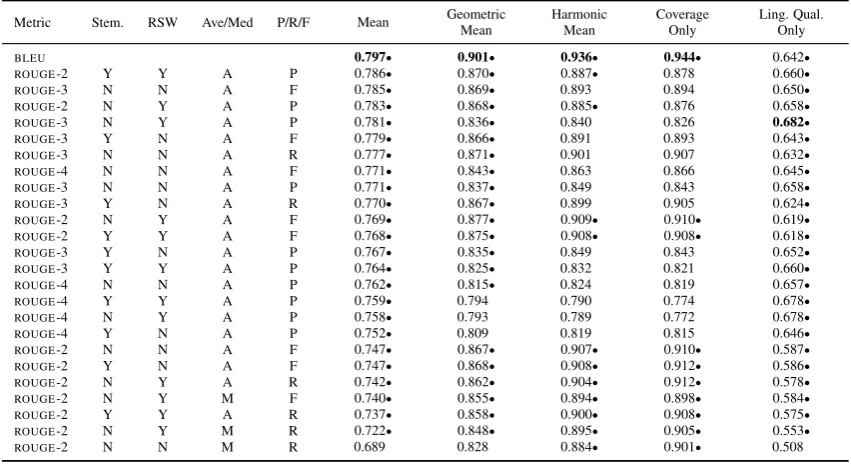
Table 4: Correlation of top-ten metric variants for each alternate combination of linguistic quality and coverage, •denotes a metric not significantly outperformed by any other under that particular human
evaluation combination, highest correlations highlighted in bold font.
resents an overall human assessment for a given summary. One possibility would be to search for optimal weights for combining quality and cover-age, but there is a risk with this approach that we will not find the most representative combination but simply the combination that best describes the metrics.
An additional variation of human assessment scores is by combining coverage and quality with a variant of the arithmetic mean, such as the har-monic or geometric mean. Table 4 shows correla-tions ofBLEUand the top ten performing variants
of ROUGE when evaluated against the arithmetic
(mean), harmonic and geometric mean of quality and coverage scores for summaries. In addition, Table 4 includes correlations of metric scores with coverage alone, as well as linguistic quality scores alone to provide additional insight, although lin-guistic quality scores alone do not provide a suffi-cient evaluation of metrics – since it is possible to generate summaries with perfect linguistic quality without inclusion of any relevant content whatso-ever.
BLEU MT metric achieves highest correlation
across all human evaluation combinations and highest again when evaluated against human cov-erage scores alone, and BLEU’s brevity penalty,
that like recall penalizes a system for too short out-put, is a probable cause of the metric
overcom-ing the recall-based bias of an evaluation based on coverage scores alone. In addition, our rec-ommended variant, ave. ROUGE-2 prec. with
stemming and stop words removed is not signif-icantly outperformed by BLEU or any other
vari-ant ofROUGEfor any of the three combined mean
human assessment scores.
7 Conclusions
An analysis of evaluation of summarization met-rics was provided with an evaluation ofBLEUand
192 variants ofROUGE. Detail of the first suitable
summarization metric significance test, Williams test, was provided. Results reveal superior vari-ants of metrics distinct from previously best rec-ommendations. Replication of a recent evalua-tion of state-of-the-art summarizaevalua-tion systems also revealed contrasting conclusions about the rela-tive performance of systems. In addition, BLEU
achieves strongest correlation with human assess-ment overall, but does not significantly outperform the best-performingROUGEvariant.
Acknowledgements
References
Chris Callison-Burch, Cameron Fordyce, Philipp Koehn, Christof Monz, and Josh Schroeder. 2008. Further meta-evaluation of machine translation. In Proc. 3rd Wkshp. Statistical Machine Translation, pages 70–106, Columbus, Ohio. Association for Computational Linguistics.
Keelan Evanini, Shasha Xie, and Klaus Zechner. 2013. Prompt-based content scoring for automated spoken language assessment. In Proc. 2013 Conf. North American Chapter of the Association for Computa-tional Linguistics: Human Language Technologies, pages 157–162, Atlanta, GA. Association for Com-putational Linguistics.
Yvette Graham and Timothy Baldwin. 2014. Testing for significance of increased correlation with human judgment. InProc. 2014 Conf. Empirical Methods in Natural Language Processing, pages 172–176, Doha, Qatar. Association for Computational Lin-guistics.
Yvette Graham, Nitika Mathur, and Timothy Baldwin. 2014. Randomized significance tests in machine translation. InProc. 9th Wkshp. Statistical Machine Translation, pages 266–274, Baltimore, MD. Asso-ciation for Computational Linguistics.
Yvette Graham, Nitika Mathur, and Timothy Baldwin. 2015. Accurate evaluation of segment-level ma-chine translation metrics. InProc. 2015 Conf. North American Chapter of the Association for Compu-tational Linguistics - Human Language Technolo-gies, pages 1183–1191, Denver, CO. Association for Computational Linguistics.
Yvette Graham. 2015. Improving evaluation of ma-chine translation quality estimation. InProc. Fifty-Third Annual Meeting of the Association for Com-putational Linguistics, pages 1804–1813, Beijing, China. Association for Computational Linguistics. Kai Hong, John M Conroy, Benoit Favre, Alex
Kulesza, Hui Lin, and Ani Nenkova. 2014. A repos-itory of state of the art and competitive baseline sum-maries for generic news summarization. InProc. 9th edition of the Language Resources and Evaluation Conference, pages 1608–1616, Reykjavik, Iceland. Philipp Koehn, Hieu Hoang, Alexandra Birch, Chris
Callison-Burch, Marcello Federico, Nicola Bertoldi, Brooke Cowan, Wade Shen, Christine Moran, Richard Zens, Chris Dyer, Ondrej Bojar, Alexan-dra Constantin, and Evan Herbst. 2007. Moses: Open source toolkit for statistical machine transla-tion. InProc. 45th Annual Meeting of the Associa-tion for ComputaAssocia-tional Linguistics, pages 177–180, Prague, Czech Republic. Association for Computa-tional Linguistics.
Philipp Koehn. 2004. Statistical significance tests for machine translation evaluation. InProc. 2004 Conf. Empirical Methods in Natural Language Process-ing, pages 388–395, Barcelona, Spain. Association for Computational Linguistics.
Chin-Yew Lin and Eduard Hovy. 2003. Auto-matic evaluation of summaries using n-gram co-occurrence statistics. In Proc. 2003 Conf. North American Chapter of the Association for Compu-tational Linguistics on Human Language Technol-ogy, pages 71–78, Edmonton, Canada. Association for Computational Linguistics.
Paul Over, Hoa Dang, and Donna Harman. 2007. Duc in context. Information Processing & Management, 43(6):1506–1520.
Karolina Owczarzak, John M. Conroy, Hoa Trang Dang, and Ani Nenkova. 2012. An assessment of the accuracy of automatic evaluation in summariza-tion. In Proc. Wkshp. on Evaluation Metrics and System Comparison for Automatic Summarization, pages 1–9, Quebec, Canada. Association for Com-putational Linguistics.
Kishore Papineni, Salim Roukos, Todd Ward, and Wei-Jing Zhu. 2002. BLEU: A method for automatic
evaluation of machine translation. InProc. 40th An-nual Meeting of the Association for Computational Linguistics, pages 311–318, Philadelphia, PA. Asso-ciation for Computational Linguistics.
Emily Pitler, Annie Louis, and Ani Nenkova. 2010. Automatic evaluation of linguistic quality in multi-document summarization. In Proc. 48th Annual Meeting of the Association for Computational Lin-guistics, pages 544–554, Uppsala, Sweden. Associ-ation for ComputAssoci-ational Linguistics.
Peter Rankel, John M. Conroy, Eric V. Slud, and Di-anne P. O’Leary. 2011. Ranking human and ma-chine summarization systems. InProc. 2011 Conf. Empirical Methods in Natural Language Process-ing, pages 467–473, Edinburgh, Scotland. Associ-ation for ComputAssoci-ational Linguistics.
Patrick Royston. 1982. Algorithm as 181: The W test for normality. Applied Statistics, 31:176–180. James H. Steiger. 1980. Tests for comparing
ele-ments of a correlation matrix. Psychological Bul-letin, 87(2):245–251.
Evan J. Williams. 1959. Regression analysis, vol-ume 14. Wiley New York.
Helen Yannakoudakis and Ted Briscoe. 2012. Model-ing coherence in ESOL learner texts. InProc. Sev-enth Wkshp. on Building Educational Applications Using NLP, pages 33–43, Montreal, Canada. Asso-ciation for Computational Linguistics.