Learning Methods for Combining Linguistic Indicators
to Classify Verbs
Eric V. Siegel
D e p a r t m e n t o f C o m p u t e r S c i e n c e C o l u m b i a U n i v e r s i t y N e w Y o r k , N Y 10027 e v s @ c s . c o l u m b i a . e d u
A b s t r a c t
Fourteen linguistically-motivated numeri- cal indicators are evaluated for their abil- ity to categorize verbs as either states or events. T h e values for each indicator are computed automatically across a corpus of text. To improve classification perfor- mance, machine learning techniques are employed to combine multiple indicators. Three machine learning methods are com- pared for this task: decision tree induction, a genetic algorithm, and log-linear regres- sion.
1
I n t r o d u c t i o n
The ability to distinguish states, e.g., "Mark seems happy," from events, e.g., "Rende ran down the street," is a necessary prerequisite for interpreting certain adverbial adjuncts, as well as identifying temporal constraints between sentences in a dis- course (Moens and Steedman, 1988; Doff, 1992; Kla- vans, 1994). Furthermore, stativity is the first of three fundamental temporal distinctions that com- pose the aspectual class of a clause. Aspectual clas- sification is a necessary component for a system that analyzes temporal constraints, or performs lex- ical choice and tense selection in machine transla- tion (Moens and Steedman, 1988; Passonneau, 1988; Doff, 1992; Klavans, 1994).
Researchers have used empirical analysis of cor- pora to develop linguistically-based numerical indi- cators that aid in aspectual classification (Klavans and Chodorow, 1992; Siegel and McKeown, 1996). Specifically, this technique takes advantage of lin- guistic constraints t h a t pertain to aspect, e.g., only clauses that describe an event can appear in the pro- gressive. Therefore, a verb that appears more fre- quently in the progressive is more likely to describe an event.
In this paper, we evaluate fourteen quantitative linguistic indicators for their ability to classify verbs according to stativity. The values of these indicators are computed automatically across a corpus of text.
Classification performance is then measured over an unrestricted set of verbs. Our analysis reveals a pre- dictive value for several indicators t h a t have not tra- ditionally been linked to stativity in the linguistics literature. Then, in order to improve classification performance, we apply machine learning methods to combine multiple indicators. Three machine learn- ing techniques are compared for this task: decision tree induction, a genetic algorithm, and log-linear regression.
In the following sections, we further detail and motivate the distinction between states and events. Next, we describe our approach, detailing the set of linguistic indicators, the corpus and tools used, and the machine learning methods. Finally, we present experimental results and discuss conclusions and fu- ture work.
2 S t a t i v e a n d E v e n t V e r b s
Stativity must be identified to detect temporal con- straints between clauses attached with when. For ex- ample, in interpreting, "She had good strength w h e n
objectively tested, ,1 the have-state began before or at the beginning of the test-event, and ended after or at the end of the test-event. However, in inter- preting, "Phototherapy was discontinued w h e n the bilirubin came down to 13," the discontinue-event began at the end of the come-event. As another ex- ample, the simple present reading of an event, e.g., "He jogs," denotes the habitual reading, i.e., "every day," whereas the simple present reading of a state, e.g., "He appears healthy," implies "at the moment." Identifying stativity is the first step toward aspec- tually classifying a clause. Events are further distin- guished by two additional features: 1) telic events have an explicit culminating point in time, while non-telic events do not, and 2) extended events have a time duration, while atomic events do not. De- tecting the telicity and atomicity of a clause is neces- sary to identify temporal constraints between clauses and to interpret certain adverbial adjuncts (Moens
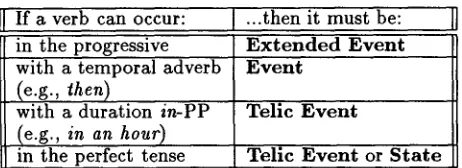
If a verb can occur: ...then it must be: in the progressive E x t e n d e d E v e n t with a temporal adverb
(e.g.,
then)
with a duration in-PP (e.g., in an hour) in the perfect tense
E v e n t
T e l i c E v e n t
T e l i c E v e n t or S t a t e
Table 1: Example linguistic constraints excerpted from Klavans (1994).
and Steedman, 1988; Passonneau, 1988; Dorr, 1992; Klavans, 1994). However, since these features apply only to events and not to states, a clause first must be classified according to stativity.
Certain features of a clause, such as adjuncts and tense, are constrained by and contribute to the as- pectual class of the clause (Vendler, 1967; Dowty, 1979; Pustejovsky, 1991; Passonneau, 1988; Klavans, 1994). Examples of such constraints are listed in Table 1. Each entry in this table describes a syn- tactic aspectual marker and the constraints on the aspectual class of any clause that appears with that marker. For example, a telic event can be modified by a duration in-PP, as in "You found us there i n t e n m i n u t e s , " b u t a state cannot, e.g., "*You loved him i n t e n m i n u t e s . "
In general, the presence of these linguistic markers in a particular clause indicates a constraint on the aspectual class of the clause, but the absence thereof does not place any constraint. This makes it difficult for a system to aspectually classify a clause based on the presence or absence of a marker. Therefore, these linguistic constraints are best exploited by a system that measures their frequencies across verbs. Klavans and Chodorow (1992) pioneered the ap- plication of statistical corpus analysis to aspectual classification by placing verbs on a "stativity scale" according to the frequency with which they occur in the progressive. This way, verbs are automati- cally ranked according to their propensity towards stativity. We have previously applied this princi- ple towards distinguishing relic events from non-telic events (Siegel and McKeown, 1996). Classification performance was increased by combining multiple aspectual markers with a genetic algorithm.
3
A p p r o a c h
Our goal is to exploit linguistic constraints such as those listed in Table 1 by counting their frequencies in a corpus. For example, it is likely that event verbs will occur more frequently in the progressive than state verbs, since the progressive is constrained to occur with event verbs. Therefore, the frequency with which a verb occurs in the progressive indicates whether it is an event or stative verb.
We have evaluated 14 such linguistic indicators over clauses selected uniformly from a text corpus. In this way, we are measuring classification perfor- mance over an unrestricted set of verbs. First, the ability for each indicator to individually distinguish between stative and event verbs is evaluated. Then, in order in increase classification performance, ma- chine learning techniques are employed to combine multiple indicators.
In this section, we first describe the set of lin- guistic indicators used to discriminate events and states. Then, we show how machine learning is used to combine multiple indicators to improve classifica- tion performance. Three learning methods are com- pared for this task. Finally, we describe the corpus and evaluation set used for these experiments.
3.1 L i n g u i s t i c I n d i c a t o r s
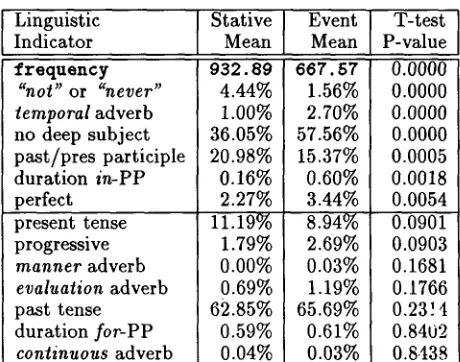
The first column of Table 2 lists the 14 linguistic in- dicators evaluated in this paper for classifying verbs. The second and third columns show the average value for each indicator over stative and event verbs, respectively, as computed over a corpus of parsed clauses, described below in Section 3.3. These val- ues, as well as the third column, are further detailed in Section 4.
Each verb has a unique value for each indicator. The first indicator, f r e q u e n c y , is simply the the fre- quency with which each verb occurs. As shown in Table 2, stative verbs occur more frequently than event verbs in our corpus.
The remaining 13 indicators measure how fre- quently each verb occurs in a clause with the lin- guistic marker indicated. This list includes the four markers listed in Table 1, as well as 9 additional markers that have not previously been linked to sta- tivity. For example, the next three indicators listed in Table 2 measure the frequency with which verbs 1) are modified by not or never, 2) are modified by a temporal adverb such as then or frequently, and 3) have no deep subject (passivized phrases often have no deep subject, e.g., "She was admitted to the hospital"). As shown, stative verbs are modified by not or never more frequently than event verbs, but event verbs are modified by temporal adverbs more frequently than stative verbs. For further detail re- garding the set of 14 indicators, see Siegel (1997).
[image:2.612.57.288.79.163.2]"nOt" o r Verb class :freq "never" show state 2 , 1 3 1 1 . 5 5 %
admit event 1 , 8 9 5 0.05%
discharge event 1 , 6 0 8 0.50%
feel state 1 , 1 7 7 4.61%
temporal no deep adverb subject
0.52% 1.11% 1.87% 1.20%
18.07% 91.13% 96.64% 52.52%
Table 3: Example verbs and their indicator values.
Linguistic Stative Event T-test
Indicator Mean Mean P-value
:frequency
"not" or "never" temporal adverb no deep subject past/pres participle duration in-PP
perfect present tense progressive
manner adverb
evaluation adverb past tense duration for-PP continuous adverb
9 3 2 . 8 9 4.44% 1.00% 36.05% 20.98% 0.16% 2.27% 11.19% 1.79% 0.00% 0.69% 62.85% 0.59% 0.04%
6 6 7 . 5 7 1.56% 2.70% 57.56% 15.37% O.60% 3.44% 8.94% 2.69% 0.03% 1.19% 65.69% 0.61% 0.03%
0.0000 0.0000 0.0000 0.0000 0.0005 0.0018 0.0054 0.0901 0.0903 0.1681 0.1766 0.23]4 0.8402 0.8.i38
Table 2: Indicators discriminate between two classes.
3.2 C o m b i n i n g I n d i c a t o r s w i t h L e a r n i n g
Given a verb and its 14 indicator values, our goal is to use all 14 values in combination to classify the verb as a state or an event. Once a function for com- bining indicator values has been established, previ- ously unobserved verbs can be automatically classi- fied according to their indicator values. This section describes three machine learning methods employed to this end.
L o g - l i n e a r r e g r e s s i o n . As suggested by Klavans and Chodorow (1992), a weighted sum of multi- ple indicators that results in one "overall" indica- tor may provide an increase in classification perfor- mance. This method embodies the intuition that each indicator correlates with the probability that a verb describes an event or state, but that each indicator has its own unique scale, and so must be weighted accordingly. One way to determine these weights is log-linear regression (Santner and Duffy, 1989), a popular technique for binary classification. This technique, which is more extensive than a sim- ple weighted sum, applies an inverse logit function, and employs the iterative reweighted least squares algorithm (Baker and Nelder, 1989).
G e n e t i c p r o g r a m m i n g . An alternative to avoid the limitations of a linear combination is to gener-
ate a non-linear function tree that combines multiple indicators. A popular method for generating such function trees is a genetic algorithm (Holland, 1975; Goldberg, 1989). The use of genetic algorithms to generate function trees (Cramer, 1985; Koza, 1992) is frequently called genetic programming. The func- tion trees are generated from a set of 17 primi- tives: the binary functions ADD, MULTIPLY and DIVIDE, and 14 terminals corresponding to the 14 indicators listed in Table 2. This set of primitives was established empirically; conditional functions, subtraction, and random constants failed to change performance significantly. The polarities for several indicators were reversed according to the polarities of the weights established by log-linear regression. Because the genetic algorithm is stochastic, each run may produce a different function tree. Runs of the genetic algorithm have a population size of 500, and end after 50,000 new individuals have been evalu- ated.
A threshold must be selected for both linear and function tree combinations of indicators. This way, overall outputs can be discriminated such that classi- fication performance is maximized. For both meth- ods, this threshold is established over the training set and frozen for evaluation over the test set. Decision t r e e s . Another method capable of mod- eling non-linear relationships between indicators is a decision tree. Each internal node of a decision tree is a choice point, dividing an individual indicator into ranges of possible values. Each leaf node is labeled with a classification (state or event). Given the set of indicator values corresponding to a verb, that verb's class is established by deterministically traversing the tree from the root to a leaf. The most popular method of decision tree induction, employed here, is recursive partitioning (Quinlan, 1986; Breiman et al., 1984), which expands the tree from top to bot- tom. The Splus statistical package was used for the induction process, with parameters set to their de- fault values.
[image:3.612.187.453.73.146.2] [image:3.612.85.315.191.372.2]n States Events
be 23,409 100.0% 0.0%
have 7,882 69.9% 30.1%
all other verbs 66,682 16.2% 83.8%
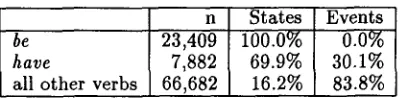
Table 4: Breakdown of verb occurrences.
and for the automatic identification of semantically related groups of words (Pereira, Tishby, and Lee, 1993; Hatzivassiloglou and McKeown, 1993). For more detail on the machine learning experiments de- scribed here, see Siegel (1997).
3.3 A P a r s e d C o r p u s
The automatic identification of individual con- stituents within a clause is necessary to compute the values of the linguistic indicators in Table 2. The English Slot G r a m m a r (ESG) (McCord, 1990) has previously been used on corpora to accumulate as- pectual d a t a (Klavans and Chodorow, 1992). ESG is particularly attractive for this task since its out- put describes a clause's deep roles, detecting, for ex- ample, the deep subject and object of a passiviz~d phrase.
Our experiments are performed across a 1,159,891 word corpus of medical discharge summaries from which 97,973 clauses were parsed fully by ESG, with no self-diagnostic errors (ESG produced error mes- sages on some of this corpus' complex sentences). The values of each indicator in Table 2 are com- puted, for each verb, across these 97,973 clauses.
In this paper, we evaluate our approach over verbs other than be and have, the two most frequent verbs in this corpus. Table 4 shows the distribution of clauses with be, have, and remaining verbs as their main verb. Clauses with be as their main verb al- ways denote states. Have is highly ambiguous, so the aspectual classification of clauses headed by have must incorporate additional constituents. For ex- ample, "The patient had Medicaid" denotes a state, while, "The patient had an enema" denotes an event. In separate work, we have shown that the semantic category of the direct object of have informs classi- fication according to stativity (Siegel, 1997). Since the remaining p r o b l e m is to increase the classifica- tion accuracy over the 68.1% of clauses that have main verbs other than be and have, all results are measured only across that portion of the corpus. As shown in Table 4, 83.8% of clauses with verbs other than be and have are events.
A portion of the parsed clauses must be manu- ally classified to provide supervised training data for the three learning methods mentioned above, and to provide a separate set of test data with which to eval- uate the classification performance of our system. To this end, we manually marked 1,851 clauses selectcd uniformly from the set of parsed clauses not headed
by be or have. As a linguistic test to mark according to stativity, each clause was tested for readability with "What happened was... "~ Of these, 373 were rejected because of parsing problems (verb or direct object incorrectly identified). This left 1,478 parsed clauses, which were divided equally into 739 training and 739 testing cases.
Some verbs can denote both states and events, depending on other constituents of the clause. For example, show denotes a state in "His lumbar punc- ture showed evidence of white cells," but denotes an event in "He showed me the photographs." However, in this corpus, most verbs other than have are highly dominated by one sense. Of the 739 clauses included in the training set, 235 verbs occurred. Only 11 of these verbs were observed as both states and events. Among these, there was a strong tendency towards one sense. For example, show appears primarily as a s t a t e . Only five verbs - say, state, supplement, describe, and lie, were not dominated by one class over 80% of the time. Further, each of these were observed less than 6 times a piece, which makes the estimation of sense dominance inaccurate.
The limited presence of verbal ambiguity in the test set does, however, place an upper bound of 97.4% on classification accuracy, since linguistic in- dicators are computed over the main verb only.
4 R e s u l t s
Since we are evaluating our approach over verbs other than be and have, the test set is only 16.2% states, as shown in Table 4. Therefore, simply clas- sifying every verb as an event achieves an accuracy of 83.8% over the 739 test cases, since 619 are events. However, this approach classifies all stative clauses incorrectly, achieving a stative recall of 0.0%. This method serves as a baseline for comparison since wc are attempting to improve over an uninformed approach. 3
4.1 I n d i v i d u a l I n d i c a t o r s
The second and third columns of Table 2 show the average value for each indicator over stative and event clauses, as measured over the 739 training ex- amples. As described above, these examples exclude be and have. For example, 4.44% of stative clauses are modified by either not or never, but only 1.56% of event clauses were modified by these adverbs. The fourth column shows the results of T-tests that com- pare the indicator values over stative verbs to those over event verbs. For example, there is less than a 0.05% chance that the difference between stative and event means for the first four indicators listed
2This test was suggested by Judith Klavans (personal communication).
[image:4.612.72.275.72.121.2]is due to chance. Overall, this shows that the differ- ences in stative and event averages are statistically significant for the first seven indicators listed (p < .01).
This analysis has revealed correlations between verb class and five indicators that have not been linked to stativity in the linguistics literature. Of the top seven indicators shown to have positive correla- tions with stativity, three have been linguistically motivated, as shown in Table 1. T h e other four were not previously hypothesized to correlate with aspectual class: (1) verb :frequency, (2) occurrences modified by "not" or "never", (3) occurrences with no deep subject, and (4) occurrences in the past or present participle. Furthermore, the last of these seven, occurrences in the perfect tense, was not pre- viously hypothesized to correlate with stativity in particular.
However, a positive correlation between indicator value and verb class does not necessarily mean an indicator can be used to increase classification ac- curacy. Each indicator was tested individually for its ability to improve classification accuracy over the baseline by selecting the best classification thresho',d over the training data. Only two indicators, verb :frequency, and occurrences with not and never,
were able to improve classification accuracy over that obtained by classifying all clauses as events. To validate t h a t this improved accuracy, the thresh- olds established over the training set were used over the test set, with resulting accuracies of 88.0% and 84.0%, respectively. Binomial tests showed the first of these to be a significant improvement over the baseline of 83.8%, but not the second.
4.2 C o m b i n i n g I n d i c a t o r s
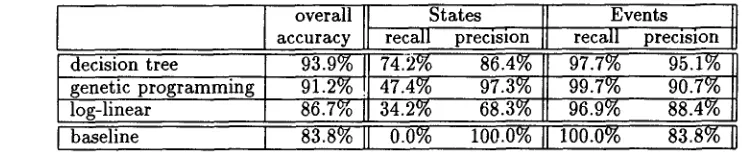
All three machine learning methods successfully combined indicator values, improving classification accuracy over the baseline measure. As shown in Ta- ble 5, the decision tree's accuracy was 93.9%, genetic programming's function trees had an average accu- racy of 91.2% over seven runs, and the log-linear re- gression achieved an 86.7% accuracy. Binomial tests showed that both the decision tree and genetic pro- gramming achieved a significant improvement over the 88.0% accuracy achieved by the : f r e q u e n c y indi- cator alone. Therefore, we have shown that machine learning methods can successfully combine multi- ple numerical indicators to improve the accuracy by which verbs are classified.
T h e differences in accuracy between the three methods are each significant (p < .01). Therefore, these results highlight the importance of how linear and non-linear interactions between numerical lin- guistic indicators are modeled.
4.3 I m p r o v e d R e c a l l T r a d e o f f
The increase in the number of stative clauses cor- rectly classified, i.e. stative recall, illustrates a more
dramatic improvement over the baseline. As shown in Table 5, stative recalls of 74.2%, 47.4% and 34.2% were achieved by the three learning methods, as compared to the 0.0% stative recall achieved by the baseline, while only a small loss in recall over event clauses was suffered. T h e baseline does not classify any stative clauses correctly because it classifies all clauses as events. This difference in recall is more dramatic than the accuracy improvement because of the dominance of event clauses in the test set.
This favorable tradeoff between recall values presents an advantage for applications t h a t weigh the identification of stative clauses more heavily than that of event clauses. For example, a preposi- tional phrase denoting a duration w i t h / o r , e.g., ".for a minute," describes the duration of a state, e.g.,
"She felt sick for two weeks," or the duration of the state that results from a telic event, e.g., "She left the room for a minute." T h a t is, correctly identifying the use of for depends on identifying the stativity of the clause it modifies. A language understand- ing system that incorrectly classifies "She felt sick for two weeks" as a non-telie event will not detect that "for two weeks" describes the duration of the
feel-state. If this system, for example, summarizes durations, it is i m p o r t a n t to correctly identify states. In this case, our approach is advantageous.
5
C o n c l u s i o n s
a n d F u t u r e W o r k
We have compiled a set of fourteen quantitative lin- guistic indicators that, when used together, signifi- cantly improve the classification of verbs according to stativity. The values of these indicators are mea- sured automatically across a corpus of text.
Each of three machine learning techniques success- fully combined the indicators to improve classifica- tion performance. T h e best of the three, decision tree induction, achieved a classification accuracy of 93.9%, as compared to the uninformed baseline's ac- curacy of 83.8%. Furthermore, genetic programming and log-linear regression also achieved improvements over the baseline. These results were measured over an unrestricted set of verbs.
The improvement in classification performance is more dramatically illustrated by the favorable trade- off between stative and event recall achieved by all three of these methods, which is profitable for tasks that weigh the identification of states more heavily than events.
This analysis has revealed correlations between stativity and five indicators t h a t are not tradition- ally linked to stativity in the linguistic literature. Furthermore, one of these four, verb frequency, in- dividually increased classification accuracy from the baseline m e t h o d to 88.0%.
overall accuracy
decision tree 93.9%
genetic programming 91.2%
log-linear 86.7%
baseline 83.8%
States II Events
recall precision recall precision
74.2% 86.4% 97.7% 95.1%
47.4% 97.3% 99.7% 90.7%
34.2% 68.3% 96.9% 88.4%
0.0% 100.0%
II 100.0%
83.8%
Table 5: Comparison of three learning methods and a performance baseline.
incorporate rules that classify a clause directly from clausal features (e.g., Is the main verb show, is the clause in the progressive?), or by calculating indi- cator values over other clausal constituents in addi- tion to the verb (Siegel and McKeown, 1996; Siegel, 1997).
Classification performance may also improve by incorporating additional linguistic indicators, such as co-occurrence with rate adverbs, e.g., quickly, or occurrences as a complement of force or persuade, as
suggested by Klavans and Chodorow (1992).
A c k n o w l e d g m e n t s
Kathleen R. McKeown was extremely helpful regard- ing the formulation of our work and Judith Klavans regarding linguistic techniques. Alexander D. Char- fee, Vasileios Hatzivassiloglou, Dragomir Radev and Dekai Wu provided many helpful insights regarding the evaluation and presentation of our results.
This research is supported in part by the Columbia University Center for Advanced Technol- ogy in High Performance Computing and Commu- nications in Healthcare (funded by the New York State Science and Technology Foundation), the Of- fice of Naval Research under contract N00014-95-1- 0745 and by the National Science Foundation under contract GER-90-24069.
Finally, we would like to thank Andy Singleton for the use of his GPQuick software.
R e f e r e n c e s
Allen, J. 1995. Natural Language Understanding.
Benjamin/Cummings, Redwood City, CA.
Baker, R.J. and J.A. Nelder. 1989. The GLIM System, Release 3: Generalized Linear Interactive Modeling. Numerical Algorithms Group, Oxford.
Breiman, L., J.H. Friedman, R.A. Olshen, and C.J. Stone. 1984. Classification and Regression Trees.
Wadsworth, Belmont.
Church, K. 1988. A stochastic parts program and noun phrase parser for unrestricted text. In Pro- ceedings of the 2nd Conference for Applied Natural Language Processing, pages 136-143.
Cramer, N. 1985. A representation for the adap- tive generation of simple sequential programs. In J. Grefenstette, editor, Proceedings of the [First] International Conference on Genetic Algorithms.
Lawrence Erlbaum.
Dorr, B.J. 1992. A two-level knowledge representa- tion for machine translation: lexical semantics and tense/aspect. In James Pustejovsky and Sabine Bergler, editors, Lezical Semantics and Knowledge Representation. Springer Verlag, Berlin.
Dowty, D. 1979. Word Meaning and Montague Grammar. D. Reidel, Dordrecht, W. Germany.
Duda, R. O. and P.E. Hart. 1973. Pattern Classifi- cation and Scene Analysis. Wiley, New York.
Goldberg, D. 1989. Genetic Algorithms in Search, Optimization, and Machine Learning. Addison- Wesley Publishing Company, Inc., Reading, MA.
Hatzivassiloglou, V. and K.R. McKeown. 1993. To- wards the automatic identification of adjectival scales: Clustering adjectives according to mean- ing. In Proceedings of the 31st Annual Meeting of the ACL, pages 172-182, Columbus, Ohio, June. Association for Computational Linguistics.
Hatzivassiloglou, V. and K.R. McKeown. 1995. A quantitative evaluation of linguistic tests for the automatic prediction of semantic markedness. In Proceedings of the 33rd Annual Meeting of the ACL, pages 197-204, Boston, Massachusetts, June. Association for Computational Linguistics.
Holland, J. 1975. Adaptation in Natural and Arti- ficial Systems. The University of Michigan Press, Ann Arbor, MI.
Klavans, J.L. 1994. Linguistic tests over large cor- pora: aspectual classes in the lexicon. Technical report, Columbia University Dept. of Computer Science. unpublished manuscript.
Klavans, J.L. and M. Chodorow. 1992. Degrees of stativity: the lexical representation of verb aspect. In Proceedings of the 14th International Confer-
ence on Computation Linguistics.
[image:6.612.93.464.78.154.2]Luk, A.K. 1995. Statistical sense disambiguation with relatively small corpora using dictionary def- initions. In Proceedings of the 33rd Annual Meet- ing of the ACL, Columbus, Ohio, June. Associa- tion for Computational Linguistics.
McCord, M.C. 1990. Slot grammar: A system for simpler construction of practical natural lan- guage grammars. In R. Studer, editor, Interna- tional Symposium on Natural Language and Logic.
Springer Verlag.
Moens, M. and M. Steedman. 1988. Temporal ontology and temporal reference. Computational Linguistics, 14(2).
Passonneau, R.J. 1988. A computational model of the semantics of tense and aspect. Computational Linguistics, 14(2).
Pereira, F., N. Tishby, and L. Lee. 1993. Distri- butional clustering of English words. In Proceed- ings off the 31st Annual Meeting of the A CL, pages 183-190, Columbus, Ohio, June. Association for Computational Linguistics.
Pustejovsky, J. 1991. The syntax of event structure.
Cognition; 41(103):47-92.
Quinlan, J.R. 1986. Induction of decision trees. Ma- chine Learning, 1(1):81-106.
Santner, T.J. and D.E. Duffy. 1989. The Statistical Analysis off Discrete Data. Springer-Verlag, New York.
Siegel, E.V. 1997. Classifying Natural Language Phrases with Corpus-Based Linguistic Indicators.
Ph.D. thesis, Columbia University.
Siegel, E.V. and K.R. McKeown. 1996. Gathering statistics to aspectually classify sentences with a genetic algorithm. In K. Oflazer and H. Somers, editors, Proceedings of the Second International Conference on New Methods in Language Process- ing, Ankara, Turkey, Sept. Bilkent University. Vendler, Z. 1967. Verbs and times. In Linguistics in