ATCGATCGCG
ATUGATUGUG
bisulfiteATTGATTGTG
Abstract—The studies of methylation using PCR (Polymerase Chain Reaction) have become very popular recently. Because PCR is a molecular biology technology that can be used for amplifying DNA restriction fragment, it is very important in biological study. Existing methylation primer design tools usually do not provide specific PCR product. In this paper we will design primer pair to find the suitable DNA sequence information by PSO (Particle Swarm Optimization), which uses a update function and swarm intelligence to optimize our search. According to test result, this method can assist biologists to find useful primer information and relevant methylation information.
Index Terms— PCR, Primer Design, PSO, Methylation
I. INTRODUCTION
DNA methylation is essential for biologist studying development in mammals and has been implicated in human pathological conditions. It is a kind of DNA sequence modification that can change behavior of gene expression from altering DNA sequence structure and typically occurs at CpG sites in vertebrates [1-2]. In recent years, the polymerase chain reaction (PCR) has been widely applied in bioinformatics and clinical medicine. PCR is a method for fast duplication of DNA sequences. Therefore, they are mostly used to amplify the number of DNA sequences. In the methtylation studies, it is increasingly important to find tools for DNA cloning and primer pair design for clipping targeted subsequence from original DNA sequence.
Due to the reason that PCR amplification will change properties of its product, it is needed to set design constraints in order to optimize primer pair, which can exactly clip the target fragment in DNA sequence. Common consideration of primer design constraints includes lengths of the primers, melting temperatures, base composition, self-complementary sequence and hairpin. The calculated values for the melting temperature of a primer pair should not differ by more than 5 Celsius degree. The primers’ lengths should be within 18-26
Manuscript received January 12, 2010. This work was supported in part by the National Science Council in Taiwan under grants NSC96-2221-E-214-050-MY3, NSC97-2622-E-151-008-CC2, NSC98-2221-E-151-040-, NSC98-2622-E-151-001-CC2, and NSC98-2622-E-151-024-CC3.
Cheng-Hong Yang is with the Department of Electronic Engineering, National Kaohsiung University of Applied Sciences, 80778, Kaohsiung Taiwan (phone: 886-7-3814526#5639;( e-mail:[email protected]) Cheng-Hong Yang is also with the Network Systems Department, Toko University, 61363, Chiayi, Taiwan.
Ming-Cheng Lin is with the Department of Electronic Engineering, National Kaohsiung University of Applied Sciences, Taiwan (e-mail:[email protected])
Li-Yeh Chuang is with Department of Chemical Engineering, I-Shou University, Kaohsiung, Taiwan (e-mail:[email protected])
bps, while the difference of lengths of primer pairs should not exceed 3 bps. The GC content of primers should be within 40-60%. The 3’ end of primers should be G or C whenever possible. By considering the above constraints, out primer design tool can find the best choice from constructing a set of primer pair candidates.
Recently, many kinds of primer design tools were developed, but most of those systems’ functions lack of methylation evaluation, and are time consuming to find the feasible primer pair (e.g. Primer Design Assistant [3]). Besides, PCR experiments are expensive having a minor mistake may cause failure of experimentation. The primers are the critical factor for PCR experiments. To improve the quality of primer pair, we use the particle swarm optimization (PSO) algorithm. This method is a stochastic, population-based evolutionary computer algorithm developed by Kennedy and Eberhart in 1995[4]. PSO is an automatically evolving algorithm sparked by natural evolution of social behavior of organisms.
Advantages of PSO include being fast to converge, requiring smaller set of parameters and holding memory inside each particle. PSO also has some characteristics same as other algorithms (e.g. GA [5]). As a result, PSO is widely used in various applications.
Currently, methylation primer design is developed according to bisulfite-conversion which changes nucleotide “C” to “T” in DNA sequence [6]. Nowdays, primer sets for methylation analysis designed by most methods will amplify both methylated and unmethylated templates theoretically. Therefore, we hope our developed tool can provide better result to help biologists in studying DNA methylation.
II. SYSTEM AND METHOD
2.1 Sequence conversion
In the primer design for bisulfite-modified DNA sequence, bisulfite is used to test whether a nucleotide is methylated. Adding of bisulfite into DNA sequences will change nucleotide ‘C’ to ‘U’ in principle, which is illustrated in Fig. 1. Hence, the conversion from cytosine to urical can be used to gauge whether it is methylated.
Fig.1. DNA is modified with bisulfite to convert unmethylatde cytosines (C) to uracil (U) residues. 2.2 Primer Design for Methylation
Primer Design for the PCR in Methylation
Studies Using PSO
In our study, the restriction enzymes are used to cut the methylation sites in PCR product, we will then design new primer pairs for those discovered methylation sites. The flow of design is shown below:
A. Original PCR Product
DNA Methylation
B. Addition Bisulfite PCR
DNA Unmethylation
Example: There are two methyation positions respective M1 and M2 that can be cut by restriction enzyme. Consider the two possible conditions:
(1) Primer not overlapped
If our primer pair designed to clip the target DNA methylation sites does not violate the requirement that the regions between fragment C1 cut by reverse primer and fragment C2 cut by forward primer do not overlap, as shown in Fig. 2, we will design the forward primer cut at position at least 100 bases in front of target methylation site and at least 200 bases behind the target methylation site cut by reverse primer.
Fig.2. Not overlap (2) Primer overlapped
If the reverse primer cutting C1 is situated behind the forward primer cutting C2, then our designed primer pair for the target DNA methylation sites are called overlapped, which is shown in Fig.3. The overlapped primer will result in six possible fragments as can be seen in Fig. 4. Thus, we need to revises the primer design, placing the forward primer in front of methylation site M1 about 100 bases and the reverse primer about 200 bases behind the methylation site M2, which is demostrated in Fig. 5.
Fig.3. Overlapping
Fig.4. DNA fragments
Fig.5. Revised primer design 2.3 System design
In order to provide a convenient tool to assist biologists to design the methylation primers, in this study, we develop a methylation primer design system. The system modules are shown in Fig. 6 including (1) Sequence Input Module, (2) Constraints Information Model, (3) Restriction enzyme Model, (4) Primer Design Module, (5) Output Module. The Sequence Input Module uses a strand of DNA sequence. With consideration of constraint information and avoidance of collision between primer pair and restriction enzymes by widening distance from each primer, then we use PSO to optimize methylation primer design. Finally, the Output Module shows the primer information, PCR product and methylation analysis.
Fig.6. System modules (1) Sequence Input Model
The Sequence Input Model provide a convenient input function to input a template sequence, such as "ATCGATCG...". A dataset: NM_011067 (organism: mouse) will be used as an example to design methylation primers.
(2) Constraints Information Model
Primer design constraint, include GC%, Primer length, Tm, Tm difference, self-complementarity, PCR length, hairpin and the nucleotide at 3’ end, etc. We are setting the parameters to search optimal primer pair by our constraints described above, user can also modify the parameters according to their needs.
(3) Restriction enzyme Model
Restriction enzyme is a kind of nuclease that can cut DNA without damaging the DAN structure. Most restriction sites consist of four to six nucleotides. Methylation sites could appear on the PCR product, our system is designed to find those positions by using restriction enzymes to cut the methylation sites. Some of the typical restriction sites used in this paper are shown in the Table 1.
M1 M2
S
C1 C2
Not overlapped
S: Sequence
M1: methylation position 1 C1: Cut fragment 1 M2: methylation position 2 C2: Cut fragment 2
M1 M2 S
C1 C2
Overla
M1 S M2
C1
C2
C3 C4
C5
M1 M2 S
RC1
RC1: Revisedfragment
C U T C C
S P
[image:3.595.104.234.54.154.2]Pf Pr
Table 1. Restriction enzymes Restriction
enzyme
Sequence
ApaI GGGCCC
BamHI GGATCC
DraI TTTAAA
EcoRI GAATTC
HindIII AAGCTT
In our tool, users can also input their restriction enzyme sequences to search for possible restriction sites cut by those enzymes, one examples is demonstrated in Fig. 7.
Fig.7. Cut method (4) Primer Design Module
The Primer Design Module is composed largely of particle swam optimization (PSO) algorithm. PSO is an evolutionary computing technique was first introduced by James Kennedy and Russell C. Eberhart in 1995[4], which was inspired by observation of social behaviors birds in a flock and fishes in a school and can be used to solve optimization problem by simulating behaviors of population stochastically. Particle swarm optimization algorithm is modeled on swarm intelligence, every particle coexists and evolves simultaneously based on knowledge shared with neighboring particle, and each one makes use of its own memory and knowledge gained by the swarm as a whole to find the best solution. PSO has been successfully applied in many field, including data clustering [7] and TSP [8], etc.
(5) Output Module
The Output Module shows the methylation positions and our primer information, which includes primer length, GC%, Tm, Tm difference and PCR length, etc. The results will be offered as research reference.
2.4 Primer Design Using PSO
In this section, we will define the primer design problem more clearly. Let S be the DNA sequence, which is made up of nucleic acid with a vocabulary composed of {A, C, G, T}. Take the sequence below for example:
S =ATTACGCAT
Since nucleotides ‘A’ and ‘T’ will attract to each other when in proximal distance with hydrogen bonds and nucleotides ‘C’ and ‘G’ attracts each other in the same way. We term the phrase complementary sequence of S as
,
S which can be seen below:
S =TAATGCGTA
The forward primer of S is denoted as Pf , and is defined as
follows:
Pf = {Bi | i is the index of S between Fsand Fe} The reverse primer of S is denoted as Pr, and is defined as
follows:
Pr = {Bi | i is the index of S between Rsand Re}
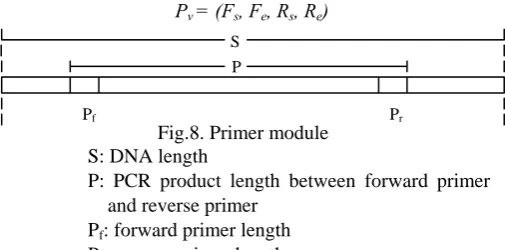
Where Fs is the start index of the forward primer and the Feis end index of the forward primer, and Rsand Re are defined in the same way as start and end index for the reverse primer respectively. Thus, the region cut by the primers between Fe and Rs is the PCR product. The primer module is shown Fig. 8. Then, a vector Pv can be defined with Fs, Fe, Rsand Re .
Pv = (Fs, Fe, Rs, Re)
Fig.8. Primer module S: DNA length
P: PCR product length between forward primer and reverse primer
Pf: forward primer length
Pr: reverse primer length
(1) Swam Initialization
A set of particles defined as P= (Fs, Fe, Rs, Re) is generated randomly without duplication as the initial population, where the value of Fs is generated anywhere in the range between [1, |S|], Fe and Re are generated in accordance with the primer length constraints set by the user, and Rsis a random number between 50-500, which can also be set by the user. In our system, the velocity of each particle is randomly generated within the range of [0, 1].
(2) Fitness evaluation
The primer length is only effective ranging from 16bps to 28bps in PCR experiments, a primer too long will raise the specificity higher than desired. On the other hand, a primer too short will decrease the specificity, thus, defecting its effectiveness. Therefore, a primer too long or too short is not suitable for the experiment. The primer length check function is defined as:
otherwise and P
and
Pf 16 f 28,P 16 P 28
, 1 , 0
Length_pr ≥ ≤ r≥ r≤
⎩ ⎨ ⎧ =
(1) Besides, the length different function Length_difr between
Pf and Prmust <3, the ABS is absolute value.
otherwise P P ABS( f r) 3 ,
1 , 0 r
Length_dif − ≤
⎩ ⎨ ⎧ =
(2) The melting temperature of primer is formulated as:
Tm=-273.15+ΔH/(ΔS+R*ln(Ct))+16.6*log[Na+] (3)
R= Gas constant (1.987
cal/
oC
/mol); Ct = concentration of nucleic acids [Na+] = concentration of monovalent ionsinitiation
H H
H= Δ +Δ
[image:3.595.303.556.204.329.2]initiation
S S
S = Δ +Δ
[image:4.595.48.193.536.662.2]Δ
∑
( )Table 2. Nearest-Neighbor Model Parameters Nearest-neighbor thermodynamics
Interaction △H △S
AA/TT
9.1 24.0AT/TA
8.6 23.9TA/AT
6.0 16.9CA/GT 5.8 12.9
GT/CA 6.5 17.3
CT/GA 7.8 20.8
GA/CT
5.6 13.5CG/GC 11.9 27.8
GC/CG 11.1 26.7
GG/CC 11.0 26.6
ΔH and ΔS are both calculated as the nearest-neighbor model shown in Table 2, which was first introduced by Breslauer K. J. [9], this method can be used to account interactions between each pair of nearest-neighbors in the DNA sequence to obtain a stable melting temperature. Function Tm_fr is used to check whether the melting temperature of the primer pair is within the user set range 50℃ to 60℃, and the function Tm_difr is used to check the melting temperatures’ difference between forward and reverse primer does not exceed 5℃.
⎪ ⎩ ⎪ ⎨ ⎧ ≤ ≥ ≤ ≥ = otherwise , 1 60 T P and 50 T P 60, T P and 50 T P 0, fr _
Tm r m r m
m f m f (4) ⎩ ⎨ ⎧ ≤ = otherwise 1, 5 ) T P -T ABS(P 0, 0 difr _
Tm f m r m (5)
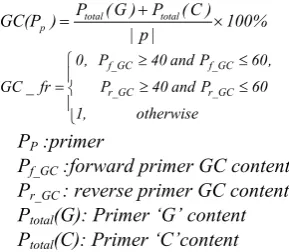
The GC content, GC(PP), is defined as the ratio of nucleotides
‘G’ and ‘C’ in the primer, and the function GC_fr is used to make certain GC content is between 40%-60%:
% 100 | p | ) C ( P ) G ( P )
GC(P total total
p ×
+
= (6)
⎪ ⎩ ⎪ ⎨ ⎧ ≤ ≥ ≤ ≥ = otherwise , 1 60 P and 40 P , 60 P and 40 P , 0 fr _
GC r_GC r_GC
f_GC f_GC
(7)
PP :primer
Pf_GC :forward primer GC content
Pr_GC : reverse primer GC content
Ptotal(G): Primer ‘G’ content
Ptotal(C): Primer ‘C’content
In designing the primer, the termination of primer is limited to G or C, and the following function is used to check the constraint: ⎩ ⎨ ⎧ = otherwise , 1 C or G is end 3' P and P if , 0
Pr_end f r (8)
The function to check PCR length does not exceed 50-500
bps is defined as:
otherwise 500 and 50 , 1 , 0
Length_mid ≥ ≤
⎩ ⎨ ⎧
= β β
(9)
β: PCR length
The 3’ end of primer sequence may bind to other sequence. To avoid the self-complementarity problem, one should not design the primer pair with each ends complements with each other. The Sc_pt and Pair_pt functions are defined as follows to solve this situation:
⎪ ⎩ ⎪ ⎨ ⎧ = otherwise , 1 ary complement -lf se no site other in appear P and P if , 0 pt _ Sc r f (10) ⎪ ⎩ ⎪ ⎨ ⎧ = otherwise , 1 ary complement -pair no appear P and P if , 0 pt _ Pair r f (11)
The function to consider the specificity of the primer designed for PCR experiment is defined below:
⎩ ⎨ ⎧ = otherwise , 1 once S in appear P P if , 0 fr _ p
Re for r (12)
We then construct the PSO fitness function by combining all the functions above and the result is shown below; this function will be used to evaluate the fitness of each particle.
Fitness= Length_pr+3*(Length_difr +Tm_fr + Tm_difr +GC_fr) +10* (Pr_end+Length_mid+Sc_pt) +50*Rep_fr (13) (3) Particle swarm optimization
PSO is a population based optimization algorithm. In PSO, each particle is analogous to an individual “fish” in a school of fish. Each particle makes use of its own memory and knowledge obtained from its neighbors to find the best solution, and then the best position among the path travelled by some particle will be called pbesti. The best value from all the individual pbest values is called gbest. At each generation, each particle’s position and velocity are updated according to its own pbest and gbest of this population by the following function: ) ( ) ( 2 2 1 1 oid id id oid id id old id new id x gbest r c x pbest r c v w v − × × + − × × + × = (14) new id oid id new
id x v
x = +
(15) Where r1and r2 are random numbers between (0, 1), and C1 and C2 are both been set as 2. Velocities
v
newid and
v
oldid denote
the velocities of new particle and old particle respectively, and positions
x
newid and
x
oldid are the updated particle position
and current particle position.
below:
min max
max min
max )
( w
move move move
w w
w= − × − i +
(16)
wmax, wmin are been set to be 0.9 and 0.4 respectively, and movemax,movei represent max iterate number and current
iterate number respectively.
The flow chart overviews PSO algorithm for the primer design is shown in Fig.9. The design process follows with initialization of swarm population, fitness evaluation, searching of pbest and gbest, updating of particles and finally output the best solution when the required criteria have been met.
Start Initialize
particle swarm velocities and
positions
Evaluate fitness for each particle
Find pbest and gbest In the particle
Find the best solution ?
Update velocity and position for each particle END
[image:5.595.46.291.205.281.2]No Yes Output
Fig.9. PSO for primer design flowchart III. RESULTS AND DISCUSSION
PSO has the advantages of fast convergence, requiring less parameters needed to be set by the users, and having memory reserved in every particle that can be used to compare to each other in the search process. As a result, PSO is widely used in various fields. In the PSO update function, the acceleration factors C1 and C2 are most important as a value too large or too small will result in inferior solution. In many researches, it can be shown that solution of PSO algorithm can quickly converge to location close to global optimal solution [11].
[image:5.595.360.492.228.358.2]The studies for methylation and primer design have become popular; therefore there have been many present primer design tools developed to tackle this problem, but it still remain area of improvement. Table 3 below compares our proposed tool to other available primer design tools.
Table 3. Comparison of various primer design tools Tools Proposed Mmethprime
r
Primer3 PDA
Primer base Information
○ ○ ○ ○
Primer self- complementar
y
○ x ○ x
Primer pair- complementar
y
○ x ○ ○
Visualized ○ ○ ○ x
B/S ○ ○ x x
Restriction enzyme
○ x x x
The tools MethPrimer by Li and Dahiya [12], Primer3 by Rozen and Skaletsky [13], PDA by S.H. Chen1, C.Y. Lin, C.S. Cho, C.Z. Lo and C.A. Hsiung [3], B/S: whether the tool designs primers for bisulfite sequences or not.
The primer information provided by our tool includes GC%, Tm, primer length, Tm difference, PCR size and sequence input panel, etc. In comparison to other primer design tools, our proposed tool differs primarily with the
Methprimer on the capability of usage of restriction enzyme for methylation analysis after we obtain the clipped sequence. Besides Methprimer, functions of the Primer3 and PDA tools are too basic to satisfy much research needs because of their exclusion of methylation translation function which considers situation where conversion form 'C's to 'T's occurs. The proposed tool combines functions from Primer3, PDA and ability to treat bisulfate sequence from Methprimer, then a function able to visually demonstrate the distribution of GC.
Figure 10 shows the user operation flow chart. Our tool is capable of designing primer pair for PCR product and analyzing methylated sites. The primer information and its related methylation process will be shown in a window
Fig.10. Software operation flowchart
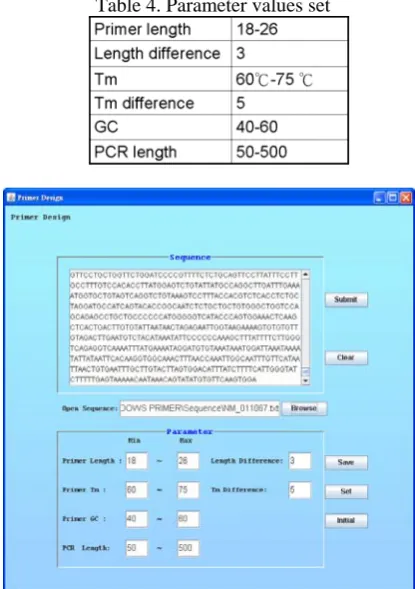
[image:5.595.322.530.480.775.2]We implemented our tool in JAVA for its easiness to maintain and quickness to develop a GUI (Graphical user interface). The input interface is shown as Fig.11 with the example: NM_011067 (organism: mouse), the Sequence panel shows the DNA sequence information, and the values in parameter panel are set as Table 4 described.
Table 4. Parameter values set
Fig.11. Software input interface
Start
Primer Selection Criteria Set
PSO
Primer Information
Visualization
Methylation Analyze
[image:5.595.46.291.523.694.2]By running a test of input sequence NM_011067, the results are shown in Fig.12 and Table 4 with a visualization of GC distribution can be seen below Fig.12. Fig.13 shows Methylation Analysis result.
Fig.12. Primer information interface Table5. Primer information
The reason of high melting temperatures shown in Table 5 can be attributed to the commonly used simple function Tm=2(#A+#T) + 4(#C+#G), which considers only ratios of nucleic acid but not the concentration of ion. The function (3) can be used to calculate value closer to actual temperature by contemplating what was missed in the above simple function.
Fig.13. Methylation Analysis
We use the restriction enzyme “GAATTA” to clip the methylation sites for PCR product, then a new primer pair will designed specifically for those positions, e.g. the restriction enzyme has clip the position 1582, thus a new primer pair will be designed with the forward primer “TTCATCATTGGTCGACATAA” and the reverse Primer “ATTAAGAATGTGGGCCAACA” each of 20 bps long for the positions 1483 to 1502 and 1783 to 1803 respectively.
IV. CONCLUSION
The quality of primers has much influence upon the success of a PCR experiment. In this paper, we have provided a tool using PSO algorithm to design optimal primers for methylation, and the proposed approach is effective and takes relatively short time to compute. The user can adjust constraints such as melting temperatures, primer length, PCR length and GC%, to find correct restriction enzyme for target sequence clipping. The result shows the primer information provided is useful in PCR experiments and beneficial to biologists, and we expect by combining other algorithms to improve our tool getting better results.
REFERENCES
[1] Thomas R. Haines, David I. Rodenhiser, and Peter J. Ainsworth, “Allele-Specific Non-CpG Methylation of the Nf1 Gene during Early Mouse Development”, Science Direct, Dec 2001, 585–598.
[2] Jonathan E. Dodgea, Bernard H. Ramsahoyeb, Z. Galen Woa, Masaki Okanoa, En Lia, “De novo methylation of MMLV provirus in embryonic stem cells:CpG versus non-CpG methylation”, Science Direct, 4 February 2002,41-48.
[3] S.H. Chen1, C.Y. Lin, C.S. Cho, C.Z. Lo and C.A. Hsiung, “Primer Design Assistant (PDA): a web-based primer design tool”, Nucleic Acids Research, Vol. 31, No. 13 2003, pp. 3751–3754.
Available:http://dbb.nhri.org.tw/primer/
[4] Kennedy, J. and Eberhart, R.C., “Particle swarm optimization”, In
proceedings of the 1995 IEEE International Conference On Neyral Networds, vol.4, 1995, 1942-1948, Perth, Australis.
[5] Jain-Shing Wu, Chungnan Lee, Chien-Chang Wu and Yow-Ling Shiue, Primer design using genetic algorithm”, Bioinformatics, vol. 20 no. 11 2004, pp. 1710-1717.
[6] Gabor E. Tusnady, Istvan Simon, Andras Varadi and Tamas Aranyi, “BiSearch: primer-design and search tool for PCR on bisulfite-treated genomes”, Nucleic Acids Research, 2005, Vol. 33, No. 1.
[7] Chui-Yu Chiu and I-Ting Kuo., “Applying honey-bee mating optimization and particle Swarm optimization for clustering pro Chinese Institute of Industrial Engineers, Vol. 26, 2009, No. 5, pp. 426-431.
[8 ] X.H. Shi, Y.C. Liang, H.P. Lee, C. Lu, and Q.X. Wang, “Particle swarm -based algorithms for TSP and generalized TSP”, Information
Processing Letter, Vol. 103, Issue 5, August 2007, pp 169-176, 31. [9] Breslauer K.J, Frank R, Blocker H, Mark La, “Predicting DNA duplex
stability from the base sequence”, Proc. Natl. Acad. Sci. USA, Vol. 83, 1986, pp. 3746-3750, June.
[10] Y. Shi and R.C. Eberhart, “A modified particle swarm optimizer”,
Proceedings of IEEE International Conference on Evolutionary Computation, Anchorage, AK, May 1998, pp. 69-73.
[11] Kennedy, J. and Eberhart, R.C., “Particle swarm optimization an overview”, Swarm Intell, 2007, 33-57 blems”.
[12] Long-Cheng Li and Rajvir Dahiya, “MethPrimer: designing primers for methylation PCRs”, Bioinformatics, Vol. 18 no. 11 2002, 1427–1431. Available:http://www.urogene.org/methprimer/index1.html
[13] Rozen,S. and Skaletsky,H.J. “Primer3 on the WWW for general users and for biologist programmers”. In Misener,S. and Krawetz,S.A. (eds.) Bioinformatics Methods and Protocols: Methods in Molecular Biology. Humana Press, Totowa, NJ, 2000, pp. 365–386.