Original Article
Effect of RNAi silencing
Notch1
on
chemosensitivity in human glioma cells
Bin Feng1, Jianying Zhao2, Liming Luan1, Shangchen Xu1, Xiangrong Zheng1, Guangyu Zhao1
1Neurosurgery, Shandong Provincial Hospital Affiliated to Shandong University, Jinan 250021, Shandong
Province, China; 2Neurosurgery, Jiyang Hospital of Traditional Chinese Medicine, Jinan, China Received April 27, 2017; Accepted January 4, 2018; Epub April 15, 2018; Published April 30, 2018
Abstract: Objective: To investigate the effect of Notch1 on the proliferation and apoptosis of human glioma cells as well as the resistance to chemotherapeutics, so as to explore its possible mechanism. Methods: The expression vector of Notch1-siRNA was established to silence the expression of Notch1. The human glioma cell line U373 was divided into 5 groups for different RNA intervention and drug intervention methods. The proliferation capability and apoptosis rate of the cells in each group were detected by MTT and Flow Cytometer respectively. The expressions of MMP2 and VEGF which were related to the proliferation and invasion of glioma cells were detected by RT-PCR and Western-blot respectively. Transplanted tumor models of human glioma cells in nude mice were established to observe the effects of RNAi silencing Notch1 combined with TMZ on the growth of implanted tumor. Results: Compared with control U373 cells, the proliferation capability of cell transfected with Notch1-siRNA was signifi-cantly reduced and the apoptosis rate was signifisignifi-cantly increased (P<0.05). Compared with normal U373 cells with the administration of TMZ, the apoptosis rate of the U373 cells which transfected with Notch1-siRNA followed by the administration of TMZ was significantly increased (P<0.05). The expression of MMP2 and VEGF in U373 cell transfected with Notch1-siRNA was significantly lower than that in control U373 cells. The expression of MMP2 and VEGF in U373 cells which transfected with Notch1-siRNA combined with TMZ was significantly lower than that in control U373 cells (P<0.05). The Notch1-siRNA combined with TMZ significantly inhibited the growth of mouse implanted tumors, and the difference was statistically significant compared to the mouse used TMZ alone (P<0.05). Conclusions: RNAi silencing Notch1 can effectively inhibit the proliferation of the glioma cell, promote the apoptosis and increase the sensitivity to chemotherapeutic drug TMZ, and inhibit the proliferation and invasion of tumor cells by reducing the expression of MMP2 and VEGF.
Keywords: Notch1, RNAi, human glioma U373 cells, temozolomide, chemosensitivity
Introduction
Glioma, characterized by high degree of malig-nancy, strong invasiveness and a high recur-rence rate, is the most common malignant tumor in human brain. Currently, surgery com-bined with radiotherapy and chemotherapy is a
significant therapeutic method in the treatment of glioma [1], but the infinite proliferation, inva -sive growth and the insensitivity to drug treat-ment of residual tumor cells ultimately lead to the failure of chemotherapy or tumor relapse. Therefore, finding effective ways to enhance
the targeted killing or inhibitory effects of che-motherapeutic drugs on tumor cells is the key to improve therapeutic effect of glioma. Notch1
signaling pathway played an crucial role in cell
proliferation, differentiation and apoptosis, and is closely related to the occurrence and devel-opment of tumor as well as the sensitivity of tumor cells to chemotherapeutic drugs [2-4]. Many studies have shown that Notch1 in glioma is highly expressed and Notch1 knockdown can inhibit proliferation and growth of glioma cell [5-7]. To further understand the relationship between Notch1 signaling and the occurrence and development of glioma and to investigate the effect of Notch1 on the chemosensitivity of glioma, the U373 cells model of RNAi silencing
Matrix Metalloproteinase-2 (MMP2) and vascu-lar endothelial growth factor (VEGF) were detec- ted to explore the potential effects on the prolif-eration and invasion of tumor cells.
Materials and methods
Experimental materials
Human glioma cell line U373 was purchased from Shanghai Cell Bank of Chinese Academy of Sciences. BALB/c nude mice (SPF grade) we- re purchased from Shanghai Laboratory Animal Center of Chinese Academy of Sciences.
Experimental methods
Construction of expression vector of Notch1 shRNA: According to the design principles of siRNA and the characteristics of plasmid vector of PLKO.1-puro polyclonal site, the Notch1 -shRNA sequence and the negative control (NC) of shRNA sequence were designed on the basis of the Notch1 (NM-017617.4) in GenBank, syn-thesized and constructed on PLKO.1-puro
vec-tor. The recombinant plasmids were identified
and screened out: Notch1-siRNA plasmid and
Notch1-NC plasmid.
Cell culture and transfection: Human glioma U373 cells were cultured in DMEM medium containing 10% fetal bovine serum. Notch1 -siRNA and Notch1-NC expression vector were steadily transfected, screening the steadily transfected cell lines. The grouping and each transfection were shown in Table 1: Normal U373 cells in group A and D, U373 cells trans-fected with Notch1-NC plasmid in group B, U373 cells transfected with Notch1-siRNA plas-mid in group C andE.
The detection of cell proliferation ability by MTT
assay: The transfected cells in five groups were
inoculated into 96-well plates, repeated with 5-well in each group. Cells in each group were treated with Table 1. The cells were treated
ly. 20 μL 5 mg/mL MTT solution was added in
each well and incubated at 37°C for 5 h. Added
150 μL DMSO in each well and shocked 10 min
and down to dissolve crytals. Then the optical density (OD) value of cells in each well at 570 nm was detected using spectrophotometer after 24 h, 48 h and 72 h, respectively. The cell growth inhibition rate was calculated.
Detection of apoptosis rate by annexin V/PI double staining method: The transfected cells were inoculated into 6-well plates, with the same administration in Table 1. After culture for 72 h, the cells were collected and washed with PBS to formulate cell suspension. Adding Annexin V/PI for 15 min in the dark, the
apopto-sis rate was measured by Cyto FLEX flow
cytometry.
Detection of mRNA expressions of Notch1,
MMP2 and VEGF with RT-PCR: The cells cul-tured for 48 h after transfection and 48 h after administration were collected, in which RNA we- re extracted and reverse transcribed into cDNA. The relative expressions of Notch1, MMP2 and VEGF mRNA were detected by RT-PCR. The primers of Notch1, MMP2, VEGF and β-actin
were showed in Table 2. And the amplification
procedure: predenaturation at 95°C for 1 min; 35 cycles of denaturation at 95°C for 10 s, annealing at 58°C for 25 s and extension for 30 s at 72°C. The 2-ΔΔCt method was used to
calcu-late the relative expression.
Detection of protein expression of MMP2 and VEGF by western-blot: Cells in each group cul-tured for 72 h after administration were col-lected and total protein were extracted. Poly- acrylamide gel electrophoresis was used to separated the protein of all sizes, then trans-ferred the protein to the membrane and incu-bated antibody. The primary antibodies:
[image:2.612.89.410.84.165.2]Anti-Notch1 monoclonal antibody, Anti-VEGF poly-clonal antibody and Anti-MMP2 polypoly-clonal anti-body (Abcam) were incubated with 1:1000 at
Table 1. Cell transfection and administration among groups Group Transfection Administration A Untransfected (normal U373 cells) 100 μL medium B Transfected Notch1-NC plasmid 100 μLmedium C Transfected Notch1-siRNA plasmid 100 μL medium
D Untransfected (normal U373 cells) 70 μL medium+30 μL 200 μmol/L TMZ E Transfected Notch1-siRNA plasmid 70 μL medium+30 μL 200 μmol/L TMZ
with 100 μL medium
in group A, B and C,
and 70 μL medium plus 30 μL TMZ at a
concentration of 200
μmol/L were added to
subsequent-4°C overnight. Secondary antibody: HRP Goat anti-Rabbit IgG antibody (1:2000). Using Beyo- ECL Plus to detected the protein bands. The relative expression of MMP2 and VEGF protein were calculated by ImageJ2x.
Establishment of implanted tumor model of human glioma cells in nude mice: 32 BALB/c nude mice were randomly divided into four groups: group A, group B, group C and group D on average. The suspension of cells in the loga-rithmic growth phase (1×10⁷/L) with an amount
of 0.2 mL was inoculated in subcutaneous tis-sue in the groin of each nude mouse to estab-lish implanted tumor. Normal U373 cells were inoculated in group A and B, and U373 cells transfected with Notch1-siRNA were inoculated
calculated tumor volume=0.5a * b2. After drug
administration for 18 days and staying for 7
days, the mice were sacrificed and the intact
tumor was peeled and weighed. The tumor inhi-bition rare was calculated.
Data analysis
Group A as control group, the cell growth inhibi-tion rate=(OD value of the control group-OD value of the experimental group)/OD value of the control group×100% and the tumor inhibi-tion rate=(tumor weight in the experimental group-tumor weight in control group)/tumor weight in control group×100%. The protein rela-tive expression was calculated by ImageJ2X. All data was analyzed by SPSS 19.0. Measurement data was shown as mean ± SD. The compari-son between two groups was performed by t
test, data comparison among multiple groups was performed with single factor analysis of
variance. P<0.05 represented the difference was statistically significant.
Results
The expression level of Notch1 mRNA
[image:3.612.90.331.84.216.2]The expression level of Notch1 mRNA was detected by RT-PCR. The result was shown in
Figure 1. It can be observed that the relative expression level of Notch1 mRNA in group C
and E (0.495±0.04) was significantly lower than
that in other groups, demonstrating that the
Notch1-siRNA could down-regulate the expres-sion of Notch1 mRNA, which caused Notch1
gene silencing in human glioma U373 cells.
Determination of cell proliferation ability
The optical density values (OD) of cells in each group were measured by ELIASA at 24 h, 48 h
Table 2. The primers used for RT-PCR
Gene Primer sequence Product length Notch1 Sense: 5’-CGACGCACAAGGTGTCTTCCA-3’ 145 bp
Antisense: 5’-GGCGTGTGAGTTGATGAGGT-3’
MMP2 Sense: 5’-AGCTGGCCTAGTGATGATGTT-3’ 176 bp Antisense: 5’-TTCAGCACAAACAGGTTGCAG-3’
VEGF Sense: 5’-TGGAGCGTGTACGTTGGTG-3’ 153 bp Antisense: 5’-GCAACGCGAGTCTGTGTTTTT-3’
[image:3.612.90.292.172.438.2]β-actin Sense: 5’-GGACTTCGAGCAGGAGATGG-3’ 139 bp Antisense: 5’-CAGGAGCAAGGCTGGAAGA-3’
Figure 1. The expression of Notch1 mRNA. A: Elec-: Elec- Elec-trophoretic results of Notch1 mRNA. B: Relative ex-pression of Notch1 mRNA. Group A and D: Normal Human glioma U373 cells, Group B: U373 cells transfected with Notch1-NC, Group C and E: U373 cells transfected with Notch1-siRNA.
in group C and D. After 20 d, mice in group B and D were intravenously inject-ed with TMZ (12.5 mg/ml). The dose was 40 mg/kg/d and 3 d/time, totally 6 times (18 d). At the same time, group A and C were injected with the equal saline. The Animal experiment had been approved by Animal Ethics Committee of Shandong University.
Approximately 100 mm3 tumor was ob-
and 72 h, respectively. The cell growth curves were drew as shown in Figure 2A. Meanwhile, the cell growth inhibition rate was calculated as shown in Table 3, group A as the control group. The results showed that the cell proliferation
capacity of group C, D and E was significantly
lower than that of group A and B, and the
prolif-eration capacity of group E was significantly
lower than that of group C and D. These results indicated that the proliferation of the cells transfected with Notch1-siRNA was inhibited and was more sensitive to TMZ.
Determination of cell apoptosis rate
The apoptosis rate in each group was detected using Annexin V/PI double staining, and the
result of flow cytometry was shown in Figure 2B. B2 and B4 represented apoptosis rate on middle-late stage and early stage, respectively. The total apoptosis rate which was shown in
Table 4. The results showed that there was no difference in apoptosis rates between group A and B (P > 0.05). The apoptosis rates of the
cells in group C, D and E was significantly higher
than that in group A and B, and the apoptosis
rate of the cells in group E was significantly higher than that in group C and D (P<0.05). The
results suggested that cells transfected with
Notch1-siRNA were susceptible to apoptosis and were more sensitive to TMZ.
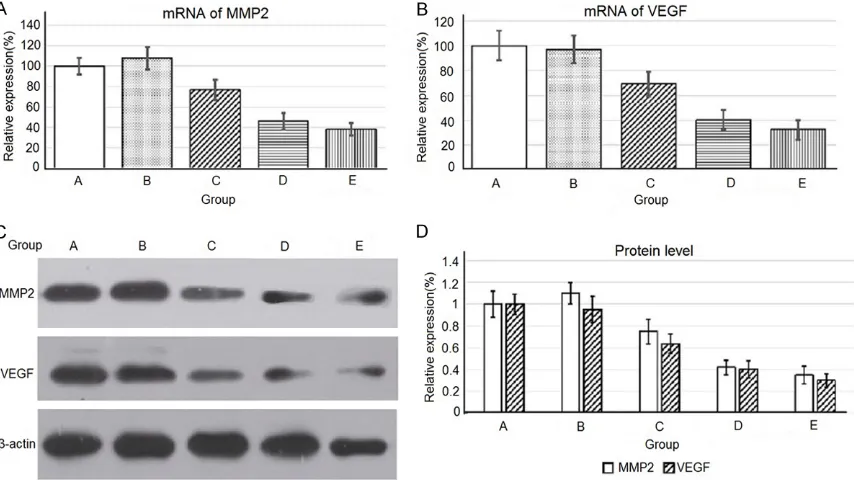
Detection of expression level of MMP2 and VEGF
Expression level of MMP2 and VEGF mRNA:
Relative expression of MMP2 and VEGF mRNA in different groups were detected by RT-PCR, as shown in Figure 3A and 3B, respectively. It can be found that the expression level of MMP2 and VEGF mRNA in group C, D and E were de- creased compared with group A, and the ex-
Expression level of MMP2 and VEGF Protein:
The expressions of MMP2, VEGF and internal control protein were detected by Western-blot. The SDS-PAGE gels was shown in Figure 3C
and the relative expression of MMP2 and VEGF protein was calculated using ImageJ2x, as shown in Figure 3D. Results showed that the expressions of MMP2 and VEGF protein in
group C, D and E decreased significantly com -pared with group A, and the expressions in
group E was significantly lower than those in
group C and D, which were consistent with the result of mRNA expression.
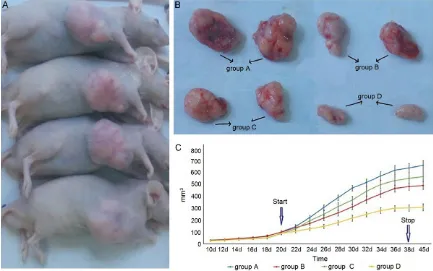
The tumor volume changes in nude mice
Implanted tumor Model of human glioma cells in nude mice was successfully established. The changes of tumor volume were shown in Figure 4C. The tumor weight and tumor inhibiting rate were shown in Table 5. The results showed that the tumor volume and tumor weight of group B,
C and D were significantly smaller than those of group A (P<0.05). The tumor volume and tumor weight of group D were significantly light -er than those of oth-er groups, with tumor inhib-iting rate more than 50%. The results showed that Notch1-siRNA reduced the tumorigenic ability of U373 cells in vivo and was more
sensi-tive to TMZ, which significantly inhibited the
growth of tumor in vivo.
Discussion
Notch1 signaling pathway is closely related to cell proliferation, differentiation and apoptosis. At present, abnormal expression of Notch1
receptor has been found to be associated with the development and progression of various human tumors, such as breast cancer, colon cancer, lung cancer, etc [8-10]; and studies
also confirmed the higher expression of Notch1
receptor in human glioma cells [7, 11]. Glioma
Table 3. The cell growth inhibition rate in each group
Time Group Statistics
A B C D E
24 h 0 0.5±0.1 5.9±1.1*,▲ 15.3±4.2*,▲ 17.2±3.9* F=163.082, P<0.001
48 h 0 -2.2±0.8 15.7±3.7*,▲ 30.9±7.4*,▲ 36.3±8.6* F=201.777, P<0.001
72 h 0 1.9±0.7 20.9±4.8*,▲ 37.6±9.2*,▲ 47.0±11.6* F=156.209, P<0.001
*represents significant differences compared with group A; ▲represents significant differ -ences compared with group E, (P<0.05). Group A: normal human glioma cells U373, Group B: cells transfected with Notch1-NC, Group C: cells transfected with Notch1-siRNA, Group D: normal human glioma cells U373+TMZ, Group E: cells transfected with Notch1-siRNA+TMZ.
pression in group E was lower than that in group C and D, indicating that
Notch1-siRNA could re- duce the expression of MMP2 and VEGF, and
is the most common neurological malignant tumor. Surgery invariably fails to remove the tumor completely due to its special location, strong invasiveness and less sensitivity to radiotherapy and chemotherapy, resulting in recurrence of glioma, high mortality rate and poor prognosis [12].TMZ is well tolerated and
is emerging as a feasible first-line choice in the
treatment of glioma and clinical studies
con-firmed that TMZ can improve the prognosis of
patients with glioma. But due to drug resis-tance, the chemosensitivity in tumor cells is reduced, causing the recurrence of tumor [13, 14]. Therefore, improving the chemosensitivity of anti-cancer drugs (such as TMZ) in glioma tumor cell is the key to the treatment of malig-nant glioma. RNA interference (RNAi)
technolo-gy can efficiently and specifically down-regulat -ed the expression of target genes, which was
an important method for gene function research and oncogene therapy [15]. With high silence
efficiency, the recombinant vector was suc -cessfully constructed and transfected with human glioma tumor U373 cell in this study. The result found that Notch1-siRNA could effec-tively down-regulate the expression of Notch1
and silence Notch1 through detecting the expression of Notch1 mRNA.
So far, multiple studies have shown that inhibi-tion of Notch1 expression in breast cancer [16, 17], colon cancer [18] and many other cancers would increase the sensitivity of tumor cells to chemotherapeutic drugs. Therefore, whether or not RNAi silencing Notch1 had an impact on the proliferation, apoptosis of U373 cells as well as on its sensitivity to TMZ needs to be further researched. In this study, the growth curve of
Table 4. Statistical results of total apoptosis rate of cells in each group
Group A B C D E Statistics
Apoptosis rate 9.8±1.6 11.5±2.7 28.7±4.8*,▲ 43.7±8.9*,▲ 52.2±12.6* F=210.642, P<0.001
[image:6.612.94.521.164.404.2]*represents significant differences compared with group A; ▲represents significant differences compared with group E, (P<0.05). Group A: normal human glioma cells U373, Group B: cells transfected with Notch1-NC, Group C: cells transfected with Notch1-siRNA, Group D: normal human glioma cells U373+TMZ, Group E: cells transfected with Notch1-siRNA+TMZ.
Figure 3. Relative expression of MMP2, VEGF. A: Relative expression of MMP2 mRNA in each group, B: Relative expression of VEGF mRNA in each group, C: SDS-PAGE gels of MMP2 and VEGF Protein in each group, D: Relative expression of MMP2 and VEGF protein. Group A: normal human glioma cells U373, Group B: cells transfected with Notch1-NC, Group C: cells transfected with Notch1-siRNA, Group D: normal human glioma cells U373+TMZ, Group E: cells transfected with Notch1-siRNA+TMZ. *, significant difference compared with group A; ▲, significant
cells showed that the proliferation of cells transfected with Notch1-siRNA was reduced compared to normal U373 cells, and the cells transfected with Notch1-siRNA+TMZ were sig
-nificantly suppressed, indicating that Notch1 -siRNA combined with TMZ could further inhibit the proliferation of glioma cells. Detection re- sults of apoptosis demonstrated that the apop-tosis rate of cells transfected with Notch1
-siRNA significantly increased compared to the
[image:7.612.89.522.72.343.2]implanted tumor also suggested that RNAi silencing Notch1 decreased tumorigenic ability of U373 cells in vivo, and the inhibiting tumor growth ability of Notch1-siRNA combined with TMZ was more evident than used TMZ alone. The results of this study were consistent with the results of Zhang et al [19]: Combined RNAi with chemotherapeutic drugs could enhance the sensitivity of tumor cell to chemotherapy and promote its apoptosis [20, 21].
Figure 4. Implanted tumor model in nude mice and determination of tumor volume. A: Implanted tumor model in nude mice, B: Collected intact tumor, C: Determination of tumor volume; Group A: inoculation of normal U373 cells and injection of saline, Group B: inoculation of normal U373 cells and injection of TMZ. Group C: inoculation of U373 cells transfected with Notch1-siRNA and injection of saline. Group D: inoculation of U373 cells transfected with Notch1-siRNA and injection of TMZ.
Table 5. Volume, weight and inhibition rate of implanted tumor Group Tumor volume (mm3) Tumor weight (g) Tumor inhibition rate
A 654.3±96.5 1.22±0.24 0
B 386.4±62.3*,▲ 0.78±0.18*,▲ 36.1±6.8*,▲
C 560.2±87.4*,▲ 1.02±0.20*,▲ 16.7±2.4*,▲
D 304.8±46.7* 0.60±0.16* 50.8±7.6*
Statistics F=123.034, P<0.001 F=58.769, P<0.001 F=154.283, P<0.001
*represents significant differences compared with group A; ▲represents significant differences compared with group E, (P<0.05). Group A: inoculation of normal U373 cells and injection of saline, Group B: inoculated of normal U373 cells and injection of TMZ. Group C: inoculated of U373 cells transfected with Notch1-siRNA and injection of saline. Group D: inoculated of U373 cells transfected with Notch1-siRNA and injection of TMZ.
normal U373 cells. The ap- optosis rate of cells trans-fected with Notch1-siRNA+ TMZ was significantly high -er than that of cells trans-fected with Notch1-siRNA
(P<0.05). The results sug -gested that RNAi silencing
[image:7.612.90.390.436.515.2]In addition, the results in the study found that the expressions of MMP2 and VEGF in U373 cells transfected with Notch1-siRNA were lower than those of normal U373 cells, and the ex- pression of MMP2 and VEGF in cells transfect-ed with Notch1-siRNA+TMZ decreased expo -nentially/sharply. Therefore, the pathway was presumed: Notch1-siRNA→inhibition MMP2 and VEGF expression→inhibition proliferation
and invasion and induction apoptosis of glioma
cell→increasing the sensitivity of glioma cell to
TMZ.
In conclusion, Notch1 played an important role in the proliferation, invasion and apoptosis of glioma. In vitro or in vivo, RNAi silencing Notch1
couldeffectively inhibit the proliferation of glio-ma cells, induce its apoptosis, inhibit its tumori-genic ability and upgrade its sensitivity to TMZ, probably through reducing the expression of MMP2 and VEGF. Therefore, RNAi silencing
Notch1 in glioma cells increased the sensitivity to chemotherapy, improving the chemothera-peutic effect.
Disclosure of conflict of interest
None.
Abbreviations
RNAi, RNA interference; TMZ, Temozolomide; MMP2, Matrix MetalloProteinase-2; VEGF, Vas- cular Endothelial Growth Factor; NC, Negative Control; OD, Optical Density.
Address correspondence to: Guangyu Zhao, Asso- ciate Chief Physician, Neurosurgery, Shandong Pro- vincial Hospital Affiliated to Shandong University, 324 Weft five Road, Jinan 250021, Shandong Pro- vince, China. Tel: +8615036129275; E-mail: zhao-gy_sjwk@163.com
References
[1] Jiang T, Wang RZ, Ma WB. Glioma treatment technology and progress. Beijing: People’s Medical Publishing House, 2011.
[2] Myong N. Altered expressions of Notch-1 sig-naling proteins and beta-catenin in progres-sion of carcinoma in situ into squamous carci-noma of uterine cervix. Indian J Pathol Microbiol 2017; 60: 21-26.
[3] Qiu M, Peng Q, Jiang I, Carroll C, Han G, Rymer I, Lippincott J, Zachwieja J, Gajiwala K and Kraynov E. Specific inhibition of Notch1
signal-ing enhances the antitumor efficacy of chemo-therapy in triple negative breast cancer through reduction of cancer stem cells. Cancer Lett 2013; 328: 261-270.
[4] Liu Y, Yang C, Huang M, Yeh C, Wu AT, Lee Y, Lai T, Lee C, Hsiao Y and Lu J. Cisplatin selects for multidrug-resistant CD133+ cells in lung ade-nocarcinoma by activating Notch signaling. Cancer Res 2013; 73: 406-416.
[5] Ulasov IV, Nandi S, Dey M, Sonabend AM and Lesniak MS. Inhibition of Sonic hedgehog and Notch pathways enhances sensitivity of CD133+ glioma stem cells to temozolomide therapy. Mol Med 2011; 17: 103-12.
[6] Zhang MF, Guo Y, Qi YL, et al. The effect of RNAi silencing Notch1 on the proliferation of human glomia cell U250. Chinese Pharmaco-logical Bulletin 2010; 26: 199-203.
[7] Purow BW, Haque RM, Noel MW, Su Q, Burdick MJ, Lee J, Sundaresan T, Pastorino S, Park JK and Mikolaenko I. Expression of Notch-1 and its ligands, Delta-like-1 and Jagged-1, is critical for glioma cell survival and proliferation. Can-cer Res 2005; 65: 2353-2363.
[8] Wael H, Yoshida R, Kudoh S, Hasegawa K, Ni-imori-Kita K and Ito T. Notch1 signaling con-trols cell proliferation, apoptosis and differen-tiation in lung carcinoma. Lung Cancer 2014; 85: 131-140.
[9] Purow B. Notch inhibition as a promising new approach to cancer therapy. Adv Exp Med Biol 2012; 305-319.
[10] Al-Hussaini H, Subramanyam D, Reedijk M and Sridhar SS. Notch signaling pathway as a ther-apeutic target in breast cancer. Mol Cancer Ther 2011; 10: 9-15.
[11] Zhao N, Guo Y, Zhang M, Lin L and Zheng Z. Akt-mTOR signaling is involved in Notch-1-me-diated glioma cell survival and proliferation. Oncol Rep 2010; 23: 1443-7.
[12] Haar CP, Hebbar P, Wallace GC, Das A, Vander-grift WA, Smith JA, Giglio P, Patel SJ, Ray SK and Banik NL. Drug resistance in glioblastoma: a mini review. Neurochem Res 2012; 37: 1192-1200.
[13] Haicheng Y. Ecperimental study on biological behavior and chemosensitivity of human glio-ma cells by RNAi gene silencing PTTG1. South-ern Medical University 2015.
[14] Dontenwill M, Martin S and Janouskova H. In-tegrins and p53 pathways in glioblastoma re-sistance to temozolomide. Front Oncol 2012; 2: 157.
[15] Zhou Y, Zhang C and Liang W. Development of RNAi technology for targeted therapy-a track of siRNA based agents to RNAi therapeutics. J Control Release 2014; 193: 270-281.
hu-man breast cancer. Chinese Med J Peking 2014; 127: 442-447.
[17] Zang S, Chen F, Dai J, Guo D, Tse W, Qu X, Ma D and Ji C. RNAi-mediated knockdown of Notch-1 leads to cell growth inhibition and en-hanced chemosensitivity in human breast can-cer. Oncol Rep 2010; 23: 893-9.
[18] Akiyoshi T, Nakamura M, Yanai K, Nagai S, Wada J, Koga K, Nakashima H, Sato N, Tanaka M and Katano M. γ-Secretase inhibitors en-hance taxane-induced mitotic arrest and apop-tosis in colon cancer cells. Gastroenterology 2008; 134: 131-144.
[19] Zhang LK, Zang N, Lin L, et al. Notch1 regu-lates stemness and chemotherapeutic sensi-tivity of human glioma U251 cells. Chinese Journal of Pathophysiology 2015; 1943-1949.
[20] Jakubowicz J, Blecharz P, Skotnicki P, Reinfuss M, Walasek T and Luczynska E. Toxicity of con-current chemoradiotherapy for locally ad-vanced cervical cancer. Eur J Gynaecol Oncol 2013; 35: 393-399.