Abstract—Statistical process control (SPC) is one of the important tools in quality control (QC). Commercial software packages are available to implement SPC. However, they are costly and not necessary customize to specific need of each production process. Moreover, they might be difficult for the field operator with limited knowledge of SPC to use the commercial software. In this paper, a visual basic application was developed specifically to meet the demand of a case study company in order to assist the implementation of SPC. The case study company is the manufacturer of metal frame for actuator. The software are able to construct control chart, both chart and chart. These charts are common tools used to determine whether the production process is in control i.e. no assignable causes exist. Moreover, the program is able construct histogram. The software is designed to store process data in SQL database which can be access online. The result indicated that as the program is configured specifically to the process, it can help operator to implement SPC easily even with limited knowledge of SPC.
Keywords—Statistical process control, Control chart, chart and chart
I. INTRODUCTION
UALITY control (QC) is an important function in factory as it deals with product inspection before the product was shipped to customers. Statistical process control (SPC) is one of the tools widely used in QC to monitor whether the production process is in control through the use of statistical control chart. This paper focused on the implementation of SPC in the case study company which is a manufacturer of electronics parts. A particular product investigated was the metal frame for actuator which is a critical part in hard disk drive product. SPC in the case study company is currently implemented using commercial software package. This software is used to analyse production process data with control chart and histogram. However, only a few computers are installed with this software because software license is expensive. Moreover, the commercial software is not design specifically to the process hence sometimes difficult for the operator with limit knowledge of SPC. This research aims to develop software for control chart and histogram analysis that designed specifically to previously mentioned process by using Visual Basic. This software helps operators in quality
1The author is with the Industrial Engineering Department, Chiangmai
University, Chiangmai, Thailand (e-mail: [email protected]).
2The author is with the Industrial Engineering Department, Chiangmai
University, Chiangmai, Thailand (e-mail: [email protected], [email protected]).
control division to construct and analyze control chart and calculate process capability. The software also provide warning if the process is out of control.
Visual basic has been used widely by researchers to develop various applications. Visual basic program is a computer language in visual basic studio 2005. It is a tool for software development from Microsoft. The advantages of visual basic are for example, visual basic is an advance object oriented programing, it use less code for writing and it support for Microsoft Window and SQL server. Moreover, there have been a number of reports on the success of software development using Visual Basic. For example, Patane and Ferrari [1] use a visual basic computer program for interactive and automatic earthquake waveform analysis. Carr [2] presents a visual basic program for principal components transformation of digital images, Argyris et.al. [3] present a Computer program in Visual Basic language for simulation of meshing and contact of gear drives and its application for design of worm gear drive. Nelson [6] presents a visual basic program for flexible and interactive processing of ion-microprobe data acquired for quantitative trace element, Ekneligoda and Henkel [5] presents a visual basic program to calculate spatial properties of lineaments, Wang et.al [7] present a visual basic program for simulating distribution and atmospheric volatilization of soil fumigants applied through drip irrigation, Poppe and Eliason [8] presents a visual basic program to plot sediment grain-size data on ternary diagrams, Balbas et.al. [9] present a visual basic code for optimal forecasting of financial time series and Kumar et.al. [10] present a program in visual basic for predicting haulage and field performance of 2WD tractors.
Due to the previously mentioned advantages and also a number of successful reported Visual basic studio 2005 was chosen as a development tool for the SPC software of the case study company. This software is capable of construction control chart and histogram for quality inspection data graphically. The software will be linked to the case study company database system. SQL server was used for database design.
II. BACKGROUND
A. Chart
The -R control chart is a common tool used in industry to control process mean. As a result, the -R control chart has become a topic of interest to researcher. For example, Senturk et.al. [14] use fuzzy set theory to set control limit of the -R
Visual Basic Application for Statistical Process
Control: A Case of Metal Frame for Actuator
Production Process
Wimalin Laosiritaworn
1, Tunchanit Bunjongjit
2control chart. Fuzzy control limits provide a more accurate and flexible evaluation.
-R control chart should be used with data that are normally distributed. Parameter is the average of sample and
is the grand average of sample. They can be calculated as follows;
, (1) Parameter n is a sample size, parameter x is the value of sample measurement. Parameter m is the number of sample measurement. Then the range (R) is calculated from the different between largest and smallest value of sample using the following formula;
R = x max – x min, (2)
The control limits of the x chart are calculated from
, , (3)
The control limits of the R chart are calculated from , , (4) Parameter A2, D3 and D4 are the constants for construction
of x and R charts. B. Chart
The -S control chart is calculated from standard deviation. Itis popular for control process mean as reported by a number of publications. For example, Takemoto et.al. [12] proposed the multivariate -S control chart to monitor process mean vector and covariance matrix simultaneously by using approximation procedure for determining the control limit of multivariate -S control chart and for evaluating its power. Shamsuzzaman et.al. [13] proposed the -S control chart apply to the -S M control chart for optimizing total cost because -S M control chart decrease sample size. -S control chart should be used when sample size is more than 10. Parameter S is the standard deviation and is the average of standard deviation. Their formulate are;
∑ , (5)
The control limits of the x chart are calculated from
, , (6) The control limits of the s chart are calculated from
, , (7) Parameter A3, B3 and B4 are the constants for construction
of x and s charts.
C. Histogram
Histogram is a bar chart display the frequency of data. The horizontal axis of histogram is the data bin of observed value arranged from minimum bin to maximum bin. The vertical axis is the frequency of collected data. Histogram can be used to analyse the shape and distribution of data of known variance. Histogram can be used to check abnormal data, check out of specification, calculate process capability and monitoring process. In order to draw histogram, firstly the range of data has to be calculated from the different between maximum and minimum data. Then number of data(a), observed bin(b) have to be specified. Then the number of bin(K) and bin width (W) can be calculated as follows;
K √a, W RK (8)
Then the upper class interval and lower class interval are calculated from;
Upper class interval of b= [maximum value of (b-1)
+ minimum value of b]/2 (9)
Lower class interval of b= [maximum value of b
+ minimum value of (b+1)]/2 (10)
The Final Stepis to drawhistogram by disperse frequency of data.
Process capability can be measure from process potential capability (Cp) and process performance capability (Cpk) which
can be calculated using the following formula;
, , , (11)
Where, σ is the standard deviation. Both process potential capability and process performance capability with value more than 1.33 indicated good capability of the process.
D. Visual Basic Application
Visual Basic language evolves from “Beginner’s All-Purpose Symbolic Instruction Code”. Later on, Microsoft developed Visual Basic from Basic and makes it more graphical. Visual basic language has the same syntax as visual basic.NET. Graphic of visual basic is the coordinate system about x and y. Many researcher use visual basic application for building specification software. For example, Chen [4] present MRPM program, which is an integration of three Visual Basic program for implementing mineral resource potential mapping with the above three models. The software is a user-friendly interactive computer program executable directly on Window system. Wang [7] use a graphical user interface program in visual basic to simulate distribution and volatilization of soil fumigants when applied through subsurface drip irrigation and the program provides an intuitive user interface by linking databases with default soil and chemical properties to predict subsurface distribution patterns.
III. METHODOLOGY
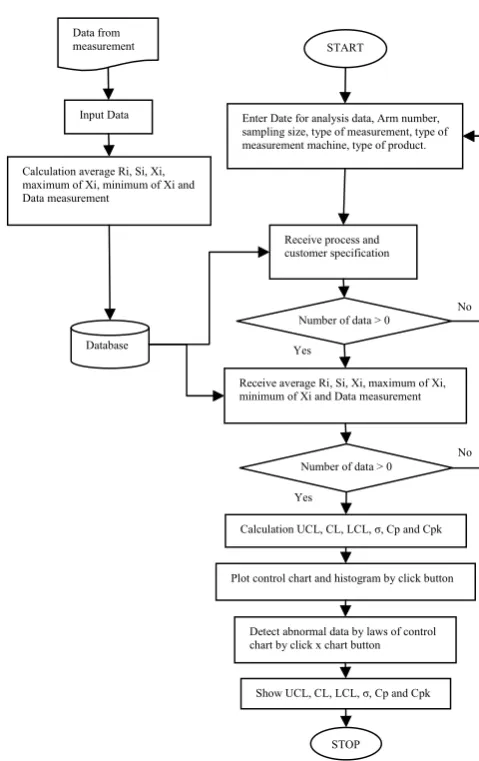
Figure 1 is the flow chart of SPC software First, inspector input data into the database manually. Then, this data will be retrieved from the database, which can be access from all computers in the factory. The software process is as follows:
Step one: An operator inputs measured data into the database.
Step two: An operator input key data, such as the data analysis date, the arm number, sampling size, type of measurement, type of machine used for measurement and the type of product, plus a code number, into a control chart and histogram software for call data from database.
Step three: The software retrieves data from the database. If the data is shown as ‘zero’ then the operator must input the key details again.
Step four: The software retrieves data from the database. The data shown is: an average of xii, an average of Ri, an
average of Si, a maximum of xi, a minimum of xi and the
measurement data. If the data is shown as zero, the operator must key in the important data analysis data again.
Step five: The software calculates the statistical process control, which consists of an upper control limit, a center line, a lower control limit, a process potential capability and a process performance capability.
Step six: The software calculates a value in order to plot a control chart.
[image:3.595.311.551.76.457.2]Step seven: The software detects abnormal data by using the laws within the control chart.
Fig. 1 Flow chart of control chart software
IV. RESULT AND DISCUSSION
A. Database Design with SQL server
The software must transfer data to the database when the operator measures the product, so the database is very important for this research. Each industry has a different system. This research is about metal frames for an actuator factory, so the programmer must understand the system in place at this factory.
Yes
No
Yes
No Data from
measurement
Input Data
Database
START
Calculation average Ri, Si, Xi, maximum of Xi, minimum of Xi and Data measurement
Enter Date for analysis data, Arm number, sampling size, type of measurement, type of measurement machine, type of product.
Receive process and customer specification
Plot control chart and histogram by click button
Detect abnormal data by laws of control chart by click x chart button
Show UCL, CL, LCL, σ, Cp and Cpk Number of data > 0
Receive average Ri, Si, Xi, maximum of Xi, minimum of Xi and Data measurement
Number of data > 0
Calculation UCL, CL, LCL, σ, Cp and Cpk
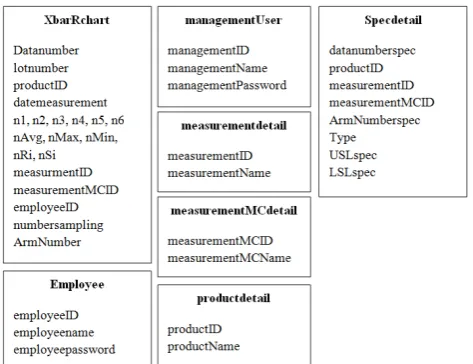
Fig. 2 Database design of metal frame for actuator factory by SQL server
Figure 2 shows the design of the database. The ‘XbarRchart’ table shows the data inputted into the database such as the: data number, lot number, product ID, date of measurement, data sampling, measurement ID, employee ID, sampling size and arm number and preliminary calculations such as the: average of xi, maximum of xi, minimum of xi, Ri
(minimum and maximum range), Si (standard deviation). The
‘Employee Table’ shows a list of employees that measured the product in another measurement machine. The ‘Management User Table’ is a list of those highly responsible employees who have access to and the ability to correct data in the database. The ‘Measurement Detail Table’ contains the types of measurement including the identification number and name of the measurement. The ‘Measurement MC Detail Table’ shows the type of machine or instrument used for measurement and includes an identification number and the name of the measurement device. The ‘Product Detail Table’ contains details about the type of product, including the identification number and the name of the product. The ‘Spec Detail Table’ shows the specification of the product each customer required
.
B. Input Data Form
The ‘Data Input Form’ is designed for operator use. The user must input the arm number, sample size, type of measurement and the type of machine into the software. Before storing the data on to the database, the program calculates the maximum and minimum value, the range value, average value and standard deviation. They had kept in database for manage database easily and for the next calculation.
[image:4.595.303.549.83.233.2]Fig. 3Input form can input six arms and six sample sizes.
Figure 3 shows the Data Input Form. In this window the sample size is between two and six. This sample size depends on the type of product.
C. Output Data and Analysis Form
This software must create a ‘Data Output and Analysis Form’ in order to calculate a chart, a chart and a histogram. It must also create a database, identify abnormal data in the control chart and show the lot number for items outside of control; these being the abnormal items within the control chart.
Fig. 4Example of histogram from the software
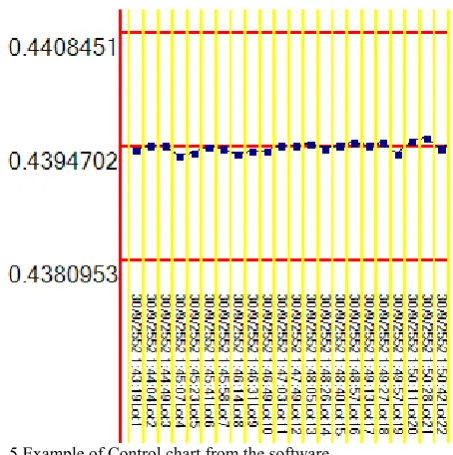
[image:4.595.51.288.84.266.2] [image:4.595.309.551.379.509.2]Fig. 5 Example of Control chart from the software
Figure 5is an example of control chart obtained from the software. This control chart have upper control limit at 0.4408451, centerline at 0.4394702 and lower control limit at 0.4380953. It shows no data that is out of the control limits. The ‘30/9/2552’ refer to November 30 in 2009, the ‘1:43:19’ refer to time, the ‘Lot1’ refer to lot number one. The control chart also shows the date of quality control measurement, and it measures four times per lot. It can show the customer specification and the production process specification in a graph. Another chart can be opened by clicking a button within the software.
D. Laws of control chart
The ‘Control Laws Chart’ is important for process control, because it can analyze the data and detect lots with low product quality. The old process of quality control analyzes abnormal data by looking at the control chart, something which is time-consuming. Therefore, this software makes a code from the basic visuals to automatically detect abnormal data. Parameter z1to z9 is the average data of the process, UCL is the upper control limit, LCL is the lower control limit and CL is the center line. The Basic Visual Code is shown in Table 1.
TABLEI
CODE IN VISUAL BASIC FOR LAWS IN CONTROL CHART
Laws CODE OF VISUAL BASIC
6 points Increase z1<z2 and z2<z3 and z3<z4 and z4<z5 and z5<z6
6 points Decrease z1>z2 and z2>z3 and z3>z4 and z4>z5 and z5>z6
9 points
Center line to +3σ z1>CL and z2>CL and z3>CL and z4>CL and z5>CL and z6>CL and z7>CL and z8>CL and z9>CL 9 points
Center line to -3σ z1<CL and z2<CL and z3<CL and z4<CL and z5<CL and z6<CL and z7<CL and z8<CL and z9<CL Out of control z1>UCL or z1<LCL
From Table 1, an increase or decrease of six points is important, because it means the data may be outside of
control. The law of nine points is important for this factory, because it reflects customer demand. Being out of control is dangerous for the production process. Sometimes, the value of the data may show it at out of control, but it is actually still within the specification of the customer, so the product is not in actual fact a defect.Therefore, this depends on the decision of an engineer.
V. CONCLUSION
A control chart and histogram software was developed from Visual Basic to calculate and show graphically the control chart and histogram. This software is used in the quality control division. The weak point of this software is that the data must be less than one hundred. The specification of the software is to retrieve data by the date of measurement range. This software can make an chart, an chart and a histogram to calculate Cp andCpk for the process efficiency to
be used by the engineer in a metal frame actuator factory. The program receives data by linking databases. The database used for this research was developed from an SQL server, because it supports Visual Basic program development and Microsoft Windows. Another reason of using an SQL server is that this factory has a license for an SQL server 2000 and for Microsoft Windows XP. The objective of this research is to make software that can be used and operated conveniently. Potential benefit of the software to the case study company includes; decrease cost for buying commercial software package because software license is expensive. Moreover, a control chart and histogram software is design specifically to the process hence easy for the operator with limit knowledge of SPC to use.
ACKNOWLEDGMENT
This project is financially supported by the Industry/University Cooperative Research Center )I/UCRC (in HDD Component, the Faculty of Engineering, Khon Kaen University and National Electronics and Computer Technology Center, National Science and Technology Development Agency.
REFERENCES
[1] Domennico Patane and Feruccio Ferrari, “Seismplo A Visual Basic computer program for interactive and automatic earthquake waveform analysis”, Computer & Geosciences Vol.23, No.9, pp. 1005-1012, 1997. [2] Jame R. Carr, “A Visual Basic program for principal components
transformation of digital images”, Computer & Geosciences Vol.24, No.3, pp.209-218, 1998.
[3] J. Argyris, M. De Donno, F.L. Litvin, “Computer program in Visual Basic language for simulation of meshing and contact of gear drives and its application for design of worm gear drive”, Coput. Methods Appl. Mech. Engrg. 189 pp.595-612, 2000.
[4] Yongliang Chen, “MRPM three visual basic program for mineral resource potential mapping”, Computer & Geosciences 30 pp.969-983, 2004.
[5] Thushan C. Ekneligoda and Herbert Henkel, “The spacing calculator software A Visual Basic program to calculate spatial properties of lineaments”, Computer & Geosciences 32 pp.542-553, 2006.
[7] D.Wang, J.M. He and J.A. Knuteson, “A Visual Basic program for simulating distribution and atmospheric volatilization of soil fumigants applied through drip irrigation”, Computer and Electronics in Agriculture 56 pp.111-119, 2007.
[8] L.J Poppe and A.H. Eliason , “A Visual Basic program to plot sediment grain-size data on ternary diagrams”, Computer & Geosciences 34 pp.516-565, 2008.
[9] Alejandro Balbas, Beatriz Balbas, Inna Galperin and Efim Galperin, “Deterministic regression model and visual basic code for optimal forecasting of financial time series”, Computers and Mathematics with Applications 56 pp.2757-2771, 2008.
[10] Ranjeet Kumar, K.P. Pandey , “A program in Visual Basic for predicting haulange and field performance of 2WD tractors”, Computers and Electronics in Agriculture 67 pp.18-26, 2009.
[11] C.R. chen, H.s. Ramaswamy, “Visual Basics computer simulation package for thermal process calculation”, Chemical Engineering and Processing 46 pp.603-613, 2007.
[12] Yasuhiko Takemoto and Ikuo Arizono, “A study of multivariate x, s control chart based on Kullback-Leibler information”, Int J Adv Manuf Technol 25 pp.1205-1210, 2005.
[13] M. Shamsuzzaman, Zhang Wu and M. Reaz-us Salam Elias, “Design of
x&s control chart with optimal manpower deployment”, Computer &Industrial Engineer 56 pp.1589-1596, 2009.
[14] Sevil Senturk and Nihal Erginel, “Development of fuzzy x- r and x- s control chart using α cuts”, Information Science 179 pp.1542-1551, 2009.
[15] Xin Lua, Jihong Guan, “A new approach to building histogram for selectivity estimation in query processing optimization”, Computer and Mathmatics with Application 57 pp.1037-1047, 2009.
[16] V.V. Strelkov, “A new similarity measure for histogram comparison and its application in time series analysis”, Pattern Recognition Letters 29 pp.1768-1774, 2008.
[17] Zhen He, Byung Suk Lee and X.Sean Wang, “Proactive and reactive multi-dimensional histogram maintenance for selectivity estimation”, The journal of systems and software 81pp.414-430, 2008.
[18] Olivier Strauss , “Quasi-continuous histograms”, Fuzzy Set and System 160 pp.2442-2465, 2009.
Wimalin Laosiritaworn, PhD, She received her PhD in Manufacturing Engineering and Operations Management from The University of Nottingham, United Kingdom. She received her MSc in Engineering Business Management from The University of Warwick, United Kingdom. She is currently an assistant Professor in the Department of Industrial Engineering at Chiangmai University.