Abstract— Periodic stimuli are known to induce chaotic oscillations in the squid giant axon for a certain range of frequencies. This behaviour is modelled by the Hodgkin-Huxley equations when a periodic stimulus is applied. The responses resulting from chaotic neural dynamics have irregular inter-spike intervals and fluctuating amplitudes. These characteristics are absent in steady state responses of the Hodgkin-Huxley neuron which are generated using a constant current stimulus. It is known that firing time information is adequate to estimate similarity of steady state responses; however, in the presence of chaotic oscillations, similarity between neural responses cannot be estimated using firing time alone. The results discussed in this paper present a quantification of the similarity of neural responses exhibiting chaotic oscillations by using both amplitude fluctuations and firing times. We relate the similarity thus obtained between two neural responses to their respective stimuli. Identical stimuli have very similar effect on the neural dynamics and therefore, as the temporal inputs to the neuron are the same, the occurrence of identical chaotic patterns result in a high estimate of similarity for the neural responses. Estimates of similarity are compared for periodic stimuli with a range of inter-spike intervals.
Index Terms— chaotic oscillations, periodic stimuli, neural response comparison, chaotic dynamics, spike trains.
I. INTRODUCTION
The non-linear dynamics of a neuron have been studied both theoretically and physiologically in recent years to extend the understanding of its underlying mechanism [1-13]. The spikes or action potentials are evoked when an external stimulus is applied to the neuron. It is thought that either the firing rate or firing time of individual spikes carries specific information of the neuronal response [14-16]. This holds for all steady state responses of a neuron when a constant current stimulus is applied. However, on injection of a periodic or sinusoidal stimulus the steady state response is no longer preserved [17-26]. The self-excited oscillations of a Hodgkin-Huxley (HH) neuron [27] may become chaotic when a sinusoidal stimulus is applied with proper choices of
Manuscript received March 18, 2010. Chaotic Oscillations in a Hodgkin-Huxley Neuron – Quantifying Similarity Estimation of Neural Responses
Mayur Sarangdhar is currently a PhD student within the Neural, Emergent and Agent Technologies Group, Department of Computer Science, University of Hull, Hull, East-Yorkshire, HU6 7RX, UK (phone: 01482 465253; e-mail: M.Sarangdhar@ 2006.hull.ac.uk).
C. Kambhampati is currently a Reader in the Department of Computer Science, University of Hull, Hull, East-Yorkshire, HU6 7RX, UK. (e-mail: [email protected]).
magnitude and frequency [20-21, 25-26]. Physiological experiments on squid giant axons [18-19] and Onchidium neurons [22] have confirmed the occurrence of chaotic oscillations. This paper quantifies the similarity estimated between neural responses exhibiting chaotic oscillations. B using the amplitude distribution and the firing times of a neural spike train to estimate similarity.
The nature of a periodic stimulus is responsible to induce chaotic oscillations in a biological neuron. Irregular inter-spike interval (ISI) and fluctuating amplitudes are the characteristics of chaotic oscillations absent in steady state responses generated by constant current stimuli. Information on stimuli similarity can be derived from neural response comparison. Firing time information is adequate to estimate similarity of steady state responses; however, in the presence of chaotic oscillations or when the amplitudes of a neural response fluctuate, amplitude and firing time collectively reflect the true dynamics of a neuron and therefore both should feature in similarity estimation [28-30]. Similarity estimation is based on the principle of relative coincidences without coincidences by chance [31-32]. The amplitudes a neural response exhibiting these chaotic oscillations fit a Normal distribution and it is possible to determine amplitude coincidences using the properties of Normal distribution. Similarity between these responses can be estimated by a composite similarity measure based on amplitude and firing time coincidences. Results show that similarity based on this composite approach is mathematically realisable than similarity based on firing times or amplitudes alone. It is observed that similar periodic stimuli induce similar chaotic patterns in the neural responses and therefore the resulting neural responses have a high degree of similarity. The effect of distinct periodic stimuli is evident in the dissimilar chaotic patterns displayed in the responses. It can be derived from these results that chaotic responses with high similarity originate from very similar periodic stimuli. This agrees in principle that initial representation of a neural response is unique to the stimulus [9, 33].
In this paper, Hodgkin-Huxley (HH) neural responses generated by varying the Inter-Spike-Interval (ISI) of periodic stimuli are compared to estimate similarity. It is observed that estimating similarity of neural responses exhibiting chaotic dynamics requires knowledge of both firing times and amplitude distribution. A comparison of similarities estimated by a) an approach considering firing times alone and b) an approach based on firing times and amplitude distribution shows that fluctuations induced by periodic stimuli are differentiated better by considering
Chaotic Oscillations in a Hodgkin-Huxley
Neuron – Quantifying Similarity Estimation of
Neural Responses
amplitude distribution in addition to firing time information. This paper quantifies the similarity thus estimated and it is observed that it is approximately equal to the percentage number of absolute coincidences. Absolute coincidences are the number of spikes that coincide with respect to both firing times and amplitudes with a pre-defined precision .
II. NEURONAL MODEL AND SYNAPSE
A. The neuron model
The computational model and stimulus for an HH neuron is replicated from [15]. The differential equations of the model are the result of non-linear interactions between the membrane voltage V and the gating variables m, h and n for
Na andK and Cl .
i L L K K Na Na I V V g V V n g V V h m g dt dv C ) ( ) ( ) ( 4 3 (1) n n n h h h m m m n dt dn h dt dh m dt dm ) ( ) ( ) ( (2) 80 / ) 65 ( 10 / ) 35 ( 18 / ) 65 ( 10 / ) 55 ( 20 / ) 65 ( 10 / ) 40 ( 125 . 0 ] 1 /[ 1 4 ] 1 /[ ) 55 ( 01 . 0 07 . 0 ] 1 /[ ) 40 ( 1 . 0 V n V h V m V n V h V m e e e e V e e V (3)
The variable V is the resting potential of the membrane and Na
V , VKand VLare the reversal potentials of theNa , K
channels and leakage. The values of the reversal potentials . 5 . 54 , 77 ,
50mV V mV V mV
VNa K L The conductance
for the ionic channels are 2 / 120mS cm
gNa , gK 36mS/cm2
and 2
/ 3 .
0 mS cm
gL . The capacitance of the membrane is
2 / 1 F cm
C .
B. The synaptic current
An input spike train give by [34] is considered to generate the pulse component of the external current.
n f a
i t V t t
U() ( ) (4) where,
f
t is the firing time and is defined as
T
t
t
n f nf( 1) ( ) (5) 0
) 1 ( f
t (6)
T represents the ISI of the input spike train and can be varied to generate a different pulse current. The spike train is injected through a synapse to give the pulse currentIP.
) (
)
( a syn
n
f syn
P g t t V V
I (7)
syn syn V
g , are the conductance and reversal potential of the synapse. [32] define the function as
), ( ) / ( )
(t t e t/ t (8)
where, is the time constant of the synapse and (t)is the Heaviside step function. Va 30mV, syn 2ms ,
2
/ 5 .
0 mS cm
gsyn andVsyn 50mV.
C. The total external current
The total external current applied to the neuron is a combination of static and pulse component
P S i I I
I (9)
where, ISis the static and Ipis the pulse current, is the random Gaussian noise with zero mean and standard deviation 0.025.
It is understood that distinct sinusoidal stimuli induce different chaotic oscillations which result in dissimilar neural responses [28-30].
III. SIMILARITY ESTIMATION USING
The similarity between neural responses exhibiting chaotic oscillations can be determined using chaotic . chaotic estimates similarity through differences between the actual coincidences Npcoinc and the expected number of coincidences Npcoinc relative to the average number of spikes in the two spike trains. The similarity is normalised between 0 and 1 by a normalising factor chaotic.
chaotic pcoinc pcoinc chaotic N N N N 1 ) ( 2 1 2 1 (10)
where Npcoinc is the number of conditional coincidences (amplitude coincidence given firing time coincidence) between the two spike trains, Npcoinc is the conditional mean (average number of amplitude coincidences given firing time coincidences) and chaotic is the normalising factor for chaotic oscillations. is the number of spikes in the train 1, is the number of spikes in train 2. This formulation is based on [32] where similarity based on firing times was estimated through relative number of coincidences without coincidences by chance.
Let 1and 2be the normal distributions for the spike trains and with means 1 and 2and respective standard deviations 1 and 2. The mean probability of coincidence of any amplitude from 2with an amplitude from 1can be approximated using the mean of 2.
1 1 2 mean z (11) table Z from table Z from mean mean
mean
p
z
z
p
z
(
)
[
]
[
(
1)]
any two neural responses generated by periodic stimuli is therefore zmeanN1. If the rate of fire of is and the precision for coincidence is , then the expected number of coincidences are given by
mean pcoinc N z
N 2 2
(13) and the normalising factor chaotic normalises the estimate of similarity to a value between 0 (dissimilarity) and 1(exact match)
mean
chaotic 1 2 z (14) Similarity on the basis of firing times alone can be determined from (10) by omitting the amplitude considerations inNpcoinc,Npcoinc and chaotic. This result is consistent with [35].
IV. RESULTS
Due to the nature of periodic stimuli and chaotic oscillations, estimating similarity between neural responses on the basis of firing times is inaccurate in view of a) false positives and b) incorrect inference about stimuli similarity. Similarity estimation is done for neural responses by varying the stimulus ISI ( ) within a limit of 2ms. Stimulus is varied between 14ms-16ms (set I), 13ms-15ms (set II) and 15ms-17ms (set III) and similarity is estimated by comparing neural responses with reference responses for each set. The reference responses are generated by fixing the ISI( ) for the sets at 15ms for set I, 14ms for set II and 16ms for set III. This section compares the similarity estimated by coincidence factor ( ) and .
A. Comparison of and , Set I, 14ms-16ms represents the difference between the stimulus ISI ( ) and a reference ISI . A positive or negative change in indicates that neural stimuli have dissimilar ISI and their respective influence on neural dynamics is unique to the applied stimulus. The neural responses with underlying chaotic oscillations require both amplitude fluctuations and irregular firing times considered to estimate similarity. It is observed that false positive (circled) obtained by coincidence factor at is eliminated (fig. 1). The overall similarity between pairs of neural responses is reduced in comparison with due to amplitude fluctuations being considered in addition to firing time information.
Fig.1: Similarity of neural responses generated by periodic stimuli with and . represents the similarity estimated by coincidence factor and is the similarity based on firing times and amplitudes coincidences. The incorporation of amplitude fluctuations to estimate similarity helps eliminate false positive (circled) at .
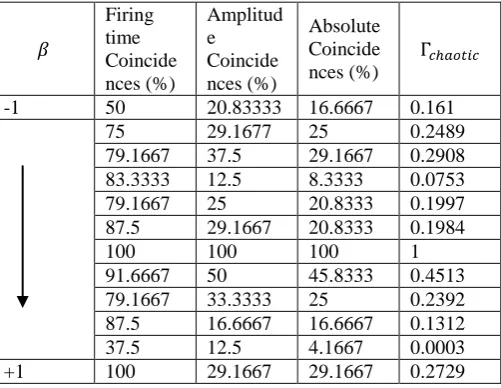
Table (1) gives a clear comparison of firing time and amplitude coincidences. For , half of the neural spikes from and coincide with a precision of 2ms. However, only 20.83% of the amplitudes coincide with a precision 2mV. This is characteristic of neural responses exhibiting chaotic oscillations – a change in the stimulus reflects on the neural dynamics. Absolute coincidences are conditional coincidences i.e. number of amplitude coincidences given that corresponding firing times coincide. The number of absolute coincidences is 16.67%, which implies that out of all the neural response pairs, only 16.67% exhibit amplitude and firing time coincidences. The similarity estimated by is 0.161. It appears to accurately reflect the absolute coincidences. In addition, also considers coincidences by chance or expected coincidences which renders the similarity estimated by
[image:3.595.303.554.334.528.2]unique to a pair of neural responses.
Table 1: Firing time, amplitude and absolute coincidences for various values of in set I. represents the similarity between pairs of neural responses. Firing time coincidence precision is 2ms, amplitude coincidence precision is 2mV and absolute coincidence is a conditional coincidence of amplitudes given that corresponding firing times coincide. accurately calculates similarity and this can be correlated with the percentage of absolute coincidences.
Firing time Coincide nces (%)
Amplitud e Coincide nces (%)
Absolute Coincide nces (%)
-1 50 20.83333 16.6667 0.161
75 29.1677 25 0.2489
79.1667 37.5 29.1667 0.2908 83.3333 12.5 8.3333 0.0753
79.1667 25 20.8333 0.1997
87.5 29.1667 20.8333 0.1984
100 100 100 1
91.6667 50 45.8333 0.4513
79.1667 33.3333 25 0.2392
87.5 16.6667 16.6667 0.1312
37.5 12.5 4.1667 0.0003
+1 100 29.1667 29.1667 0.2729
[image:3.595.62.280.590.713.2]B. Comparison of and , Set II, 13ms-15ms
Fig.2: Similarity of neural responses generated by periodic stimuli with and . represents the similarity estimated by coincidence factor and is the similarity based on firing times and amplitudes coincidences. eliminates false positives (circled) between .
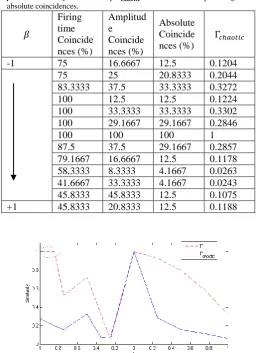
False positives (circled) estimated by coincidence factor, , shown in fig. 2. occur for . Table 2 shows that firing time coincidences are 100% for . These pairs of neural responses are classified identical by coincidence factor. However, the corresponding amplitude coincidences are 12.5%, 33.33% and 29.17% which indicate that though the firing times coincide, the amplitude fluctuations are not identical, hence these are termed as false positives. These non-identical amplitude fluctuations are caused by the dissimilar periodic stimuli. The corresponding absolute coincidences for the false positives are 12.5%, 33.33% and 29.17%. The similarity estimated by is 0.1224, 0.3302 and 0.2846 respectively which reflects the absolute coincidences. The composite consideration of irregular firing times and varying amplitudes helps differentiate neural responses and relate their dissimilarity to the stimuli.
For , the neural responses are generated by identical
stimuli ( ). Identical stimuli
cause similar chaotic oscillations, hence the resulting neural responses are an exact match. This is seen in table 2 and fig. 2, at , the firing time coincidences, amplitude coincidences and the absolute coincidences are 100%. This justifies that the neural responses are an exact match and they were generated by identical stimuli, hence . The similarity determined by for other neural response pairs is also consistent in correlation with the absolute coincidences.
C. Comparison of and , Set III, 15ms-17ms Set III exhibits false positives (circled) for
(fig. 3). Table 3 shows that the corresponding firing time coincidences are 100% which result in coincidence factor classifying the pair of neural responses identical. However, the amplitude coincidences are 29.17% and 20.83% indicating that the underlying oscillations are non-identical. The corresponding similarity determined by is 0.2754 and 0.1992. As , the neural responses are not an exact match and they were generated by dissimilar stimuli.
Table 2: Firing time, amplitude and absolute coincidences for various values of in set II. eliminates the false positives occurring for
. Similarity estimated by correlates to the percentage of absolute coincidences.
Firing time Coincide nces (%)
Amplitud e Coincide nces (%)
Absolute Coincide nces (%)
-1 75 16.6667 12.5 0.1204
75 25 20.8333 0.2044
83.3333 37.5 33.3333 0.3272
100 12.5 12.5 0.1224
100 33.3333 33.3333 0.3302 100 29.1667 29.1667 0.2846
100 100 100 1
87.5 37.5 29.1667 0.2857
79.1667 16.6667 12.5 0.1178 58.3333 8.3333 4.1667 0.0263 41.6667 33.3333 4.1667 0.0243 45.8333 45.8333 12.5 0.1075
+1 45.8333 20.8333 12.5 0.1188
Fig.3: Similarity of neural responses generated by periodic stimuli with and . represents the similarity estimated by coincidence factor and is the similarity based on firing times and amplitudes. The incorporation of amplitude fluctuations to estimate similarity helps eliminate false positives (circled) for
[image:4.595.56.274.49.191.2].
Table 3: Firing time, amplitude and absolute coincidences for various values of in set III. The false positives determined by coincidence factor for are eliminated. Similarity between neural response pairs estimtated by correlates with the percentage of absolute coincidences.
Firing time Coincide nces (%)
Amplitud e Coincide nces (%)
Absolute Coincide nces (%)
-1 100 29.1667 29.1667 0.2754
100 20.8333 20.8333 0.1992
70.8333 25 16.6667 0.1581
83.3333 33.3333 33.3333 0.3243 58.3333 12.5 8.3333 0.0666 41.6667 12.5 8.3333 0.0704
100 100 100 1
95.8333 33.3333 29.1667 0.2851 87.5 20.8333 16.6667 0.1558
75 16.6667 12.5 0.1124
+1 58.3333 37.5 8.3333 0.0617
For , the neural responses are generated by identical
stimuli ( ). The similarity
[image:4.595.298.556.77.431.2] [image:4.595.298.555.88.300.2], decreases with an increase in indicating that similarity between the neural responses decreases with an increase in the difference in the ISI of two stimuli. Any difference in the ISI of a stimulus causes a temporal change and effect on neural dynamics is evident in the dissimilarity estimated by .
V. CONCLUSIONS
The nature of a periodic stimulus is responsible to induce chaotic oscillations in a biological neuron. Irregular inter-spike interval (ISI) and fluctuating amplitudes are the characteristics of chaotic oscillations absent in steady state responses generated by constant current stimuli. Information on stimuli similarity can be derived from neural response comparison. Estimating similarity based on firing times (coincidence factor) alone is insufficient in view of a) false positives and b) incorrect inference about neural stimuli. Firing time information is adequate to estimate similarity of steady state responses; however, in the presence of chaotic oscillations or when the amplitudes of a neural response fluctuate, amplitude and firing time collectively reflect the true dynamics of a neuron and therefore both should feature in similarity estimation [28-30].
The amplitudes a neural response exhibiting chaotic oscillations fit a Normal distribution and using the properties of Normal distribution, it is possible to determine amplitude coincidences. Similarity between these responses can be estimated by a composite similarity measure based on amplitude and firing time coincidences. In addition, similar periodic stimuli induce similar chaotic patterns in the neural responses and therefore the resulting neural responses have a high degree of similarity. The effect of distinct periodic stimuli is evident in the dissimilar chaotic patterns displayed in the responses. It follows that chaotic responses with high similarity originate from very similar periodic stimuli. This agrees in principle that initial representation of a neural response is unique to the stimulus [9,33].
The results show that the similarity estimated using both firing times and amplitudes can be quantified by analyzing the number of absolute coincidences. Absolute coincidences are the number of spikes that coincide with respect to both firing times and amplitudes with a pre-defined precision . It is observed that similarity estimated by is approximately equal to the percentage number of absolute coincidences. If the number of absolute coincidences are 25%, then the similarity estimated by is approximately 0.25. This quantification ensures that the estimated similarity is realistic and mathematically realizable.
REFERENCES
[1] Lundström I (1974). Mechanical Wave Propagation on Nerve Axons. Journal of Theoretical Biology, 45, 487-499.
[2] Abbott LF, Kepler TB (1990). Model Neurons: From Hodgkin Huxley to Hopfield. Statistical Mechanics of Neural Networks, Edited by Garrido L, 5-18.
[3] Hasegawa H (2000). Responses of a Hodgkin-Huxley neuron to various types of spike-train inputs. Physical Review E, Vol. 61, No. 1.
[4] Agüera y Arcas B, Fairhall AL (2003). What causes a Neuron to Spike? Neural Computation 15, 1789-1807, (2003).
[5] Agüera y Arcas B, Fairhall AL, Bialek W (2003). Computation in a Single Neuron: Hodgkin and Huxley Revisited. Neural Computation 15, 1715-1749.
[6] Fourcaud-Trocmé N, Hansel D, van Vreeswijk C, Brunel N (2003). How Spike Generation Mechanisms Determine the Neuronal Response to Fluctuating Inputs. The Journal of Neuroscience, 23(37): 11628-11640.
[7] Kepecs A, Lisman J (2003). Information encoding and computation with spikes and bursts. Network: Comput. Neural Syst. 14, 103-118.
[8] Bokil HS, Pesaran B, Andersen RA, Mitra PP (2006). A Method for Detection and Classification of Events in Neural Activity. IEEE Transactions on Biomedical Engineering, Vol. 53, No. 8.# [9] Davies RM, Gerstein GL, Baker SN (2006). Measurement of Time-Dependent Changes in the Irregularity of Neural Spiking. Journal of Neurophysiology, 96:906-918.
[10] Diba K, Koch C, Segev I (2006). Spike Propagation in dendrites with stochastic ion channels. Journal of Computational Neuroscience 20: 77-84.
[11] Dimitrov AG, Gedeon T (2006). Effects of stimulus transformations on estimates of sensory neuron selectivity. Journal of Computational Neuroscience 20: 265-283.
[12] Izhikevich EM (2006). Polychronization: Computation with Spikes. Neural Computation 18, 245-282.
[13] Li X, Ascoli GA (2006). Computational simulation of the input-output relationship in hippocampal pyramidal cells. Journal of Computational. Neuroscience, 21:191-209.
[14] Rinzel J (1985). Excitation dynamics: insights from simplified membrane models. Theoretical Trends in Neuroscience Federal Proceedings, Vol. 44, No. 15, 2944-2946.
[15] Panzeri S, Schultz SR, Treves A, Rolls ET (1999). Correlations and the encoding of information in the nervous system. Proc. R. Soc. Lond. B 266, 1001-1012.
[16] Gabbiani F, Metzner W (1999). Encoding and Processing of Sensory Information in Neuronal Spike Trains. The Journal of Biology, 202, 1267-1279.
[17] Wang XJ, Buzsáki G (1996). Gamma Oscillation by Synaptic Inhibition in a Hippocampal Interneuronal Network Model. The The Journal of Neuroscience, 16(2)
[18] Guttman R, Feldman L, Jakobsson E (1980). Frequency Entrainment of Squid Axon Membrane. Journal of Membrane Biology, 56, 9-18.
[19] Matsumoto G, Kim K, Ueda T, Shimada J (1980). Electrical and Computer Simulations upon the Nervous Activities of Squid Giant Axons at and around the State of Spontaneous Repetitive Firing of Action Potentials. J. Phys. Soc. Jpn., 49, 906. [20] Aihara K, Matsumoto G, Ikegaya Y (1984). Periodic and
Non-periodic Responses of a Periodically Forced Hodgkin-Huxley Oscillator. Journal of Theoretica Biology, 109, 249-269.
[21] Matsumoto G, Aihara K, Ichikawa M, Tasaki A (1984). Periodic and Nonperiodic responses of membrane potentials in squid giant axons during sinusoidal current simulations. Journal of Theoretical Neurobiology, 3, 1-14.
[22] Hayashi h, Ishizuka S, Hirakawa K (1985). Chaotic responses of the pacemaker neuron. J. Phys. Soc. Jpn., 54, 2337.
[23] Holden AV (1987). Chaos. Manchester: Manchester University Press.
[24] Hasegawa H (2008). Information conveyed by neuron populations – Firing rate, fluctuations and synchrony. Neuroquantology, Vol. 6 (2), 105-118.
[25] Kaplan D, Glass L (1995). Understanding Non Linear Dynamics. Springer, New York.
[26] Wilson HR (1999). Spikes, Decisions and Actions – The dynamical foundations of neuroscience. Oxford University Press Inc., New York.
[27] Hodgkin A, Huxley A (1952). A quantitative description of membrane current and its application to conduction and excitation in nerve. J. Physiol. 117:500–544.
[28] Sarangdhar M, Kambhampati C (2008a). Spiking Neurons: Is coincidence-factor enough to compare responses with fluctuating membrane voltage? In World Congress on Engineering 2008 : The 2008 International Conference of Systems Biology and Bioengineering, London, U.K. 2-4 July 2008, Vol. 2, pp 1640-1645.
[29] Sarangdhar M, Kambhampati C (2008b). Spiking Neurons and Synaptic Stimuli: Determining the Fidelity of Coincidence-Factor in Neural Response Comparison. Engineering Letters, Volume 16 Issue 4, pp 512-517.
Computational Science. Edited by Gelman L, Balkan N, Ao S. Published by Springer.
[31] Joeken S, Schwegler H (1995). Predicting spike train responses in neuron models; in M.Verleysen (ed.), Proceedings of the 3rd European Symposium on Artificial Neural Networks 1995, Brussels, Belgium, April 19-21, 1995, pp 93-98.
[32] Kistler WM, Gerstner W, Leo van Hemmen J (1997). Reduction of the Hodgkin-Huxley Equations to a Single-Variable Threshold Model. Neural Computation 9: 1015-1045.
[33] Chechik G, Anderson MJ, Bar-Yosef O, Young ED, Tishby N, Nelken I (2006). Reduction of Information Redundancy in the Ascending Auditory Pathway. Neuron 51, 359-368.
[34] Park MH, Kim S (1996). Analysis of Phase Models for two Coupled Hodgkin-Huxley Neurons. Journal of the Korean Physical Society, Vol. 29, No. 1, pp. 9-16.