On the Quality of Quality Models
J.H. Hegeman – Master Thesis – Unrestricted version 3
Author Erik Hegeman
MSc. student Computer Science, track Information Systems Engineering Dept. of EEMCS, University of Twente Student number 0086215
[email protected] +31 647848024
Graduation Committee
University members Pascal van Eck
Information Systems chair, dept. of EEMCS, University of Twente
+31 534894648 Mariëlle Stoelinga
Formal Methods & Tools chair, dept. of EEMCS, University of Twente
+31 534893773
External members Nico Nijenhuis (assignment)
Managed IT Services, Info Support BV [email protected]
+31 647504890
Marco Pil (technical supervision) Knowledge Center, Info Support BV [email protected]
+31 645478915
Process support Barbara Engel
HRM, Info Support BV [email protected] +31 652671371
Document availability Unrestricted
Revision number 3.71
J.H. Hegeman – Master Thesis – Unrestricted version 4
“Measure what is measurable, and make measurable what is not so”
J.H. Hegeman – Master Thesis – Unrestricted version 5
Management Summary
This project investigates the usability of the SQALE method at software company Info Support BV. This method allows Info Support to measure the quality of Java and C# source code. We learned that SQALE, as implemented in the Sonar tool, provides a workable method to perform this quality assessment for projects of both languages.
Reason for Info Support to start this project was a wish to be able to assess the quality of customers’ projects before the Managed IT Services department contracts customers for management services. The ability allows Info Support to decide which services can be delivered for which price.
The investigation was performed by correlating SQALE quality judgments of 9 Info Support managed software projects with two types of validation data:
• A survey was conducted, in which 11 experts (Info Support Managed IT Services employees) rated the sample projects they had knowledge of. This resulted in 22 project gradings. • An investigation was conducted of the time spent on resolving incidents and problems in the
sample projects in 2010. This resulted in a value (in hours) for each project, which we divided by the project size (in KLOC) for scaling. The resulting value is an overall quality indicator. In a proof of concept, the Sonar tool and SQALE method were setup and used to assess the source code of the 9 sample projects. We calculated the correlation of the SQALE measurements with the expert opinions and financial quality indicators. We performed this analysis with an initial (default) SQALE configuration as well as with a calibrated SQALE configuration in which Info Support programming rules were used. The observed Pearson correlation values are displayed in Table 1. In all cases, we expected a value equal to or larger than +0.30.
Initial configuration Calibrated
Sonar results vs. Survey results +0.41 +0.50
Sonar results vs. Financial quality +0.34 +0.36
Table 1 Main Pearson correlation coefficients: Sonar measurements vs. validation data
This leads to the conclusion that in general, the methods provides quality measurements that are valid. A number of side nodes should be made:
1. The method configuration is very flexible, and configuring is therefore a difficult task. This thesis suggests a number of options to enhance the configuration and possibly further increase correlation with validation data;
2. A higher correlation coefficient was found to not always imply a better configuration quality. A starting-point configuration, consistent with the Endeavour rule set, and the use of a continuous improvement procedure is suggested.
The choice for the SQALE model and Sonar tool followed from a literature review and free search on the internet, respectively. The method allows Info Support to not only determine the overall quality, but also provides a rating for four important quality aspects, consistent with ISO 9126:
• Analyzability (referred to as Maintainability in SQALE): about the readability and understandability of application source code;
J.H. Hegeman – Master Thesis – Unrestricted version 6 • Reliability: about the robustness of an application, amongst which exception handling, input
error detection and thread handling;
• Testability: about the effort needed to test changes in a system.
As a by-product of this project, a number of recommendations for Info Support was formulated: 1. Use existing tools and do not attempt to imitate them by in-house development, as the latter
option is more expensive and has more risks;
2. Keep an eye open for better tools since the SQALE method is supported by multiple tools and the tool market is young and developing; better options than Sonar may become available; 3. Use appropriate (virtual) hardware to run software analysis on. The analysis process requires
quite a lot of computer power. Therefore, appropriate hardware is a requirement for effective use of the method, especially when the method becomes part of a non-incidental process (i.e. nightly builds). Bottlenecks are, in order of priority, CPU, disk I/O and RAM; 4. Integrate the method in PDC nightly builds: to support the alignment of the Professional
Development Center and Managed IT Services Department, the method can be made part of the build cycle of PDC projects. This allows developers to better assure maintainability of projects that are being developed and are to become managed projects of MITS;
5. Sell Quality Assessment as a Service: quality assessments created by SQALE can be made ‘SIG-compatible’, which provides the business opportunity to Info Support to sell software source code quality assessments as a service to customers. Resulting quality judgments will be comparable to SIG audit results;
6. Assign method responsibility and authority: the use of SQALE requires some knowledge, and also an authority that is capable of taking non-trivial decisions mainly concerning the configuration of the quality model. Therefore, it is recommended to assign the responsibility for and authority of the use of SQALE at Info Support to a specific ‘project owner’;
7. Improve the MITS incident registration procedure. Details of this recommendation are confidential.
Additionally, two proposals for SQALE model extensions were formulated:
1. A proposal for introducing the concept of rule violation severeness in the quality model; 2. A proposal for a method to balance SQALE indexes over quality characteristics and
languages.
To further elaborate upon the topic of the quality of quality models, a number of ideas that are deemed interesting but lay beyond the scope of this project were formulated:
1. Investigate the possibility to create a ‘benchmarking repository’ that can be used for the calibration of the quality model. Such a repository is also used by the Software Improvement Group. The question, in this case, would be if and how such a repository can contribute to the quality of the SQALE configuration calibration procedure, specifically for Info Support or in general.
2. Further Investigate the nature and characteristics of the mathematical relationship between Lines of Code in a software project and its number of Function Points.
J.H. Hegeman – Master Thesis – Unrestricted version 7 In 2004, I came to the University of Twente to study Business Information Technology. It would take
some time for me to realize that at that point I didn’t actually have any clue what it meant to be a University student. Although my studies went quite well and I passed all my first year courses, it was only at the end of my second year when I moved from Enter to Enschede and started to participate in extracurricular activities. I also started a second Bachelor’s program in Computer Science. These steps turned out to have a major impact on my life as a student.
The next few years would become a heavy but pleasant mixture of courses, projects, meetings, reading and writing enormous amounts of documents and e-mails and of course more than occasional drinks. I managed to combine studying and other things I did quite well, so six and a half years after coming to the University, I found myself having finished all courses. It was time for me to graduate. I wanted to do a graduation assignment outside the University, since I didn’t have any ‘external’ experience yet.
Directly after my final exams, I started my graduation project at Info Support. I decided not to move to the Veenendaal area, since travel times were acceptable and my social life was still in Enschede. It was hard for me to get used to spending days reading, writing and thinking, since I missed the action and variety of the life I had had for the past few years. I’m not someone who likes to work alone. It seemed to me to be quite inefficient to spent 40 hours a week on just one research project, especially since it involves a lot of thinking that I would normally do while doing ‘actual work’ that preferably provides some kind of tangible output at the end of the day. Fortunately, the project went quite well and I was able to more or less ignore this mismatch between the way of working and the way I prefer to work. I also was quite satisfied with the facilities and support during the project. These things allowed me to stay on schedule. After 3 months, I was able to draw the first conclusions from my research and to elaborate upon them, which announced a project phase that I found far more interesting than the data collection I had had to do in the previous two months. I enjoyed discussions about interpretation and implications of results and was able to finish the project soon afterwards.
Aside from capabilities and knowledge, the last few years have brought me lots of good memories. I especially enjoyed my board and committee functions, in which I got to know many different people and worked together with them to accomplish a diversity of things and also had a lot of fun. My advice to any student would be to choose things to do besides studying that are both pleasant and useful for the academic community and personal development.
Last but not least, I would like to thank my family and friends who have supported my throughout my studies. Without their help I would not have been able to accomplish the things I have in the last years. I also would like to thank the members of my graduation committee, who provided useful guidance and feedback, contributing to a graduation process that I experienced as quite smooth.
J.H. Hegeman – Master Thesis – Unrestricted version 9
Table of Contents
1. Introduction ... 131.1. Problem Statement ... 13
1.2. Goal statement ... 13
1.3. Scope ... 13
1.4. Research Question ... 14
1.4.1. Definitions ... 14
1.4.2. Question formulation ... 15
1.5. Document Structure ... 16
1.6. Related Work ... 16
1.7. Conclusion ... 17
2. Theoretical Background... 19
2.1. Info Support Context ... 19
2.1.1. On Software Engineering and Management at Info Support ... 19
2.1.2. Earlier Work at Info Support ... 20
2.2. Quality Model Terminology ... 20
2.3. On the ISO 25000 standard ... 20
2.3.1. The ISO 9126 component ... 21
2.3.2. The ISO 14598 component ... 23
2.4. On Quality Models ... 23
2.4.1. McCal Model... 24
2.4.2. Boehm Model ... 24
2.4.3. Dromey Model ... 25
2.4.4. SIG model ... 25
2.4.5. Qualixo Model ... 27
2.4.6. SQALE Model ... 29
2.5. Discussion ... 34
2.6. On Quality Assessment Tools ... 35
2.6.1. Comparison Criteria ... 35
2.6.2. Tools ... 37
2.6.3. Comparison & Conclusion ... 39
2.7. On Financial Indicators for Software Quality ... 41
3. Research Design ... 43
J.H. Hegeman – Master Thesis – Unrestricted version 10
3.2. Expert Opinion Phase ... 45
3.2.1. Employee selection ... 45
3.2.2. Survey Design ... 45
3.2.3. Survey Conduction... 47
3.2.4. Survey Conclusions ... 48
3.3. Financial Investigation Phase ... 48
3.3.1. Financial Indicator Calculations ... 48
3.4. Proof of Concept Phase ... 51
3.4.1. Proof of Concept Setup ... 51
3.4.2. Software Quality Assessment ... 52
3.4.3. Assessment Result Analysis ... 52
3.5. Research Results Phase ... 52
3.5.1. Correlation Calculations ... 52
3.5.2. Statistical Significance ... 53
3.5.3. Procedure ... 54
3.5.4. Calibrating the Quality Model Configuration ... 55
4. Validation Data Collection Results: Expert Opinions ... 61
4.1. Data Collection Process ... 61
4.2. Expert Project Ratings ... 61
4.3. Characteristic Correlations ... 62
5. Validation Data Collection Results: Financial Indicators ... 63
6. Proof of Concept... 64
6.1. SQALE implementation in Sonar ... 64
6.1.1. Implementation characteristics ... 64
6.1.2. Mapping of SQALE characteristics to quality definition ... 64
6.1.3. Relationship with ISO 9126 ... 66
6.2. Setting up the Proof of Concept ... 67
6.2.1. Initial Sonar Setup attempt ... 67
6.2.2. Sonar SQALE Quality Model Settings... 69
6.2.3. .Net Project Setup ... 69
6.2.4. Initial Quality Model Configuration Calibration & Setup Test ... 70
7. Analysis & Optimization ... 74
7.1. Validating the Validation data ... 74
J.H. Hegeman – Master Thesis – Unrestricted version 11
7.2.1. Calculating Correlations ... 75
7.2.2. Sensitivity ... 76
7.2.3. Correlations of Characteristics ... 77
7.3. Calibrating the configuration: applying Info Support rule set ... 78
7.3.1. Reconfiguring the rule set ... 78
7.3.2. Reconfiguring the rule – characteristic mapping ... 78
7.4. Reflection... 81
7.4.1. What is an optimal configuration? ... 81
7.4.2. Why do correlations on characteristic-level remain low?... 82
7.4.3. On the Suitability of Sonar... 82
7.5. SQALE Extension Proposals ... 82
7.5.1. Balancing the Ratings ... 83
7.5.2. Adding Weights to Rule Violations ... 85
8. Recommendations for Info Support ... 88
8.1. Do not try this at home ... 88
8.2. Keep an eye open for newer and better tools ... 88
8.3. Run tools on appropriate hardware ... 88
8.4. Integrate analysis in PDC Nightly Builds ... 89
8.5. Sell Quality Assessment as a service ... 89
8.6. Assign method responsibility and authority ... 90
8.7. Improve incident registration procedure ... 90
9. Discussion ... 91
9.1. What the Method Does Not Do ... 91
9.1.1. Functionality Verification ... 91
9.1.2. Test Quality ... 91
9.1.3. Non-source code components ... 92
9.1.4. Process metrics ... 92
9.2. On Correlation-limiting factors ... 92
9.3. Generalizability of Research Results ... 93
9.3.1. Background information and Tool selection ... 93
9.3.2. Research Design ... 93
9.3.3. Validation Results ... 94
9.4. The Remediation Cost Paradigm ... 94
J.H. Hegeman – Master Thesis – Unrestricted version 12
10. Future Research... 99
10.1. Benchmark-based calibration ... 99
10.2. Lines of Code versus Function Points ... 99
11. Conclusion ... 101
11.1. Answers to the main Research Questions ... 101
11.2. Proof of Concept Setup ... 101
11.2.1. Initial Correlations ... 101
11.2.2. Optimizing the Configuration ... 101
11.3. Obtaining validation data ... 102
11.3.1. Expert Opinions ... 102
11.3.2. Financial Investigation ... 102
11.4. Other Findings ... 102
11.4.1. Recommendations for Info Support ... 102
11.4.2. Enhancing the SQALE model ... 103
11.5. Preliminary Research ... 103
A. Bibliography ... 105
B. Lists of tables and figures ... 109
List of Tables ... 109
List of Figures ... 110
C. Digital Resources ... 111
D. Sonar Dashboard Example ... 113
E. Survey Design ... 115
F. Survey Results – raw result overview [CONFIDENTIAL] ... 117
G. Method Setup notes ... 119
1. General Setup ... 119
2. Setup Test ... 121
3. General Usage ... 121
4. Default Pom.XML for .Net projects ... 123
H. PoC Technical Setup Overview ... 125
I. SQALE configuration overview ... 127
J. List of installed software on the PoC VM ... 149
J.H. Hegeman – Master Thesis – Unrestricted version 13
1.
Introduction
In this project, we attempted to answer the research question “how do Sonar SQALE quality assessment results of projects correlate to Info Support experiences and expectations?” This introductory chapter provides information on the problem, scope and shows how this research question was formulated.
1.1.
Problem Statement
The problem that was reason for Info Support - see background information section 2.1 for more information about the company - to formulate the initial research assignment, is a lack of insight in what is or is not a suitable way of dealing with automated software quality assessment.
The assignment was formulated by the Managed IT Services – ‘MITS’ – department of Info Support, which is responsible for delivering software management services (defined in paragraph 1.4.1) to customers as well as Info Support itself. Software, possibly developed outside Info Support, is at some point in time offered to MITS to be managed. To be able to assess this software and determine which management services can be offered for which price, a method is needed to qualify relevant quality aspects during the intake procedure. This does not mean, however, that the results of this research are only relevant for MITS itself. Monitoring of quality, specifically the maintainability aspect, is also relevant during the software development phase. The assessment method therefore is also intended to eventually be used at the Professional Development Center – ‘PDC’ – at Info Support, to increase the maintainability of software and allow for easy management after the initial development phase has finished, saving resources in the long term.
A specific requirement of the quality assessment method to be performed is that, for any given project, analysis results in at least an index for ‘quality’ and ‘maintainability’. This index is a value on a certain scale, The quality index should incorporate at least a score for unit tests, unit test coverage, standard compliance and complexity. The maintainability index should incorporate at least analyzability, changeability, stability and testability. In the literature, maintainability is usually considered to be a specific aspect of quality, as will be explained later. A definition of quality will be chosen that incorporates this requirements but also conforms to ISO 9126, see definition paragraph 1.4.1.
1.2.
Goal statement
The goal of this project follows from the problem statement, and is to develop and validate a method, applicable in the software management environment of Info Support, to automatically and quantitatively determine the quality and maintainability of software, given the software’s source code. Research questions that need to be answered in order to reach this goal are defined in paragraph 1.4. The design of the research that will allow us to reach this goal is defined in chapter 3.
1.3.
Scope
J.H. Hegeman – Master Thesis – Unrestricted version 14 • The set of software source code languages is limited to Java and C#, the languages used in
software developed or maintained at Info Support. Tools used in this research need to support these languages.
• This research is not be about defining our own quality standard or model; we use the ISO 9126 standard and existing quality models, used by existing tools, as a foundation. This ISO-standard is explained in the Background section. Using this ISO-standard, we try to identify tools that conform to both the standard, the language support constraint, and are mature enough to be used in a production environment. Although this implies that we will not write our own software, we leave the possibility open that, as a result of this research, we will recommend to do so.
• Specifically, we focus on the ‘maintainability’ aspect of the ISO-standard. Reason for this is that this aspect is considered most relevant in the context of the research assignment as formulated by Info Support. The definition we use for ‘quality’ in this research expresses this and can be found in paragraph 1.4.1.
• The number of tools used in the Proof of Concept phase is limited to one, due to resource (time) constraints and the lack of available alternatives to the selected tool. Background information about tools can be found in paragraph 2.6.
1.4.
Research Question
1.4.1. Definitions
To be able to understand and interpret the research questions and their relations as formulated in paragraph 1.4.2, we first need to define the terminology used in the formulation. The following terms are used in the research questions and throughout the rest of this thesis using a specific meaning defined in this section. Terms are presented in alphabetical order.
Term Definition
Expectations Expectations are quantified formulations of what is expected to be the value of an element from the quality information tree (see ‘Quality Information’), from a specific perspective. For example, the results of the second research phase (financial investigations) is referred to as expectations.
Experiences Experiences are opinions of Professionals on the value of elements from the quality information tree. Specifically, we use experiences to refer to the survey results of the first phase of this research.
Professionals Professionals are employees of Info Support that are directly involved in software management, i.e. employees of the Managed IT services department.
Quality information
J.H. Hegeman – Master Thesis – Unrestricted version 15
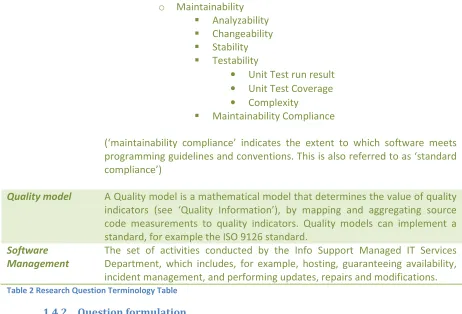
o Maintainability Analyzability Changeability Stability Testability
• Unit Test run result • Unit Test Coverage • Complexity
Maintainability Compliance
(‘maintainability compliance’ indicates the extent to which software meets programming guidelines and conventions. This is also referred to as ‘standard compliance’)
Quality model A Quality model is a mathematical model that determines the value of quality indicators (see ‘Quality Information’), by mapping and aggregating source code measurements to quality indicators. Quality models can implement a standard, for example the ISO 9126 standard.
Software Management
[image:15.595.64.526.72.386.2]The set of activities conducted by the Info Support Managed IT Services Department, which includes, for example, hosting, guaranteeing availability, incident management, and performing updates, repairs and modifications.
Table 2 Research Question Terminology Table
1.4.2. Question formulation
Based upon the research goal and scope, the main research question was initially formulated as follows:
To which extend can software tools, incorporating quality models, provide quality information that matches Info Support experiences and expectations?
1. How is software quality being experienced by Info Support professionals? 2. How can software quality be expressed in financial terms, given historic data? 3. How can software tools be used to assess software source code quality?
The main research question contains the phrase ‘to which extend’. To make the answer measurable, we use quantitative analysis of the result of all sub questions. We now flash-forward to the theoretical background and research design sections and narrow down the research questions. We use the following information:
- The software tool selection phase identified Sonar to be the tool of choice (2.6.2) - The quality model selection phase identified SQALE to be the model of choice (2.4.6) - The ‘extend of the match’ is calculated by correlations (3.5.1)
- In the survey to be conducted we ask experts to rate projects on SQALE characteristics (3.2) - In the financial investigation phase we determine a financial quality indicator values (3.3) - Hypotheses about the correlations between the results of the sub questions are formulated
in research design section 3.5
J.H. Hegeman – Master Thesis – Unrestricted version 16
How do Sonar SQALE quality assessment results of projects correlate to Info Support experiences and expectations?
1. How do Info Support experts rate the sample projects on relevant SQALE characteristics? 2. What is the financial quality, expressed as hours/KLOC, of the sample projects?
3. How are the sample projects rated by a Sonar SQALE setup?
4. Which methods to improve the quality of the quality model configuration exist?
1.5.
Document Structure
Globally, this thesis has the following structure:
- Background information about Info Support, quality models & tools is provided (ch. 2, p19); - The research design is defined (ch. 3, p43);
- Results of the process of gaining validation data as well as the validation data itself are reported (ch. 4 and 5, p61 onwards) ;
- Results of the phase in which we setup and configured the tooling and attempted to use it to assess the quality of projects are described (ch. 6, p64);
- An analysis if the findings is presented (ch. 7, p74);
- Recommendations for Info Support are presented (ch. 8, p88);
- Discussion topics and suggestions for future research are provided (chapters 9 and 10, p91);
-
Conclusions are presented (ch. 11, p101).1.6.
Related Work
This section mentions some other relevant work performed in the area of software quality assessment and assessment methodology validation.
The IEEE attempted to empirically validate the suitability of object-oriented design metrics as quality indicators (Basili 1996) by assessing eight comparable projects. Examples of metrics used in this context are the inheritance tree depth, methods per class, and number of children of a class, i.e. all metrics related to object oriented design. Specifically, the set of metrics from the Chidamber & Kemerer ‘metrics suite’ are used (Chidamber 1994). Validation data consists of error data from the testing phase of the applications. For each metric, an hypothesis is formulated about the relationship between the metric value and ‘quality’, where more errors means less quality. This hypothesis was found to be true in five out of six cases; results for the sixth case were insignificant. This results demonstrates that most metrics from (Chidamber 1994) can be validated to provide information that is an indication of quality.
This study is complementary to (Li 1993) in which the same metrics are used to estimate the maintenance frequency of classes in a system. Li concludes that there is a strong relationship between metrics and maintenance effort in object oriented systems and that maintenance effort can be predicted from combinations of metrics collected from source code. The conclusions of both studies are consistent.
J.H. Hegeman – Master Thesis – Unrestricted version 17 international workshop on managing technical debt has been held in Honolulu, Hawaii. The program
can be found at the website (Techdebt 2011), proceedings are not yet available at time of writing of this thesis. Work is presented about, for example, prioritizing design debt investment opportunities, models for economic trade-off decision making and an empirical model of technical debt and interest.
An empirical study of quality models in Object Oriented systems is described in (Briand 2002). This study lists a number of ‘correlational studies’ in which metric values of a some data set are validated by, for example, numbers of defects or expert opinions. Usually, these studies use a ‘set of metrics’ rather than an actual quality model. Data sets usually consists of a very limited number of projects, often just one, which is identified as a shortcoming of many of the projects. Some of the studies use expert opinions to gain validation data. For example, (Chen 1993) uses expert opinions to assess the validity of a single newly invented metric.
The use of quality standards is not limited to software engineering, but applied in other sectors as well. For example, organizational procedures can be ‘ISO 9000’-certified (Guler 2002) and
philosophies like ‘Total Quality Management’ focus on the continuous improvement of both products and processes (Daft 2003) . Also, in the food industry, many quality standards are used, sometimes inspired by incidents impacting public safety (Trienekens 2008).
1.7.
Conclusion
We conclude this chapter by providing a schematic overview of the project. The diagram in Figure 1 shows the three research phases (left, right and bottom-center), as well as the conclusion phase (top-center). These phases are separated by striped lines. Phases I through IV were carried out consecutively. In each phase, a number of entities, indicated by boxes, perform actions or provide information, indicated by arrows. Red questions are answered in the research design. The goal is to answer the blue questions, which are the questions of this research. Arrows indicate flows of information, while boxes indicate sources and processes.
J.H. Hegeman – Master Thesis – Unrestricted version 18
J.H. Hegeman – Master Thesis – Unrestricted version 19
2.
Theoretical Background
This chapter provides to the reader background information that is relevant in the context of this research. The information is obtained from a literature review as well as the documentation of various tools and quality models available.
The definition of the term ‘quality’ can be an item of discussion. Although it is widely recognized that context-specific definitions can be useful, the wish to have more general definitions remains unfulfilled (Jørgenson, 1999). The search for a universal definition has not succeeded, and it is claimed that such a global definition does not exist (Reeves, 1994). Also, different stakeholders may have different opinions on what defines quality of a given type of artifact, potentially obscuring communications. That is why we must make unambiguous context-specific definitions.
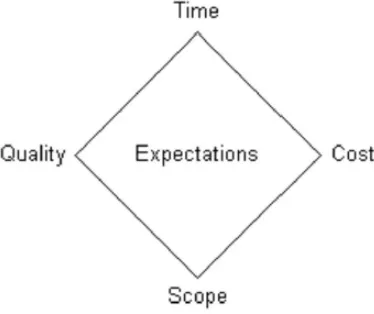
In an Information Technology context, the need for quality is broadly acknowledged. Software development projects still often encounter cost overruns and/or time overruns, and often do not conform to specifications or expectations (i.e. Standish, 2001). According to the Project Management Diamond, as displayed in Figure 2. (Haughey 2010), steering factors time, cost, scope and quality should be balanced to make an information system live up to its expectations. But balancing is only possible if we can measure all four factors, including quality.
An IT-specific definition of quality has been developed in the ISO 9126 standard. This standard identifies a number
of high-level quality characteristics, namely Functionality, Reliability, Usability, Efficiency, Maintainability and Portability (Jung e.a. 2004) and also software metrics that can contribute to determining a score for these aspects. Chapter 2, on theoretical background information, further elaborates upon ISO 9126.
An important asset of a software project is its source code. The source code of a software project determines what the software actually does, and how, and therefore plays a crucial role in the realization of quality (Luijten 2010).
2.1.
Info Support Context
2.1.1. On Software Engineering and Management at Info Support
[image:19.595.334.521.262.419.2]This research is conducted at Info Support BV in Veenendaal, the Netherlands. Info Support develops and manages software for customers in four sectors: healthcare, industry & trading, finance and the public sector. Distinguishing characteristics of Info Support, amongst others, are very strictly defined and knowledge-intensive processes and procedures, used to ensure solidness and quality of delivered products and services. Methods used for this purpose are, for example, test-driven development, SCRUM (Abrahamsson 2002), code conventions and version control check-in policies. The internally developed software development methodology is called ‘Endeavour’, which is maintained by the Professional Development Center (PDC). The Managed IT Services (MITS) department takes care of managing production software, developed either internally or externally.
J.H. Hegeman – Master Thesis – Unrestricted version 20 More information on Info Support can be found at its website (Info Support, 2011). Figure 3 shows a
simplified overview of PDC and MITS relation. In the application lifecycle, Info Support can either do only development, only management, or (preferably) both. Cases in which Info Support does neither development or management are not relevant.
2.1.2. Earlier Work at Info Support
The problem defined in paragraph 1.1 has already led to some research initiatives that have been conducted at Info Sport. In earlier research, it has been attempted to identify and test maintainability metrics, but this research did not provide results that could be used in practice at Info Support (Woolderink 2007). Another, non-academic but relevant, project is a quickscan of the possibility to use the Sonar tool for quality monitoring and enhancement. Results of this quickscan were promising, leading to a constraint on this research that the Sonar tool is to be one of the tools to be looked at. This requirement is taken into account in paragraph 2.6.2 which identifies tools that can be used to set up the proof of concept as defined in research design section 3.4.
2.2.
Quality Model Terminology
A number of essential concepts need to be described before additional background information is introduced. These concepts play a crucial role in quality models. First, metrics measure a specific aspect of source code (Fenton 1997). Examples are cyclomatic complexity of a method, unit test coverage of a class and the depth of a set of nested if-statements. Input to metrics is source code, output is a value (i.e. numerical, percentage or Boolean). Second, Quality Models are mathematical models that translate metric values into higher-level quality indicators. Since the late seventies, different models have been developed, as will be described in paragraphs following. In some cases, the quality model is also referred to as ‘method’. In 1991, the International Standards Organization developed a standard, the original ISO 9126, later to be replaced by ISO 25000, as described in the next paragraph. This standard was inspired by older quality models (i.e. McCal). Later models (i.e. SQALE) may implement this standard. Software tools that assess quality implement a quality model.
2.3.
On the ISO 25000
standard
In this research, we use the ISO 25000 standard as a foundation for software quality measurement. Defined in 2005, this standard is a follow-up of two relevant predecessor standards, namely ISO 9126 on software product quality, and
J.H. Hegeman – Master Thesis – Unrestricted version 21 ISO 14598 on the software quality assessment process. Figure 4 shows a visual representation of the
integration and alignment process that led to the definition of ISO 25000 (Zubrow 2004). 2.3.1. The ISO 9126 component
Introduced in 1991 and developed by the International Standards Organization and the International Electrical technical Commission, the ISO/IEC 9126 standard is an international standard for defining and measuring software product quality. This original version of the standard includes six high level quality characteristics and their definition (Jung 2004). It was claimed that these six quality characteristics were sufficient to represent any aspect of software quality (Burris, 2004). Sub characteristics and metrics, however, were not part of the standard, making the standard difficult to apply.
[image:21.595.72.520.396.711.2]The standard has evolved over the years, which has led to the development of ISO/IEC 9126-1 through-4 (written in 2001-2004)1. The standard now includes not only the original quality model (9126-1), but also external and internal metrics (9126-2 and 9126-3) and metrics for quality of use (9126-4) (Jung 2004). External metrics assess the behavior of software in a simulated environment from an interface-view, while internal metrics do not rely on execution but look at the insides of software, i.e. the source code. Usability metrics (referred to as ‘Quality-of-use metrics’) assess software from a user point-of-view. For the purpose of this research, both the general standard and internal metrics are relevant. We will see that these are the aspects of the ISO standard incorporated in quality models used in software tools, since this allows for automated code quality assessment.
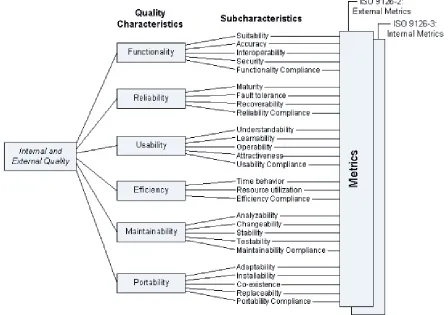
Figure 5 Hierarchical view of the ISO/IEC 9126 quality model
1
J.H. Hegeman – Master Thesis – Unrestricted version 22 The standard proposed a hierarchy, denoting the term ‘quality’ as the root of the hierarchy three and
the six quality characteristics as the first level nodes. Each of these nodes is split up in several sub-characteristics. Internal and external metrics can be used to determine a value for a sub characteristics. Figure 5 gives a visual representation of this tree structure. As stated in the scope paragraph 1.3, in this research we focus on the ‘maintainability’ aspect of quality. The maintainability subtree of the ISO standard is consistent with our definition of quality from section 1.4.1.
For the aspects we look at, we provide a brief description of their meaning (Tavaf 2010): - Maintainability is the ability to find and fix a fault in a software system.
o Analyzability characterizes the ability to identify the root cause of a failure within the software.
o Changeability characterizes the amount of effort needed to change a system. o Testability characterizes the effort needed to verify (i.e. test) a system change.
Unit test run results: the amount of errors encountered while running the unit tests of a system.
Unit test coverage: the percentage of source code covered by the unit tests.
Complexity: complexity (i.e. cyclomatic complexity) of the source code. This is related to testability, because more complex source code is more difficult to test and therefore has a negative impact on testability.
o Stability characterizes the sensitivity to change of a given system that is the negative impact that may be caused by system changes.
o Compliance: Where appropriate certain industry or government laws and guidelines need to be complied with. This sub characteristic addresses the compliant capability of software.
J.H. Hegeman – Master Thesis – Unrestricted version 23 2.3.2. The ISO 14598 component
The ISO 14598 component does not focus on software quality, but on the process of assessing quality. This research project incorporates an assessment structure that is based upon ISO 14598. The standard provides an abstract proces of how a software quality assessment process should look like. The process is depicted in Figure 6 (source: (Gruber 2007)). The relationship between ISO 14598 and ISO9126 is that the first can be applied to the second, meaning that the process is used to execute the model. Note that the process is generic in the sense that it can be applied to any quality model. Also, other processes may provide suitable ways to execute the model.
2.4.
On Quality Models
As mentioned, the ISO 25000 standard did not just emerge. Quality models have been defined for decades. The purpose of a quality model, in this context, is to transform metrics to high-level quality indicators. Usually, the quality model allows for some tweaking to conform to business needs. Figure 7 displays a simple overview of the concept of a quality model. This paragraph provides a short description of a number of models and their relation to the ISO standard.
Figure 6 ISO 14598 Quality Evaluation Model
J.H. Hegeman – Master Thesis – Unrestricted version 24 2.4.1. McCal Model
As a foundation for what would later become the ISO standard, McCal introduced the concept of the hierarchical combination of metrics into higher-level quality attributes as early is 1978 (McCal 1978). Combination is performed by addition, where each metric value is associated with a regression coefficient, based upon the established importance of the metric value.
Consider the situation in which we have four metrics with the following regression coefficients: - Cyclomatic complexity: -0.5
- Program length: -0.1
- If-statement nesting depth -0.5
The model allows us to define negative coefficients for metrics for which a higher measurement value means lower quality. Suppose that the software artifact under consideration has a cyclomatic complexity of 30 paths, a program length of 660 lines and a maximum if-statement nesting depth of 5.
Suppose this set of metrics is attached to one quality factor, namely ‘maintainability’. The maintainability factor would be -0.5*30 + -0.1 * 660 – 0.5*5 = -83,5. An important limitation of the model is that it is only suitable for metric-quality correlations with a linear relation.
Elements of the McCal model are still visible in today’s ISO standard. For example, McCal introduces, amongst others, maintainability, testability, portability and reusability as high-level quality indicators.
2.4.2. Boehm Model
The Boehm model (Boehm, 1999), also referred to as COQUALMO (‘Constructive Quality Model’), focuses on the introduction and removal of defects in a software system, where in a source code context a defect is a programming error leading to incorrect software behavior. Goal of the model is to predict the number of residual defects per unit of size, i.e. thousands of source lines of code or function points. An practical description of the use of the model can be found in (Madachy 2008). The mathematics in the model are as follows. Consider the following formula:
In which:
- A is the scalar of coding defects, used to be able to combine the result with requirements and design defects (which are also part of the model, consider A=1 for this example)
- Size is the size of the project in KLOC
- b is used to account for economies of scale if needed. No proof for a value other than 1 is found, so by default it is set to 1 (Boehm 2000).
- Di is a Defect Introduction Driver value, of which 21 have been defined in the model. These
drivers identify reasons for defects to occur.
J.H. Hegeman – Master Thesis – Unrestricted version 25 A predecessor of COQUALMO, called COCOMO (‘Constructive Cost Model’), is thought to have been
the most cited, best known and most plausible of all traditional cost prediction models (Atterzadeh 2010). In the late nineties, however, the model no longer fitted the modern development environment and was succeeded by COCOMO II. Reasons for this were the need for support for application composition (i.e. object orientation) and the need to be able to determine costs in earlier stages of the development process, The focus on quality was introduced in COQUALMO, which can be seen as an extension to COCOMO II, which was still mainly a cost model. The model is not explicitly related to the ISO standard.
2.4.3. Dromey Model
As an implementation of the original 1991 ISO9126 standard, Dromey (Dromey 1995) introduced the concept of ‘Quality-carrying properties’ of source code to provide a definition of what the high-level quality indicators from the original ISO standard mean in a practical situation. A quality-carrying property is associated with one or more high-level indicators from the ISO standard and with specific aspects of software source code, meaning that building these properties into software contributes to reaching a high-level quality indicator. Dromey believes that it is impossible to build high-level quality attributes into products. Instead, developers must build components that have properties that result in the manifestation of quality (Kitchenham 1996). This can be considered a bottom-up approach. Consider Figure 8, a redraw of an image from (Dromey 1995). The source code artifact of type ‘expression’ can, in the model, have four ‘quality carrying properties’. How it is determined whether or not the expression carries these
Figure 8 Dromey hierarchy example
properties is left to the user of the model, but the outcome is binary. This means that an expression either has or does not have each of the quality-carrying properties. The properties are mapped to the ISO-based quality characteristics and sub characteristics. The amount of properties artifacts have and have not are an indicator for quality. Also note that properties are not necessarily the responsibility of the programmer; some properties are inherent to design choices such as the programming languages.
2.4.4. SIG model
2.4.4.1 General model description
J.H. Hegeman – Master Thesis – Unrestricted version 26 9126 as well as the definition of quality in this research. The SIG model itself it public, but it relies on
a large ‘benchmarking repository’ for calibration. For this purpose of this research, a SIG audit has been provided to the author of this work as reference material. Since this is a confidential report, we cannot go into details. The way in which assessment results are presented indicate that the method used by SIG is based upon quality models and tool results that are very similar to the ones used in this research.
2.4.4.2 The Sonar SIG Maintainability Model Plugin
Note that for the Sonar tool (see paragraph 2.6.2.2), a SIG plugin exists (Sonar SIG 2011). This plugin implements a subset of the SIG quality model using five metrics: Lines of Code, Duplication, Coverage, Complexity and Unit Size with a 5-point scale to calculate, using a many-to-many table (see Figure 9) averages the four quality indicators analyzability, changeability, stability and testability, which are the aspects of maintainability as defined in ISO 9126. This plugin does not fully imitate the SIG model, as it has no calibration functionality and also does not allow the user to drilldown into origins of problems.
Figure 9 Sonar SIG model plugin: metric-indicator mappings
2.4.4.3 The SIG paradigm
A number of relevant aspects of the ideas behind the SIG quality model should be emphasized. This information was largely obtained from a visit to SIG during the course of this project, where Joost Visser, head of research, presented the
model.
• The set of metrics used in the SIG model is limited. SIG states that metrics should not overlap (i.e. each used metrics should identify a different aspect of source code quality) and should be non-controversial, meaning that developers should know what to do in case a metric value does not meet requirements.
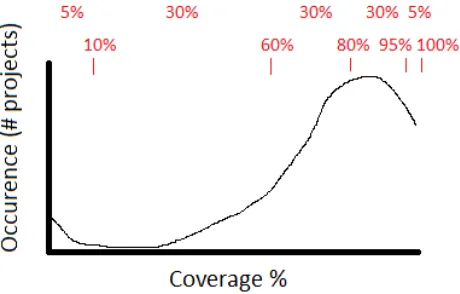
[image:26.595.294.524.501.648.2]• SIG explicitly does not define what is ‘good’ and ‘bad’, but only defines ‘better’ and ‘worse’. This is accomplished by a benchmarking principle. Consider the following example: suppose ‘unit test line coverage’ is a used metric. Also, supposed that we want to assign the worst 5% of projects a ‘1 star’ rating and the best 5% of projects a ‘5 star’ rating, and split up to 90% of projects in between into 3 segments of 30% with a 2, 3 or 4 star rating. Also, we assume that
J.H. Hegeman – Master Thesis – Unrestricted version 27 a larger coverage value is always better than a lower one. Figure 10 shows an example
distribution of coverage percentage over projects (the artifact size may be a class or a method as well). The two scales above the image show the five selected sections of the x value range (upper) and the x values at the boundaries of the sections (lower). We see that 5% of projects have a coverage level of 10% or lower; the next 30% has a coverage between 10% and 60%, etcetera. This results in the following rankings:
Rating 1: <= 10% coverage
Rating 2: 10% < coverage <= 60%
Rating 3: 60% < coverage <= 80%
Rating 4: 80% < coverage <= 95%
Rating 5: coverage >95%
• A major advantage of this approach is that a quality judgment is always relative to other systems and no explicit definition of good and bad is needed. Also, by adding newly assessed projects to the repository and removing old ones (i.e. older than 3 years), the calibration process automatically stays up to date. In practice, a slight but structural increase of software quality in general is observed by this method. Major disadvantage of the method is that it needs a large database of sample projects for calibration, which makes the model less usable in situations where this ‘benchmarking repository’ is not available. More background information on the benchmarking principle is available from (Correia 2008). Aggregation of ratings per metric into higher-value ratings is performed by a method that is similar to, but somewhat more complex than displayed in Figure 9; i.e. a many-to-many mapping from metric ratings to ISO factors. For each occupied cell in the matrix, a weight factor is used.
• Validation of the model configuration was found to be difficult due to the lack of sources of validation data. A positive correlation, however, was established between software artifact quality as measured by SIG and the time needed to repair incidents in these projects (Luijten 2010).
2.4.5. Qualixo Model
The Qualixo quality model (Laval 2008) defines four elements with different granularity levels: • Metrics are low-level measurements computed directly from source code, consistent with
the definition in the terminology section 2.2.
J.H. Hegeman – Master Thesis – Unrestricted version 28
Metric Value Mapping function
Scaled value
Metric Weight
Cyclomatic
Complexity 7
<=8 3 9-12 2 13-16 1 >=17 0
3 3
Unit Test Coverage 80% 3 * value 2.4 5
Class Length 426 lines
<=100 3 101-300 2 301-500 1 501+ 0
1 1
If statement
nesting depth 4
<=2 3 3-4 2 5-6 1 7+ 0
2 2
Tabel 3 Qualixo model calculation example: metrics to practices
The ‘Mapping’ column defines how metric values are translated to the [0..3]-scale. Unit Test Coverage is translated by a continuous function, while the other metrics are translated by a discrete mapping. The ‘Scaled value’ column shows the resulting quality judgment for each metric. The total score for this practice is the weighted average of scaled values:
(3x3 + 2.4x5 + 1x1 + 2*2) / (3+5+1+2) = 2.36
• Criteria assess one principle of software quality by taking a weighted average of a nonempty set of practices. For each practice, the value is calculated as described earlier, and a weight is used to indicate the importance of the practice in the set. This calculation again results in a value between 0 and 3.
• Factors represent the highest quality assessment and are again computed over a set of weighted criteria. Figure 11 gives an overview of the Qualixo quality model.
J.H. Hegeman – Master Thesis – Unrestricted version 29 A fixed interpretation is set for the scores in the [0-3] scale, as displayed in Table 4.
Qualixo Score
Interpretation
[0-1) Failure in meeting the quality objective
[1-2) Achieved with reserve
[2-3] Achieved
Table 4 Qualixo Score Interpretations
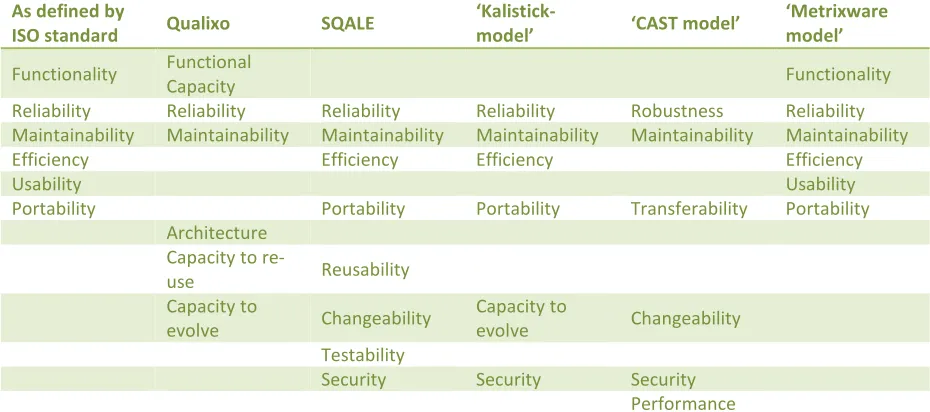
The set of Factors for the Qualixo model is fixed. These factors are Functional Capacity, Architecture, Maintainability, Capacity to Evolve, Capacity to re-use and Reliability. This partially matches the ISO 9126 set as van be seen in the comparison table at the end of this paragraph. A drawback of the model is that it is quite abstract and does not provide guidelines for the weighing that occurs on multiple levels on the model.
2.4.6. SQALE Model
The SQALE quality model (‘Software Quality Assessment based on Life Cycle Expectations’) (Sqale 2011)(Letouzey 2009), also referred to as ‘method’ instead of model, is a newer, language and tool independent method for quality assessment. It can be applied to different types of artifcats, and software source code is one of them. It is based upon a ‘remediation cost’ paradigm, in which high-level quality indicator values indicate the amount of time or financial resources needed to repair all issues. These ‘issues’ are violations of rules, which are pre-defined metrics with metric value threshold that define what is allowed and what is not (see 2.4.6.2) Remediation costs are compared to ‘total costs’, which are defined as the total estimated amount of time or financial resources invested in developing the project. Total costs may be calculated by multiplying the size of a project (i.e. in thousands of lines of source code) by the estimated average amount of hours needed to develop one thousand lines of code. A discussion about this paradigm can be found in section 9.4. Since it is incorporated in many tools today, we will elaborate on this model. First, we will elaborate on the structure of the model. Second, we will provide an example. Back.
2.4.6.1 Model Structure The model defines three levels of hierarchy:
• The upper level in the hierarchy are the SQALE Characteristics, as shown in Figure 12, which are a ‘projection of ISO 9126 model on the chronology of a software application’s lifecycle’. This means that the characteristics of the model have a chronological sequence of importance, and failure on one level implies failure on all levels above, since each level conforms to a phase in the
software lifecycle. For example, if maintainability is low, portability and reusability are also compromised, since these characteristics depend on maintainability. Depending on the context in which the model is used, some characteristics may be left out. Efficiency, Security, Maintainability, Portability and Reusability are considered ‘optional’ in the definition of the model.
J.H. Hegeman – Master Thesis – Unrestricted version 30 • Below the top level is the level of sub characteristics. These sub characteristics have a lower
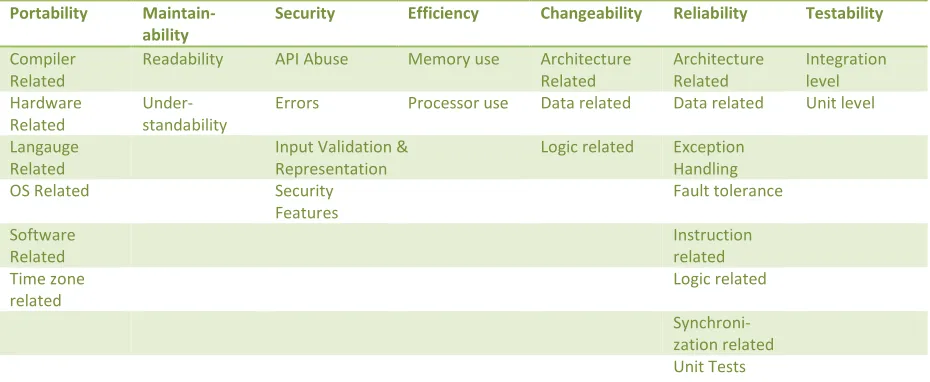
level of abstraction than characteristics. Each sub characteristics is attached to one characteristic, namely the lowest one applicable in the ‘staircase’ as depicted in Figure 12, consistent with the characteristics concept. There is no fixed set of sub characteristics to use, and the SQALE user is free to choose his or her own sub characteristics and their mapping to characteristics. Table 5 show this mapping as implemented as the default model configuration in the Sonar SQALE plugin. Note that the ‘Reusability’ characteristic is left out of this implementation.
• Source code requirements. In SQALE, these are called ‘rules’. Rules are measurable quality-related aspects of sources code, again linked to the lowest possible sub characteristic of the model. Rules can be violated, and the number of violations is essential in determining high-level quality indicators and remediation costs.
Portability Maintain-ability
Security Efficiency Changeability Reliability Testability
Compiler Related
Readability API Abuse Memory use Architecture Related Architecture Related Integration level Hardware Related Under-standability
Errors Processor use Data related Data related Unit level
Langauge Related
Input Validation & Representation
Logic related Exception Handling OS Related Security
[image:30.595.66.531.283.474.2]Features Fault tolerance Software Related Instruction related Time zone related Logic related Synchroni-zation related Unit Tests
Table 5 SQALE mapping of Sub Characteristics to Characteristics (Sonar plugin default model)
2.4.6.2 Rules versus Metrics
While other models may have source code metrics as their lowest-level quality hierarchy components, SQALE uses rules. To be able to comprehend the model, it is important to understand the relation between rules and metrics, since these are not equivalent. A metric, in the context of software source code, is a method to measure a specific aspect of the code. The input is source code and the output is a value (i.e. a number or percentage). A rule, on the other hand, not only measures some aspect of source code, but also decides whether or not the measurement result is to be considered ‘good’ or ‘bad’. When a result is ‘bad’, this is considered to be a ‘rule violation’. To accomplish this, rules incorporate not only a metric, but also parameters that define what is good and bad. Additionally, a parameter exists that defines the remediation cost in units of time per violation. So, a rule is not equivalent to a metric, but has a ‘has-a’ relation to one (and only one) metric. The following two examples clarify this.
J.H. Hegeman – Master Thesis – Unrestricted version 31 violation of this rule and the total remediation costs are 45 minutes times the number of
violations.
- Unit Test line coverage is a metric that measures the percentages of lines of code that are covered by unit tests (Williams 2001). When incorporated in a SQALE rule, parameters would be added that define that the minimum allowable unit test line coverage is, for example, 70% of source code lines without comments and whitelines per class and remediation costs for a violation are 30 minutes. Each class that has a coverage below 70% would be a violation and the total remediation costs are 30 minutes times the number of violations.
The parameter that define good and bad can be a single threshold value (i.e. a minimum or maximum) or can be a function for cases when there is no clear distinction between good and bad. In this case, the function is required to be monotonic on the interval(s) corresponding to non-conforming values, and constant or equal to 0 on non-conforming intervals. Remediation costs can be specified either per violation or per source code file containing one or more violations. Note that a linear relationship between cost, hours of work and lines of code is assumed, so these are considered equivalent and the terms are sometimes used interchangeably.
2.4.6.3 Aggregation of Metrics
All aggregation in SQALE is performed by addition. This way, the SQALE remediation costs for each sub characteristic can be calculated by summing up the remediation costs of violations of all associated rules. This sum of remediation costs is referred to as ‘index’. The index of a characteristic is simply the sum of indices of associated sub characteristics. The overall SQALE quality index is the sum of all characteristic indices. Also, a ‘consolidated index’ is defined for each level of the characteristics ‘staircase’, which is always the sum of indices of the specific level and all levels below.
2.4.6.4 Calculating Ratings
By dividing indices by the size of the artifact that is being analyses, we define the set of ‘density indices’. Since the indices indicate the amount of man-hours needed to repair all issues, the size of the artifact is also expressed in man-hours, namely the amount of man-hours needed to develop the artifact. Out of the SQALE density indices, SQALE ratings can be calculated using a mapping of the continuous range of density indices to a discrete scale of a number of ratings. What is considered ‘good’ and ‘bad’ is left to the user of the model.
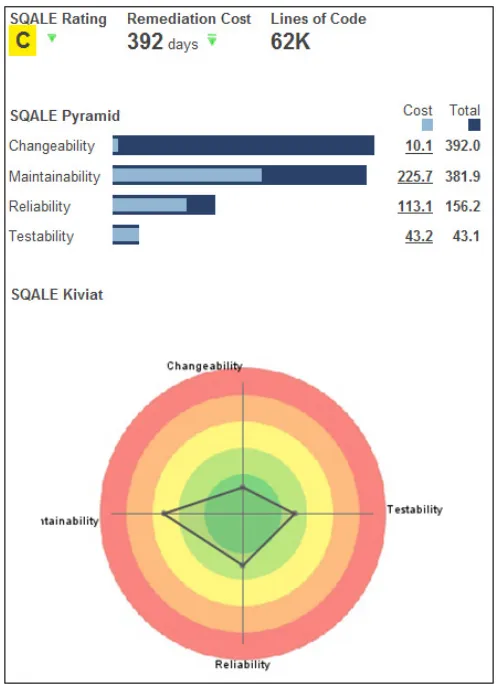
This information also allows us to define a Kiviat. Figure 13 displays a mapping from indices to five ratings, and Figure 14 shows a Kiviat example from the Sonar tool that uses the SQALE model. These ratings provide us the ‘indices’ as defined in the requirements of this research, namely a discrete value on a defined scale. Also note that in this Kiviat diagram, ‘inner’ values, indicated by a point in the green circle, are better than values in ‘outer’
[image:31.595.365.522.343.444.2]Figure 14 Sonar SQALE Kiviat example (screenshot)
[image:31.595.70.268.630.787.2]J.H. Hegeman – Master Thesis – Unrestricted version 32 (red) circles, as oposed to the Kiviat used by Kalistick as described in 2.6.2.3. Reason for this is that in
the remediation cost paradigm, less is better.
J.H. Hegeman – Master Thesis – Unrestricted version 33
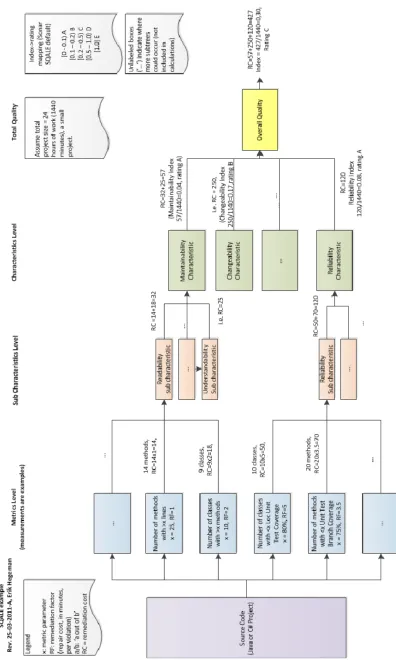
J.H. Hegeman – Master Thesis – Unrestricted version 34 2.4.6.5 Calculation Example
We illustrate the use of SQALE by means of an example. Consider the example of a SQALE quality assessment displayed in Figure 16. This assessment was performed using our Proof of Concept setup (6.2). The assessed project has 62 KLOC of code. SQALE has been configured so that a LOC costs 0.06 man-days to develop, which is the default value. Total development cost, therefore, is 62*0.06*1000=3720 days. The index-rating mapping is defined as follows: A: <0.01, B: 0.01-0.04, C: 0.04-0.16, D: 0.16-0.64, E: >0.64.
The overall SQALE rating, therefore, is 392 days / 3720 days = 0,105, which gets rating ‘C’. This calculation can be performed for each of the characteristics, which has also been done to draw the kiviat. This yields the following scores:
• Changeability:
10.1 / 3720 = 0.0027 Rating ‘A’ • Maintainability:
225.7 / 3720 = 0.061 Rating ‘C’ • Reliability:
113.1 / 3720 = 0.030 Rating ‘B’ • Testability:
43.2 / 3720 = 0.012 Rating ‘B’
2.5.
Discussion
Summarizing, we discussed the following models:
• The McCal model, which introduces a hierarchy to translate metrics to higher-level quality indicators and uses linear regression coefficients to determine the effect of metric values on quality;
• The Boehm model, which predicts the number of defects in software based on 21 indicators relation to different aspects of the development processes;
• The Dromey model, introducing quality-carrying properties of source code artifacts which are asociated to high-level indicators to determine quality
• The SIG model, which is used in a commercial service which focusses on the maintainability aspects of ISO9126 and provides scores on a [1..5] scale for these aspects, based on source code analysis.
[image:34.595.294.543.89.431.2]• The SQALE model that we explained in detail. It uses the concept of rules to determine remediation costs for source code artifacts, and translates these to high-level indicators by a
J.H. Hegeman – Master Thesis – Unrestricted version 35 mapping of rules to sub characteristics, sub characteristics to characteristic and a mapping of
remediation costs divided by development costs to a [A..E] scale.
Now that we have elaborated upon quality models, a few general remarks of discussion should be made. First, it should be emphasized that the implementation of the ISO standard by models, as well as the implementation of the models by tools, is not always strict. Model and tool developers usually appear to be using free interpretations of the entities they are implementing to suit there own needs or preferences. To give an example, the SQALE characteristics ‘look like’ the ISO9126 characteristics, but are not a strict subset (see Table 6 on page 40 for a comparison of ISO9126 to model implementations used in tools.). Also, the SQALE model specifices a number of characteristics to by mandatory in the model, while Sonar SQALE still allows the user to remove these.
Second, all models contain parameters that may be set by the user to conform the business needs or wishes. Most tools have ‘default settings’, so that they run out of the box. In this research, we use expert opinions to validate measurements. We choose to initially run tools (and thus models) with their default settings, because if we were to tweak the models to conform to Info Support wishes, we would need experts to define these settings. This would have an impact on our validation attempt, since the data source of the validation data, the experts, would also be one of the sources of the data to be validated. On the other hand, it will be interesting to see of model calibration by experts will increase the correlation of tool-based quality measurements with expert opinions. This makes it a logical research design choice to perform both an initial ‘uncalibrated’ measurement and a measurement using a quality model configuration calibrated by experts. We will incorporate this thought in the research design as defined in chapter 3.
2.6.
On Quality Assessment Tools
To be able to accomplish the task of software quality assessment, we use software tools based upon software source code quality models. In the initial research phase of this project, tools have been selected to use in the Proof of Concept phase as defined in paragraph 3.1.3. In this section, we report on this selection process by identifying available tools and compare them using several relevant criteria. First, these criteria will be defined and motivated. Second, all identified tools will briefly be described. Third, a comparison of the available tools will be presented, using the criteria identified earlier. Finally, conclusions will be drawn from the comparison. Note that a maximum of two tools will be used for the Proof of Concept phase of this research, due to resource constraints, as mentioned in section 1.5.
2.6.1. Comparison Criteria
Before we can judge about tools we identify, we need to define a number of criteria. Some criteria are ‘kickout criteria’, meaning that meeting these state an absolute requirement. The following criteria have been formulated, and will be elaborated upon in the next sections:
1. Source and License Type
2. Quality Model & Standard Compliance 3. Languages Support
4. Business Model 5. Cost
J.H. Hegeman – Master Thesis – Unrestricted version 36 2.6.1.1 Source and License type
Although a preference for open source tools is superimposed by Info Support, we did not ignore all closed source solutions as of yet, since we may miss interesting tools that have advantages that compensate their closed source. Commercially available products will be investigated, provided enough information can be obtained to be able to assess their suitability.
The license type is relevant since we want to be able to incorporate tools in a professional, for-profit production environment. The tool license should allow this, because if it does not, the tool is not usable in the context of the business aspect of this research. Therefore, this is a kick-out criterion.
2.6.1.2 Quality Model & Standard Compliance
The tool we select is supposed to be using a well-defined quality model. The concept of quality models was explained in section 2.4. Since we have explicitly chosen to use the ISO9126 standard as a foundation for quality assessment, selected tools should be using a quality model that is based upon this standard as well.
We define this as a kickout criterion. An initial quickscan, however, suggests that many tools may use an adapted version of the standard, often documented by terms like ‘inspired by’ or ‘based upon’. We consider this to be allowable, since a requirement of strict standard compliance will kick out too many, or possibly all, potentially interesting tools.
2.6.1.3 Language Support
Tools can support any number of target programming languages. A constraints of this research is that tools are required to at least support both Java and C#. This is therefore a kickout criterion.
2.6.1.4 Business Model
Using third-party tools in a production environment implies that the production environment becomes, to a certain extent, dependent on that third party. This makes is preferably that this third party can continuously provide support, for example by providing software updates and bug fixes. We therefore define a criterion ‘Business Model’, and state the we prefer a model focused on continuity, i.e. a commercial product, or an open source project with sufficient community support, over a model that is less certain to persist, i.e. a single-person initiative or a purely academic research initiative.
2.6.1.5 Cost
Cost may be involved in using third-party tools, for example license or support costs. Also, cost will be involved in the actual implementation of a tool in the software management process at Info Support, but for the purpose of this research we focus on the long term and only consider structural cost.
2.6.1.6 Tool Architecture
J.H. Hegeman – Master Thesis – Unrestricted version 37 determine the management service that