Reducing rework costs in
construction projects
Bachelor thesis
Y.C. Mastenbroek
Colophon
Title:
Reducing rework costs in construction projects
Subtitle:
Learning from rework in realized projects and avoiding rework in the
future
Version:
Final
Date:
14 November 2010
Pages:
91
Author:
Y.C. Mastenbroek
Student #:
s0142298
Contact:
y.c.mastenbroek@student.utwente.nl
Institution:
University of Twente
Department: Civil Engineering
Construction Management & Engineering
Company:
Grupo Williams
Location:
San Pedro Sula, Honduras
Supervisor University of Twente:
Ir. J.E. Avendaño Castillo
Second reviewer University of Twente:
Dr. M. Brugnach
Preface
This document contains the report of my internship at Grupo Willliams (GW) that was conducted to conclude my Bachelor studies of Civil Engineering at the University of Twente. GW is a real-estate and construction company based in Honduras, Central America. GW has several offices around Honduras and their projects mainly consist of residential projects or commercial constructions (shopping malls, offices, warehouses etc). During the last three months I have been working as an intern at their main office in San Pedro Sula, where approximately 50 people work on a daily basis. My research focused on rework costs and events, one of the most frequent failure costs in construction in general. These failure costs tend to be even higher in construction projects in developing countries such as Honduras. The goals of this study were assessing rework costs in GW's projects and suggesting improvements to mitigate rework costs in future projects. The assessment was done through analysis of realized projects. At first a financial analysis was done to determine the amount of rework costs GW is dealing with. To find the causes of the rework events personnel was interviewed. Based on these analyses and information gathered from existing literature recommendations and suggestions for improvement were made. This report contains the results of this research.
This research would not have been possible without the help of some people. First I would like to thank Ir. Jimmy Avendaño Castillo, my supervisor at the University of Twente. He was always willing to provide feedback to my progress and his advice and knowledge were of great assistance. Besides the professional support he also arranged a guest family and my Spanish course. Thanks to the family Flores for making me feel at home even though Honduras is a country totally different from the Netherlands. Also my gratitude goes out to all the employees at GW, especially those who helped me conduct this research, namely Ing. Juan Carlos Molina, Arq. Nelly Paredes, Arq. Mireya Lean, Ing. Dagoberto Palma and Ibeth Raudales. Finally I would like to thank Ing. David Williams and Lic. Evy Williams for giving me the opportunity to conduct my Bachelor thesis at their company.
San Pedro Sula, Honduras, July 2010
Summary
In this report the results of the research on rework events in construction projects of Grupo Williams (GW) are presented. The objective of the research has been formulated as: "To assess rework costs in construction projects of Grupo Williams and suggest improvements to reduce these rework costs."
The assessment was done through analysis of realized projects. At first a financial analysis was done to determine the amount of rework costs GW is dealing with. Secondly, to find the causes of the rework events personnel was interviewed. Based on these analyses and information gathered from existing literature recommendations and suggestions for improvement were made.
Failure costs are all costs that are made unnecessarily to reach the final product. Rework costs are an example of failure costs. Rework has been defined as:"The unnecessary effort of re-doing a process or activity that was incorrectly implemented the first time." Rework can have severe consequences, such as cost overruns and time overruns. Besides these direct consequences, there might also be indirect consequences, such as stress, de-motivation or loss of future clients. Rework events can have many different origins and for this research they have been categorized into four categories; changes, errors, omissions and damages.
To assess the gravity of rework costs in GW's projects the financial results of several realized projects have been analyzed. Rework indicators (labour, material, cost, or time overruns and revised contract values) have been studied and from these studies several conclusions were drawn. It was concluded that GW deals with high failure costs, cost overruns of up to 54% were identified and that rework makes up a large part of these cost overruns. Change orders were also very frequent and were found to be the most important cause of rework events.
The causes were further analyzed by interviewing employees. Based on existing literature an extensive list of rework causes was made and during the interviews the interviewees were asked to confirm or deny statements regarding rework causes. The causes that were most frequently confirmed, can be grouped into the understanding categories. 50% of the causes are change-related, 37% is error-related and 13% falls into another category.
Change orders Lack of coordination Late material deliveries
Changes to construction methods Personnel-related causes
Contents
Colophon ...ii
Preface ... iii
Summary ... iv
List of tables and illustrations... viii
1 Problem identification ... 1
1.1 Problem description ... 1
1.2 Research objective ... 1
1.3 Research questions... 2
1.4 Structure of report ... 2
2 Research methodology ... 3
2.1 Qualitative analysis of finished projects ... 3
2.2 Rework definition ... 3
2.3 Inventorisation of possible rework causes ... 3
2.4 Checklist/model ... 3
2.5 Interviews ... 3
2.6 Conclusions & recommendations... 4
3 Theoretical framework ... 5
3.1 Failure costs ... 5
3.2 Rework definition ... 5
3.3 Consequences ... 7
3.3.1 Gravity of consequences from literature ... 8
3.4 Causes ... 9
3.4.1 Departments/phases ... 9
3.4.2 Categories ... 9
3.5 Scope ... 10
4 Qualitative analysis of finished projects ... 12
4.1 Analysis methodology ... 12
4.2 Projects ... 13
4.2.1 Proyecto Banco Lafise ... 13
4.2.2 Proyecto Cervezeria Hondureña ... 14
4.2.3 Proyecto Aimar ... 14
4.2.4 Proyecto Cigrah ... 15
4.3 Conclusions regarding possible rework ... 17
4.4 Conclusions regarding financial project evaluation & accounting ... 18
4.4.1 Uniformity balance sheets and accounting & end result overview ... 18
4.4.2 Standardization balance sheets (and tenders) ... 19
5 Set-up quantitative analysis of finished projects ... 20
5.1 Model/Checklist ... 20
5.2 Interview strategy ... 22
5.2.1 Checklist as basis ... 22
5.2.2 In-Person interviews ... 22
5.2.3 Standardized vs. non-standardized interviews ... 23
5.2.4 Open vs. closed questions ... 23
5.2.5 Use of scaling ... 23
5.2.6 Things to avoid ... 23
5.2.7 Risks regarding interviews ... 24
6 Outcomes of quantitative analysis ... 25
6.1 Proyecto Banco Lafise ... 25
6.2 Proyecto Cerveceria Hondureña ... 25
6.3 Proyecto Aimar ... 26
6.4 Proyecto La Cigrah ... 26
6.5 Proyecto Panaderia Jerusalen ... 27
6.6 Summary... 27
7 Reliability quantitative analysis ... 30
7.1 Ratios of confirmed indicators ... 30
7.2 Discrepancies ... 31
7.3 Alternate form reliability ... 31
8 Avoiding rework ... 32
8.1 Change orders ... 32
8.2 Lack of coordination ... 33
8.3 Late material deliveries ... 34
8.4 Construction methods ... 34
8.5 Personnel ... 35
9 Inter-project learning & project evaluation ... 36
9.1 Reporting rework events ... 36
10 Conclusions & recommendations... 39
10.1 Conclusions ... 39
10.2 Recommendations... 41
10.2.1 Avoiding rework ... 41
10.2.2 Reporting rework & database ... 42
10.2.3 Rework monitoring checklist ... 42
10.2.4 Financial evaluation & accountancy ... 42
10.2.5 Work preparation ... 43
10.2.6 Other failure costs ... 43
References ... 44
Appendix I: Model ... 47
Appendix II: Financial analysis proyecto Banco Lafise ... 48
Appendix III: Financial analysis proyecto Cerveceria Hondureña ... 49
Appendix IV: Financial analysis proyecto Aimar ... 50
Appendix V: Financial analysis proyecto Cigrah ... 51
Appendix VI: Financial analysis proyecto Panaderia Jerusalen ... 52
Appendix VII: Interview assertions ... 53
Appendix VIII: Interview example ... 56
Appendix IX: Interview example II (Spanish version) ... 59
Appendix X: Confirmed indicators per project ... 60
Appendix XI: Confirmed indicators summarized ... 62
Appendix XII: Reliability analysis ... 64
Appendix XIII: Coordination activities ... 70
Appendix XIV: Paper form & Microsoft Access database... 71
List of tables and illustrations
Table 1 Amounts of rework in projects ... 8
Table 2 Overview of analyzed projects ... 13
Table 3 Financial analysis of proyecto Banco Lafise ... 14
Table 4 Financial analysis of proyecto Cerveceria Hondureña... 14
Table 5 Financial analysis of proyecto Aimar ... 15
Table 6 Financial analysis of proyecto Cigrah... 16
Table 7 Financial analysis of proyecto Panaderia Jerusalen ... 17
Table 8 Model codification explained ... 20
Table 9 Model ... 21
Table 10 Summary confirmed indicators overall and legenda revised model ... 27
Table 11 Revised model including frequency of occurrence of indicators after interviews ... 28
Table 12 Cronbach's alpha ... 31
Table 13 Alternate form reliability outcomes ... 31
Table 14 Model including literature sources ... 47
Table 15 Financial analysis proyecto Banco Lafise ... 48
Table 16 Financial analysis proyecto Cerveceria Hondureña ... 49
Table 17 Financial analysis proyecto Aimar ... 50
Table 18 Financial analysis proyecto Cigrah ... 51
Table 19 Financial analysis proyecto Panaderia Jerusalen ... 52
Table 20 Overview of interview assertions in English and Spanish ... 55
Table 21 Confirmed indicators Banco Lafise ... 60
Table 22 Confirmed indicators Cerveceria Hondureña ... 60
Table 23 Confirmed indicators Aimar ... 61
Table 24 Confirmed indicators Cigrah ... 61
Table 25 Confirmed indicators Panaderia Jerusalen ... 61
Table 26 Overview confirmed indicators and their frequencies ... 63
Table 27 Example Alternate form reliability analysis ... 69
Table 28 Most important coordination activities adopted from Jha & Iyer (2005) ... 70
Table 29 Description of characteristics of rework events in Microsoft Access database ... 72
Figure 1 Research methodology schematically ... 4
Figure 2 The quality control rework cycle (AEW Services, 2001) ... 6
Figure 3 Rework process ... 7
Figure 4 Indicators by category ... 29
Figure 5 Bar chart frequency indicators ... 63
Figure 6 Total confirmed indicators ... 64
Figure 7 Confirmed indicators project manager 1 ... 65
Figure 8 Confirmed indicators project manager 2 ... 65
Figure 9 Confirmed indicators designer ... 66
Figure 10 Confirmed indicators compared ... 66
Figure 11 Rework report form (in Spanish) ... 74
Figure 12 Impression of Microsoft Access database 1 ... 75
Figure 13 Impression of Microsoft Access database 2 ... 75
Figure 14 Rework database: Form ... 76
Figure 15 Rework database: Report ... 77
Figure 16 Editing dropdown boxes in Microsoft Access ... 78
1
Problem identification
This chapter will introduce the problem, that many construction or real-estate companies deal with, that this research will be about. It is a general problem in the construction business all over the world but the problem tends to be bigger in developing countries. The research objectives will be stated and research questions will be raised in this section as well.
1.1
Problem description
Engineering projects can fail for many reasons. In many real-estate projects total costs exceed the expected costs and because of that the company gains less profit than calculated. In some cases it might even gain no profit at all or even worse, incur losses. These additional costs are often referred to as failure costs. Examples of failure costs are time delay (when deadlines are not reached) and cost overrun. These costs can have many origins such as bad material management, downtime or rework. This research will focus on one specific cause of failure costs, namely rework.
When delivered products do not meet the requirements or expectations, work often has to be redone. Rework occurs in various phases of the construction process or in various divisions of a company. Rework can occur on the construction site or in a management department due to for example bad materials management. The last has already been researched at GW by Ten Klooster (2009). Rework can also have internal or external origins. Changes in clients’ expectations are an example of an external factor that might lead to rework. Rework can cause many costs to be higher than calculated at the start of the project.
Previous studies by P.P.A. Zanen(Zanen, 2008) and M. ten Klooster (ten Klooster, 2009) have proven that the problems stated above are also reality for GW. P.P.A. Zanen states that the quality of the deliverables, in this case houses, is determined based on functionality and aesthetics. This means that everything in the house should work, such as electricity and water, once it is delivered and that the finishings such as paint, doors, windows and ornaments should be to the client’s satisfaction. Quality of work is verified by regular inspections of the project’s supervisor. Unfortunately the quality is not always as desired and work has to be redone, which has a negative effect on the project schedule and costs (Zanen, 2008).
1.2
Research objective
Based on the problem description a research objective and research questions can be formulated.
To assess rework costs in construction projects of Grupo Williams and suggest improvements to reduce these rework costs.
This main objective can be divided into sub-objectives. To assess rework costs in construction projects of GW To determine the most relevant rework causes
1.3
Research questions
These sub-objectives will be reached by answering the following research questions.
To assess rework costs in construction projects of GW
How much rework costs occur at projects of GW? What or who causes the rework?
How is the rework classified? How did the rework affect time?
To determine the most relevant rework causes
What causes most of rework?
What causes the highest rework costs? Which causes should be taken on?
To suggest improvements to reduce these rework costs
How can the causes of rework be reduced or avoided completely? How can GW implement the suggested improvements?
How can GW learn from projects to reduce rework costs in the future?
1.4
Structure of report
In Chapter 2 the research methodology is presented. After these introductions to the research a theoretical background of the studies' scope is presented in Chapter 3. From existing literature a definition for rework is given, and the causes and consequences of rework events are described as well. In the last paragraph of this chapter the scope of this study is presented.
To get an idea of the amount of rework costs within GW, financial records for five realized projects have been studied. The findings are presented in Chapter 4. First the projects are individually discussed after which general conclusions regarding the financial analysis are drawn.
Interviews were held to find the causes of rework. The way these interviews have been set up is described in Chapter 5, the findings in Chapter 6 and the reliability of the data from the interviews is analyzed in Chapter 7.
After the causes had been identified, suggestions for improvements were given. The improvements consisted of suggestions based on theoretical research (Chapter 8) and the development of a rework database and a rework monitoring tool (Chapter 9).
2
Research methodology
To be able to answer the research questions formulated above several activities have to be carried out. Therefore a research approach, or methodology, has been defined in the preparatory report. The main idea of the proposed methodology has also been followed during my research. The methodology has been schematically depicted in Figure 1, this figure gives a clear and structured overview of the different steps that have been taken during this research. The research methodology will briefly be explained in this section.
2.1
Qualitative analysis of finished projects
Evaluating finished projects can give an idea of the gravity of rework problems within a company's projects. There are several factors that indicate that rework might have happened. In the preparatory phase of this study these indicators have already been identified namely: material, labour, time and total costs. During the research, contract value has also been identified as an indicator. By comparing the estimated amounts of these indicators with the actual realized amounts, an idea of the total failure costs can be presented. This does not result in the actual percentage or costs contributed by rework, it merely shows the gravity of the problem. The evaluations of finished projects are input for the interviews and it is also possible that conclusions can directly be drawn from them. This part of the research will be explicitly described in Chapter 4.
2.2
Rework definition
To be able to conduct this research it is of great importance that the term "rework" has been clearly defined. In existing literature several definitions have been used and therefore different methodologies have been applied and different conclusions were drawn. Defining rework is part of the theoretical framework, Chapter 3.
2.3
Inventorisation of possible rework causes
The evaluation of finished projects is not enough to give a reliable idea of rework occurring within the projects of GW because information has not been collected that detailed. To be able to conduct this research possible causes or indicators of rework must be analyzed. They form a very important part of the model, explained below. Through thorough reviewing of literature many possible causes have been identified. Of course there might be specific causes within a project or new causes might arise in future projects. The inventorisation has not been fully described in this report but the main outcomes can be found in paragraphs 3.4 and 5.1.
2.4
Checklist/model
The checklist/model can be considered as the basis for this research. The definition of rework and the list of possible causes (explained above) are the input for the model. In the model causes have been classified and codified to keep it structured. This model is also the most important input for the interviews. It can be found in Chapter 5.1.
2.5
Interviews
interviews was determining what the causes of the rework, that occurred in specific projects, were. The interviews provide information about the most relevant (sub-) causes.
Every possible cause in the checklist has been questioned for its occurrence in the projects in the interview and the interviewee could rate a cause for its relevance by using a scale. The interview will be explicitly explained in Chapter 5.2 and an example of the interview can be found in Appendix VIII. Once the interviews had been drawn up, they were conducted. For every project 2 or 3 people have been questioned. The interviews were face-to-face when possible to be able to explain any possible ambiguities and go more into detail when necessary. Afterwards the reliability of the data derived from the interviews has been analyzed and the data has been presented in a structured way to be able to draw conclusions at a glance. There has also been feedback to the checklist.
2.6
Conclusions & recommendations
[image:13.595.55.565.326.745.2]Once the most relevant causes had been found, suggestions for improvement have been made, see Chapter 8 and 9. The conclusions, recommendations and possible subjects for further research are presented in Chapter 10.
Figure 1 Research methodology schematically
Model
Checklist
(Ch. 5.1)
f
Rework definition (Ch.
3.2)
Inventorisation of possible rework causes
(Ch. 3.4&5.1)
Qualitative analysis of finished projects (Ch.
4) Interview strategy
(Ch. 5.2) Outcomes of
interviews (Ch. 6)
Reliability analysis (Ch. 7)
Conclusions
(Ch. 10.1)3
Theoretical framework
In this chapter the theoretical background for the research will be described. Failure costs in general will be briefly raised, but since this research focuses on rework costs, there is no need to explain this term very elaborately. Far more important is defining rework as is explained above. Furthermore the consequences of rework will be raised. The results from researches on rework in the past will also be discussed to gain insight in the gravity of the problem. Another very important part of the literature studies was finding possible rework causes, because this is the basis for the model. The theoretical framework described in this chapter delineates the scope of this research study.
3.1
Failure costs
Failure costs are all costs that are made unnecessarily for the final product. Failure costs are caused by an inefficient construction process, by non conformances with the agreed quality claims or because aspects have to be repaired or replaced. (SBR, 2005)
Another, but similar, definition is presented by Love & Edwards (2005) where non-conformance or failure costs are defined as "the cost of inefficiency within the specified process, i.e., over resourcing of excess, materials and equipment rising from unsatisfactory inputs, errors made, rejected outputs, and various other modes of waste" (British Standard BS 6143, 1992).
Failure costs consist of many different costs, a few are; waiting for information, materials or tools, unused equipment or resources, reduced productivity, rework and handling complaints. (AEW Services, 2001) This research will focus on one of these costs, namely rework costs. Therefore there is no need to describe failure costs more elaborately. Love and Irani have concluded that rework is the primary factor of failure costs and time overruns (Love & Irani, 2002b).
3.2
Rework definition
Quite some researches about rework in construction companies have already been executed by several researchers. All of them defined rework or applied someone else's definition at the start of their research. Different definitions of rework are used and therefore different methodologies applied and different conclusions drawn. To be able to answer the research questions a clear definition has to be chosen.
Definitions of rework found in existing literature are: Construction Industry Development Agency (1995):
"Doing something at least one extra time due to nonconformance to requirements" Ashford (1992):
"The process by which an item is made to conform to the original requirement by completion or correction"
Love & Li (2000):
"The unnecessary effort of re-doing a process or activity that was incorrectly implemented the first time"
Josephson, Larsson & Li (2002):
This last definition by Josephson, Larsson & Li is not complete enough as will be made clear later in this chapter. The scope of this research will be wider than just construction errors. Therefore this definition is not applicable. The definition given by Love & Li is based on the definitions of CIDA and Ashford and will therefore be used to define the rework that will be analyzed in this research.
Rework is: "The unnecessary effort of re-doing a process or activity that was incorrectly implemented the first time."
Figure 2 shows the rework cycle in a construction process. At a certain moment during construction, due to for example an error, rework is necessary. But the rework might not be discovered until some form of quality control, after which can be concluded what kind of rework needs to be done and the work start again. This cycle continues until the work has been satisfactorily completed.
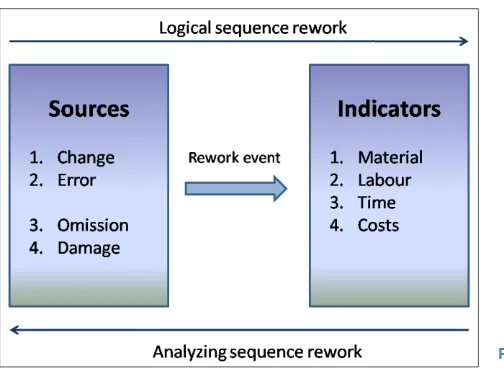
[image:15.595.72.528.186.402.2]Figure 3 shows the rework process from another perspective. There is a certain cause for rework, the rework event as explained above occurs and the rework influences several factors, the indicators. The causes and consequences of rework will be explained elaborately in the next paragraphs.
3.3
Consequences
Rework can lead to several overruns, and so these overruns indicate that somewhere in the construction process rework might have occurred. This characteristic will be used to locate possible rework in finished projects as has already been explained in the research methodology section. Indicators of rework are mentioned below.
Redoing things takes time and might therefore lead to time delay. Rework can definitely influence the project planning. Time overrun might be a consequence of rework.
A second indicator is labour overrun. If work has been done incorrectly this can be seen as non-productive time and rework takes effort and thus extra labour. If more hours (and thus more labour costs) were needed to realize a project than estimated, it might have been because of rework actions.
Rework often means that parts of a structure have to be scrapped and new material is needed to rebuild it. Extra material used might indicate rework as well.
The factors mentioned above have one thing in common. Delay, extra labour and extra materials cost money and cost overrun might therefore be the most important indicator for rework.
These are all direct consequences of rework. They are rather easy to identify if administration has been done properly. There are also many indirect consequences of rework (Love P. E., 2002a). Firstly, there are the indirect costs of rework, these are a lot harder, if not impossible to trace. For example, the direct cost of a particular rework consist of the labour costs for the time needed for the rectification and the extra materials that were used. Though the employee might have to travel to the construction site, in the meantime not being able to work elsewhere. So there is the hourly payment for the travelling time and the additional loss of productivity. These are examples of indirect costs. Love found the indirect costs to be as high as six times the direct costs.
There are also several more indirect consequences of rework that are a lot harder to express in terms of money or costs. Additional indirect consequences of rework might be (Love P. E., 2002a):
[image:16.595.72.324.63.248.2] End-user dissatisfaction Inter-organizational conflicts Stress
Fatigue
Work inactivity De-motivation Loss of future work Absenteeism Poor moral Reduced profit
Damage to professional image
These factors can hardly be assigned a monetary value but can greatly influence a company's present or future well-being.
3.3.1 Gravity of consequences from literature
Many research studies have sought to determine the amount of rework costs within projects. To give an idea of the gravity of rework problems construction companies deal with, Table 1 shows several studies and their findings. This table has been adapted from Love & Edwards (2004). Only numbers that represent rework are shown. Several studies have tried to determine all failure costs as well, they sometimes found numbers as high as 25 to 35 % of the contract values of project costs.
We must take into account that as a result of differences in definitions, scope, data collection methods used, and whether rework is calculated as a proportion of project or contract value, these numbers are not fully comparable. They do give an idea of the scale of rework. For example, the total costs of rework for the Australian construction industry has been estimated at 4.3 billion Australian Dollars, that is just over 3 billion €. (Love & Sohal, 2003)
Author Country Costs Comments
Cusack (1992) Australia 10%* * = % of contract value
† = % of project costs
Burroughs (1993) Australia 5%*
CIDA (1995) Australia 6.5%*
Lomas (1996) Australia >1%*
Love et al. (1999) Australia 2.4% & 3.15%*
Love (2002) Australia 6.4%*
CIDB (1989) Singapore 5-10%†
Hammarlund et al. (1990) Sweden 6%†
Josephson & Hammarlund (1990-1996)
Sweden 2.3-9.4%*
Josephson et al. (2002) Sweden 4.4%*
Burati et al (1992) USA 12.4%†
[image:17.595.67.460.438.631.2]Abdul-Rahman (1993) UK 2.5-5%*
Table 1 Amounts of rework in projects
Frimpong et al. (2003) concluded that in Ghana 75% of the studied projects had cost and time overruns and Reffat (2004) states that in many developing countries the majority of construction projects have overruns because of lack of management skills. He also claims that without reducing failure costs sustainable development is not possible. Azhar et al. (2008) concludes that cost overrun is a very frequent phenomenon but that this trend is more severe in developing countries where the overruns sometimes exceed 100% of the anticipated cost of the project. Generally we can conclude that cost overruns, and thus most likely rework costs as well, are higher in developing countries than in the western countries where most studies have taken place.
3.4
Causes
There are many possible causes of rework. By studying many existing research studies many possible causes have been identified. In these studies many authors identified similar causes. To prevent the repeated occurrence of similar causes in the model and consequently a very extensive model, more or less similar causes have been taken together. Not all causes will be listed in this chapter, since 45 possible causes have been identified. These 45 causes can be found in the model described in paragraph 5.1. In this chapter the main categories of causes will be mentioned and some examples will be given.
3.4.1 Departments/phases
Rework can occur in pretty much any phase in the construction process or in any department of a company. Burati et al (1992) studied rework in five major areas; design, construction, transport, fabrication and operability. But rework can also occur in the management, administration or accounting department. Most research about rework has studied solely the design and construction phases.
3.4.2 Categories
Most studies on rework have been executed by Peter E.D. Love. In all of his studies he classifies rework into four categories; change, error, omission and damage. This categorization had already been applied by Farrington in 1987. He provides the following definitions:
Change: a directed action altering the currently established requirements
Error: any item or activity in a system that is performed incorrectly resulting in a deviation Omission: any part of a system including design, construction, and fabrication, that has been
left out resulting in a deviation
During a project many changes can occur. Some changes are attended, some unattended and both can have positive and negative influences on the project. Unattended dynamics have not been taken into account at the start of the project and might therefore influence the costs of a project. (Love et al., 2002c)
Love and his fellow researchers state that these changes in circumstances can result in for example downtime and rework, not all the changes he mentioned will lead to rework. Internal uncertainties might be:
Organization-related: different project stages require different skills, different contributors and other resources. Project participants vary through the construction process.
Finance-related: a company’s financial capability/policies can change. The changed financial status of any party within the project team can affect, or in the extreme even jeopardize the project’s expected outcome.
Interest-related: although all project participants may appear to desire realization of project goals, the interactive constraints and interests between disciplines often cause conflict. This can hinder co-operation in dealing with changes and affect performance.
Human-related: the effectiveness of human resources might change External uncertainties might be:
Government-related: regulations, taxes. interest rates
Economy-related: inflation, exchange rates, market competition, availability of labour, materials and finance
Social: changing social environment, resistances Legal: changes in legislation: safety or planning laws
Technological: materials, techniques, labour, facilities, machines Institutional influences: codes of conduct, education regulations
Physical conditions: infrastructure, transportation, degree of saturation, district development plans
Acts of God/Force Majeur: weather, natural disasters
As explained above, rework might also occur due to errors, omissions and damage.
Construction errors are the result of incorrect construction methods and procedures and are human-related.Some examples of origins of errors are; certain aspects have been overlooked, lack of or bad communication, poor coordination and integration and lack of skills and training. Regardless of the skill level, experience, or training that individuals possess, errors and omissions may be made at any time. (Love et al., 2009)
Construction omissions are those activities that occur due to omission of some activities and damage may be caused by employees, subcontractors, weather conditions or natural disasters.
3.5
Scope
4
Qualitative analysis of finished projects
The first step of the actual research was the qualitative analysis of finished projects. As already has been stated in the research methodology section, evaluating finished projects can give an idea of the gravity of rework problems within a company's projects. First will be described how the analysis was conducted. After that the results will be presented per project.
4.1
Analysis methodology
In the preparatory phase a plan was made on how to analyze the finished projects. Data of finished projects would be the main source for this part of the research. There are several factors that indicate that rework might have happened; material, labour, time and total costs. By comparing the estimated amounts of these indicators with the actual realized amounts, an idea of the total failure costs could be presented. This would not result in the actual percentage or costs contributed by rework, it would merely show the gravity of the problem. But before an overview of the estimated and realized amounts of the stated indicators could be presented, data had to be collected. Work breakdown structures (WBS) and a projects’ planning had been identified as possible sources to analyze data from finished projects. The necessity to always use the WBS and planning drawn up at the same time in a projects’ process has also been identified in the preparatory phase of this study. The estimated amounts can vary quite a lot and therefore it is important to always use comparable data. Same goes for the collection of the realized data. There might be several moments in time when the results of a project are assessed.
Unfortunately there was less data available at GW and the data that was available was often not reliable. Gathering the estimated amounts was not the major problem. The tender sent to the client that was used to draw up the initial contract was used to gather information on the estimated amounts. It included total costs, direct costs, indirect costs and contract value. And the estimated amounts of labour costs and material costs could also be calculated from this tender. The contract value has been added as an indicator for rework since a change in contract value often implies changes to the design. Even though the costs are passed on to the client, these changes can still cause rework and the associated (indirect) consequences. For most of the projects there was also a Gantt chart available that showed the estimated amount of days to complete the project.
Analyzing the realized amounts was more of an issue. The balance sheet (departemento de presupuestos) and costs reported by the accounting department (contabilidad) where used. For all projects a balance sheet had been drawn up which included the estimated amounts, the realized amounts, the initial contract value and the actual contract value. Unfortunately these balance sheets were often not complete or did not correspond with the amounts that were received from contabilidad. The results from contabilidad were not complete either, since they did not include costs from subcontractors. In several cases the realized costs were found to be several dozen percentages lower than the estimated amounts, which is highly unlikely, making these numbers unreliable. Also in the balance sheets direct costs were not split up into labour and material, so often numbers from both the balance sheet and contabilidad were used.
The numbers that were likely to be the most realistic were used to analyze the projects. Even though they were often not complete, some indicators for rework were still identified. Another disappointment was the lack of documentation of the realized planning. For most of the projects the actual amount of days of construction had not been documented and could not be provided, making it impossible to provide an answer to the question how rework affected time in the projects. Also intermediate evaluations were not useful since they only included amounts that had been paid by the client.
4.2
Projects
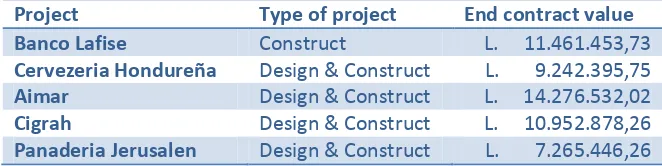
In total five projects have been analyzed. Most of GW's projects are design & construct but at times they also take up projects for which the design has been made elsewhere. In Table 2 the projects are briefly presented. Each project will first be analyzed individually and at the end a short comparison will be made. The complete financial analyses can be found in Appendix II - VI.
Project Type of project End contract value
Banco Lafise Construct L. 11.461.453,73
Cervezeria Hondureña Design & Construct L. 9.242.395,75
Aimar Design & Construct L. 14.276.532,02
Cigrah Design & Construct L. 10.952.878,26
[image:22.595.64.395.279.362.2]Panaderia Jerusalen Design & Construct L. 7.265.446,26 Table 2 Overview of analyzed projects
4.2.1 Proyecto Banco Lafise
Most of the projects of GW are design-construct contracts, this project however has been designed elsewhere. The project includes the renovation of the office of Banco Lafise in San Pedro Sula, a large bank in Central America. The design was made by a company in Nicaragua.
As already mentioned in the example above, the financial evaluation of this project is not very solid. The balance sheet (presupuestos) does not correspond with the numbers from the accounting department (contabilidad). The total realized costs according to the balance sheet were L. 4.952.679,92. The costs accounted for by the accounting department were L. 7.882.971,08: a difference of almost 60%. The numbers from the accounting department are more realistic and more detailed and have therefore been used. These numbers are not complete either though. Payments to subcontractors were not included in the overview that was provided. Taking into account that a part of these contracts is material cost and another part labour cost, the realized amounts for these indicators are higher than presented. Especially the labour cost comparison is unreliable, a 57% reduction is very unlikely. Since a lot of costs are missing only conclusions that do give some kind of useful information will be presented. The analysis of the indicators lead to the following findings:
Material costs were 27% higher than estimated (this percentage is probably even higher since subcontracts are missing)
The end contract value was 14% higher than the original contract Seven change orders have been made
Rework indicator Estimated amount
Actual amount % difference
Material L. 4.341.685,59 L. 5.494.121,88 +27%
Labour L. 4.028.840,12 L. 1.739.462,41 - 57%
Time 107 days N.A. N.A.
Total costs L. 9.205.185,48 L. 7.882.971,08 - 14%
Contract value L. 10.068.315,57 L. 11.461.453,73 +14%
Table 3 Financial analysis of proyecto Banco Lafise
4.2.2 Proyecto Cervezeria Hondureña
This is a very recent project of GW. Both the design and construction of the new office/warehouse of la Cerveceria Hondureña have been in GW's hands. La Cerveceria Hondureña is the producer of many drinks, sodas and beers in Honduras. The construction was mostly metal-based.
Again the information from the balance sheet (presupuestos) and the accounting department (contabilidad) did not correspond. Only this time the numbers from the balance sheet were higher but since they approached the estimated numbers a lot more, these were used for the comparison. The costs listed on the turnout received from the accounting department were an average of 37% lower than estimated, but again subcontracts were missing. But when a printout of the subcontracts was received, the total costs were still lower than the costs on the balance sheet made up by the project manager.
The balance sheet did include subcontracts, unfortunately it was not clear which part of the costs of the subcontract was attributable to materials and which part to labour. The same ratio between material and labour cost for GW directly has been assumed. A realized time schedule was again not available. The most important conclusion is:
Estimated labour costs were exceeded by 13%
In Table 4 a summary of the numbers for Cerveceria Hondureña is presented. The red marked numbers indicate that rework might have happened.
Rework indicator Estimated amount
Actual amount % difference
Material L. 4.488.389,39 L. 3.817.078,80 - 15%
Labour L. 2.761.802,09 L. 3.120.917,72 +13%
Time 120 days N.A. N.A.
Total costs L. 8.429.626,85 L. 7.539.116,01 - 11%
Contract value L. 9.242.395,75 L. 9.242.395,75 0%
Table 4 Financial analysis of proyecto Cerveceria Hondureña 4.2.3 Proyecto Aimar
This project included the design and construction of several offices and warehouses near the airport of San Pedro Sula.
numbers are not exactly the same but differences are negligible. This is due to the fact that the accounting department processed some additional costs after the balance sheet had been drawn up. However in the balance sheet additional costs have been added under the name "notas de creditos", credits or expenses. It does not become clear what these expenses are. They might be subcontracts and thus include both materials and labour but since this is too uncertain, they have been added under total costs. Again subcontracts were not included in the numbers supplied by the accounting department. Because of this the realized material and labour costs are once more unreliable and since they are a lot lower than estimated they do not provide any information about possible rework. For this project there was actually a work planning available that showed how work had been carried out. This schedule and the indirect costs provided indications of rework occurring in proyecto Aimar. The change orders were rather slim but as well indicate that rework might have occurred:
Indirect costs were 159% higher than estimated
The estimated time schedule was overrun by 37 days, an overrun of 26% Two change orders were made although they were rather slim
In Table 5 a summary of the numbers for proyecto Aimar is presented. The red marked numbers indicate that rework might have happened.
Rework indicator Estimated amount
Actual amount % difference
Material L. 7.140.220,77 L. 5.205.622,50 - 27%
Labour L. 4.022.856,35 L. 2.684.297,44 -33%
Time 145 days 182 days +26%
Total costs L. 11.621.008,14 L. 10.526.628,84 -9%
[image:24.595.63.439.371.468.2]Contract value L. 13.997.163,46 L. 14.276.532,02 +2%
Table 5 Financial analysis of proyecto Aimar
4.2.4 Proyecto Cigrah
The information received from this project leaves much to be desired. First of all an estimated chronogram of the work was not even available, let alone a realized chronogram. Time as an indicator of rework could thus not be analyzed. Secondly the estimated costs in the tender only included direct costs (labour and materials), indirect costs were not included. Then there is the way the balance sheet (presupuestos) has been drawn up. The realized costs once more do not correspond with the numbers from the accounting department (contabilidad), although according to the project manager the numbers were received from the accounting department. But the difference is considerable, the numbers used in the balance sheet are 1,4 million Lempiras lower. This time the estimated costs assumed in the balance sheet do not even correspond with the estimated amounts in the tender.
do have to take into account that the estimated costs do not include indirect costs but since the realized indirect costs are very small, less than 2% of the total costs, this can be neglected.
The numbers from the accounting department have been used to compare the estimated and realized amount. A very high cost overrun can already be noticed but since subcontracts are not included they might even be higher, and looking at the very low realized material costs this is quite likely. Especially the overrun for labour costs is extreme, an overrun of 232%.
The following conclusions regarding to rework can be drawn: Labour costs had an extremely high overrun of 232% Total costs had a 54% overrun
Three change orders resulted in a 40% higher contract value Estimated profit was L. 999.846,47
Realized profit was L. 478.084,23 - Profit was 52,2% lower: L. 521.762,24
In Table 6 a summary of the numbers for proyecto Cigrah is presented. The red marked numbers indicate that rework might have happened.
Rework indicator Estimated amount
Actual amount % difference
Material L. 4.426.865,64 L. 2.359.979,94 - 47%
Labour L. 2.383.696,88 L. 7.911.606,64 +232%
Time N.A. N.A. N.A.
Total costs L. 6.810.562,52 L. 10.474.794,03 +54%
Contract value L. 7.810.408,99 L. 10.952.878,26 +40%
Table 6 Financial analysis of proyecto Cigrah
4.2.5 Proyecto Panaderia Jerusalen
Once more the balance sheet (presupuestos) and accounting department (contabilidad) present different costs. The costs presented by the accounting department are again not very useful since subcontracts are missing. The subcontracts are included in the balance sheet and therefore the results presented there are also more likely to be realistic. Unfortunately the balance sheet does not present the costs for materials or labour separately. It seems to be missing indirect costs as well. The balance sheet has also been drawn up totally different than the ones from the previous projects. Consistency in the way of evaluating projects is hard to find. A comparison of the estimated and actual amount of construction days could not be made since both schedules were missing.
Whether using the balance sheet or the combined data every single indicator encounters overruns in this project. The only difference is the gravity. The following conclusions can be drawn:
Material costs overrun the estimated amounts by 59% Labour costs are 17% higher than estimated
Total costs are 45% higher than estimated
Due to change orders the contract value has gone up 20%
Even though the balance sheet shows a minor profit, the project has most likely made losses. The realized profit (or loss in this case) is estimated at L. - 453.032,28. This is 164% lower than the estimated profits.
Rework indicator Estimated amount
Actual amount % difference
Material L. 2.959.538,14 L. 4.712.609,47 +59%
Labour L. 2.011.810,49 L. 2.363.380,73 +17%
Time N.A. N.A. N.A.
Total costs L. 5.337.857,76 L. 7.718.478,54 +45%
Contract value L. 6.048.575,33 L. 7.265.446,26 +20%
Table 7 Financial analysis of proyecto Panaderia Jerusalen
4.3
Conclusions regarding possible rework
Even though the evaluation of the projects could not be carried out as planned and numbers are less reliable than anticipated, indications of rework have been identified. In all of the evaluated projects at least one of the indicators had experienced an overrun. These overruns are failure costs and as explained in the theoretical framework (Chapter 3) a part of these costs is caused by rework processes. Only total overrun percentages could be presented since rework has not been specifically evaluated during any of these projects or any of GW's projects at all. The following conclusions regarding rework could be drawn:
Average total cost overrun (average failure costs) was 13%. But at least two of the five projects had a total cost overrun, resulting in less profit and even losses. The cost overruns were far from neglectable, respectively 45% and 54% higher costs than estimated have been realized.
Four out of five projects had to process change orders. These change orders resulted in increased revised contract values of up to 140% the initial values. The costs involved with these changes are passed on to the customers. So GW does not take on the direct costs of this rework but the indirect consequences mentioned in paragraph 3.3 are still applicable. Therefore change orders should also be avoided even though the direct costs are for the client.
If the change orders are completely seen as rework, they make up for a major part of the cost overruns. This assumption is questionable because according to the definition presented in paragraph Fout! Verwijzingsbron niet gevonden. rework is the unnecessary effort of re-doing a process or activity that was incorrectly implemented the first time. And not every part of a change order fits that definition. But it can be seen as a consequence of re-doing a process that was incorrectly implemented the first time. If the design had been correct the first time, no change order would have been required but due to changing the design, many extra activities might be required. These are not rework themselves but are a consequence of rework.
For the two projects that had total cost overruns the change of the contract value (the change orders) has been compared to the total cost overrun. These calculations are based on several assumptions and are therefore not very reliable but they give an indication about what part of failure costs are due to rework. For La Cigrah the value of the change orders is 86% of the value of cost overruns. For La Panaderia this percentage is lower, 51%. These percentages only include change orders and there are more rework causes which will be described further on in this report and therefore actual rework percentages will be even higher. But these percentages do give an idea about which part of failure costs is due to rework. As already described above the change order costs are mostly passed on to the client but should be avoided nevertheless.
4.4
Conclusions regarding financial project evaluation & accounting
After analyzing five realized projects some conclusions can already be drawn regarding some general processes within GW. These conclusions do not relate to rework but to general financial project evaluation aspects.
Summarizing the conclusions that have been drawn, detailed explanations can be found below:
There is hardly any uniformity between the balance sheet drawn up by the deparment of presupuestos and the numbers from the accounting department (contabilidad). If there is uniformity it is almost impossible to trace due to different layouts, structures and codifications.
The accounting department (contabilidad) is not able to provide an overview of the total financial situation of a project. There should be an overview that gives an idea about the projects' financial situation at a glance.
The way projects are being evaluated, specifically the way the balance sheet is drawn up, is not standardized.
4.4.1 Uniformity balance sheets and accounting & end result overview
project managers. However it is not clear if the same goes for the accounting department, since the turnout received for the projects did not include subcontracts. Therefore it might very well be the case that the accounting department does have all costs registered, but because a complete overview of a project could not be provided it is very hard to compare some numbers.
The lack of ability to produce a complete and structured overview of a projects expenses is probably one of the reasons there are so many differences between the numbers used within the company. The accounting department should be the department with the overview of all the costs made within a project. If the department of presupuestos uses the same structure and codification as the accounting department and of course the numbers provided by the accounting department, the balance sheets become much more reliable. Because at this moment they are far from reliable. In one project, proyecto Aimar, it is very clear that to draw up the balance sheet the numbers from the accounting department were used. This makes comparing the numbers a lot easier and makes the balance sheet more reliable since costs can be traced.
Inadequate accountancy can be very dangerous. For example in the case of Panaderia Jerusalen it is very likely that the project made losses even though the balance sheet shows a minor profit. The company might endure losses without even knowing it. In less profitable times errors like these show up at the end of the year and if it happens on a larger scale it might even mean the bankruptcy of a company.
When this was presented the differences between the numbers could not be explained but it was confirmed that the differences in codifications have been a problem for several years now. Tracing numbers has always been difficult and it was agreed that it really is something that needs to be evaluated properly.
4.4.2 Standardization balance sheets (and tenders)
The way balance sheets have been drawn up by the department of presupuestos is not standardized. It is often not clear where the numbers have been derived from and different sources of the numbers presented seem to have been used. Also the balance sheets do not provide the same kind of numbers and furthermore is the layout not alike. To be able to evaluate projects properly a standardized way of drawing up the balance sheet should be adopted. It makes it easier to draw up the balance sheets, it is easier to trace costs and a summary of the projects results can be provided at a glance.
The set up for the balance sheet of for example proyecto Banco Lafise is actually quite good. It includes the initial contract value, all the change orders, the end contract value, the estimated costs and results, realized costs and results and the received payments. The problem within this balance sheet lies within the non-existing uniformity problem described above. As described above, the balance sheet of proyecto Aimar does contain uniformity. So combining the ways these balance sheets have been made, would already be an improvement.
5
Set-up quantitative analysis of finished projects
We now know approximately how many rework costs occur at projects of GW, so next it is important to find the causes of rework events. This will be done through quantitative analysis of the same project. In this chapter the model and interviews that were part of these analyses are presented.
5.1
Model/Checklist
As already explained in the research methodology section, the model or checklist can be considered the basis for this research. By thoroughly reviewing existing literature many possible causes for rework have been identified. In Chapter 3.5 is described that not all the possible causes have been examined. The causes have been classified and codified to keep it structured and clear. The first subdivision is the phase in which the rework occurs, namely design and construction. The other subdivision is the type of rework; error, change and a few that do not fit into these two categories, but are important to analyze. Some causes are difficult to classify. A change in the design initiated by the client for example, might also cause rework at the construction site if construction has already reached that certain stage of construction. To avoid causes appearing twice, they have only been included in the design section.
To make the checklist even more structured the causes have been grouped by similarity and responsibility. For example all construction errors caused by executing personnel has been grouped. For the rework causes related to the design stage this is less applicable since they always apply to (at least) the designer.
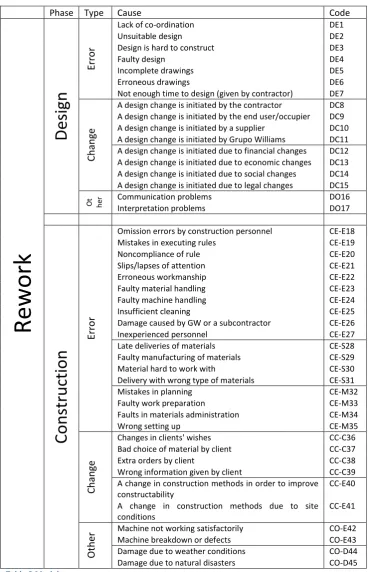
To make processing of the interviews easier and structured, the causes have been codified. The codification is explained in Table 8. The model itself can be seen on the next page (Table 9). In Appendix I the same model is presented, here the literature where the causes have been derived from has been added.
Code Explanation
DE Design error
DC Design change
DO Design others
CE-E Construction error by executor
CE-S Construction error by supplier
CE-M Construction error by management
CC-C Construction change by client
CC-E Construction change by executor
CO-E Construction others by executor
CO-D Construction others namely damage
Phase Type Cause Code
Rework
Design
Erro
r
Lack of co-ordination DE1
Unsuitable design DE2
Design is hard to construct DE3
Faulty design DE4
Incomplete drawings DE5
Erroneous drawings DE6
Not enough time to design (given by contractor) DE7
Ch
an
ge
A design change is initiated by the contractor DC8 A design change is initiated by the end user/occupier DC9 A design change is initiated by a supplier DC10 A design change is initiated by Grupo Williams DC11 A design change is initiated due to financial changes DC12 A design change is initiated due to economic changes DC13 A design change is initiated due to social changes DC14 A design change is initiated due to legal changes DC15
Ot he
r Communication problems DO16
Interpretation problems DO17
Cons
tr
uct
ion
Erro rOmission errors by construction personnel CE-E18
Mistakes in executing rules CE-E19
Noncompliance of rule CE-E20
Slips/lapses of attention CE-E21
Erroneous workmanship CE-E22
Faulty material handling CE-E23
Faulty machine handling CE-E24
Insufficient cleaning CE-E25
Damage caused by GW or a subcontractor CE-E26
Inexperienced personnel CE-E27
Late deliveries of materials CE-S28
Faulty manufacturing of materials CE-S29
Material hard to work with CE-S30
Delivery with wrong type of materials CE-S31
Mistakes in planning CE-M32
Faulty work preparation CE-M33
Faults in materials administration CE-M34
Wrong setting up CE-M35
Ch
an
ge
Changes in clients' wishes CC-C36
Bad choice of material by client CC-C37
Extra orders by client CC-C38
Wrong information given by client CC-C39
A change in construction methods in order to improve constructability
CC-E40
A change in construction methods due to site conditions
CC-E41
Ot
h
er Machine not working satisfactorily Machine breakdown or defects CO-E42 CO-E43
Damage due to weather conditions CO-D44
[image:30.595.65.436.65.638.2]Damage due to natural disasters CO-D45
5.2
Interview strategy
The data necessary to determine rework has occurred is not available for finished projects because rework events have never been reported. The information has been received from questioning employees involved in the projects. Interviews or questionnaires are the most suitable methods when gathering information like this. The personnel that was interviewed was involved in the management or design of the projects. The purpose of the interviews was determining what the causes of the rework, that occurred in specific projects, were. The interviews provide information about the most relevant (sub-) causes.
Every possible cause in the checklist has been questioned for its occurrence in the projects in the interview and the interviewee could rate a cause for its relevance by using a scale with possible answers ranging from strongly agree to strongly disagree. In Appendix VIII an example of the surveys that were conducted during this research to analyze the causes of rework in some realized projects of GW can be found. Only a part of the interview has been adopted in this report since the complete interviews are very large and since an overview of the assertions is presented in Appendix VII this is unnecessary.
Once the interview-questions had been determined, the interviews were conducted. For every project the goal was to question three people, two project managers and the head designer. The interviews were face-to-face to be able to explain any possible ambiguities and go more into detail when necessary. Unfortunately the head designer for the analyzed projects had holidays while the interviews were conducted. But even though she had holidays she offered to fill in the survey herself. So these interviews were not held in person but the responses still provided useful information. Afterwards data derived from the interviews has been analyzed and presented in a structured way to be able to draw conclusions at a glance. There has also been feedback to the model.
The purpose of the interviews was determining what the causes of the rework, that occurred in specific projects, were.
Most of the theoretical information presented below has been received from Fink (2006), Edwards et al. (1997) and Steehouder (2006).
5.2.1 Checklist as basis
The checklist or model presented in Table 9 was the basis for the interviews. Every single cause was tested for occurrence during a project by presenting a statement involving that cause. An overview of all the assertions presented during the interviews can be found in Appendix VII. The main advantage of the checklist is that it reminds people of possible causes that they might forget when they would have been presented open questions about the causes of rework that occurred during a project. 5.2.2 In-Person interviews
Self-administered questionnaires would have been useful when there had been a few simple questions that did not need further explanation or when further illustration or answering would not have provided any more possible useful information.
5.2.3 Standardized vs. non-standardized interviews
With standardized interviews, each interviewee is asked exactly the same questions. They are suitable for collecting factual information and are mostly applied when trying to reveal standard patterns.
Non-standardized interviews are less structured and questions vary per interview. They are suitable for detailed examination of certain topics, when dealing with sensitive or emotive aspects or when projects or businesses have very different characteristics.
For this research a semi-standardized interview was used. An aspect that can be seen as non-standardized was the possibility to go into detail for each question. But per project the same questions were asked to each person and a standard list of statements was used. Semi-standardized interviews give the interviewer the flexibility to adapt to the specific circumstances while ensuring comparable data is gathered.
5.2.4 Open vs. closed questions
Open questions give the interviewee the possibility to answer the questions in their own way. Closed questions on the other hand do not give this possibility. The interviewee has to chose from several given answers. This interview mostly consisted of closed questions since they produce results that are more easy to process. The reliability is also higher because all the answers are classified similarly, everyone has to choose from the same options. Because the interviewee might have useful additional information it was possible to go into a specific aspect more thoroughly. By doing this the disadvantages of closed questions have been gotten around.
5.2.5 Use of scaling
Besides finding what causes were relevant for the studied projects, it was also important to find the gravity of the causes. Therefore solely using a checklist was not sufficient. Using an answering scale the interviewee is given the possibility to express the gravity of that specific rework origin within the project. There are many different possible scales. Some things to consider when choosing the scale:
Make sure the scale is always the same
Make sure the scale always has the same meaning Make sure there are as many positive as negative ratings Make sure answer possibilities are not too close to each other
In this survey the answering options were; strongly agree, agree, undecided, disagree, strongly disagree and do not know. This is one of the most frequently used Likert scales.
5.2.6 Things to avoid
To gather reliable information and to make sure the interview goes smoothly there are several things that had to be avoided in the questions, namely:
Jargon
Questions that can be interpreted in several ways Negative questions
Abbreviations Abstract questions
Biased questions or words Multiple questions in one phrase 5.2.7 Risks regarding interviews
There are several things that had to be taken into account before drawing up and conducting the interviews, namely:
People might be unwilling to answer particular questions (for example when they are responsible for errors)
People might be unable to answer particular questions (for example because of their function within the company)
People might have forgotten certain aspects since projects have been completed in the past Be careful when asking for personal information
6
Outcomes of quantitative analysis
Per project a short summary of the outcomes of the interviews will be given and the most severe problems that were found will be described. An overview of the confirmed indicators for rework per project can be found in Appendix X. After discussing the findings per project, a summary of all the projects together will be given and there will be feedback to the model as presented in Table 9.
6.1
Proyecto Banco Lafise
The financial analysis of this project showed that the cost overrun of materials and the revised contract value were most likely the most important indications for rework. This was also confirmed by the surveys. In total 23 out of 45 rework indications were confirmed. Many of the indicators regarding the design phase were confirmed, very important here is that the design for Banco Lafise was not made by GW but by a company in Nicaragua as has already been explained before.
There were many problems regarding the design, the most important ones are: Faulty and incomplete design
Incomplete and incorrect drawings
Communication and coordination were not good
Many design changes were made, mostly by the client but also by the contractor, GW and because of financial and economic changes
The most important problems during construction were: The design changes had to be processed
Construction personnel made errors, mistakes etc. which caused damage A subcontractor caused a lot of problems and had to be fired
A change in cons