One of the major tasks of the visual system of a honeybee in a foraging flight is flower detection. Flowers may enhance saliency against their background through colour and intensity. Here, we ask how detection of coloured targets by honeybees is influenced by the strength of their achromatic cues.
The colour vision of the honeybee Apis mellifera L. has been investigated in detail (for reviews, see Menzel and Backhaus, 1991; Vorobyev and Brandt, 1997). The eye of the honeybee contains three types of photoreceptor with sensitivities that peak in the ultraviolet, blue and green parts of the spectrum. An alternative nomenclature for these receptors is S (short wavelength) for ultraviolet receptors, M (medium wavelength) for blue receptors and L (long wavelength) for green receptors; Fig. 1). Generally, the receptor signals can combine in different ways, feeding into either chromatic or achromatic visual pathways. Chromatic vision is, by definition, not sensitive to changes in the intensity of the light stimulus, but it is sensitive to changes in the spectral composition of the stimulus. By comparison, achromatic vision is sensitive to stimulus intensity, but not to changes in the spectral composition. Chromatic vision is achieved by colour-opponent (subtractive) interactions between receptor signals, while achromatic vision is based either on the summation of receptor responses or on the signal of a single receptor type. Behavioural studies have demonstrated that achromatic vision in honeybees is mediated by a single receptor type. Thus, the S-receptors of the dorsal rim area are involved in navigational tasks (Wehner and Rossel, 1985), while movement-related
visual tasks are mediated by the signals of the L-receptor (green receptor) (Kaiser and Liske, 1974; Lehrer et al., 1988; Lehrer, 1993). In several behavioural experiments, it has been shown that bees do not use achromatic cues for colour discrimination (for a review, see Vorobyev and Brandt, 1997), but bees are able to learn black/white patterns, i.e. stimuli that do not present a chromatic contrast (Wehner, 1981; Srinivasan, 1994; Giurfa et al., 1996a, 1999). This apparent contradiction has recently been clarified by behavioural experiments showing that the chromatic and L-receptor (green receptor)-mediated achromatic pathways are tuned to targets of different angular sizes. The chromatic visual pathway is used for the detection and discrimination of coloured targets larger than 15 ° in angular size, while the achromatic visual pathway driven by the L-receptor is sensitive to targets subtending a visual angle ranging from 15 to 5 ° (Giurfa et al., 1996b, 1997; Giurfa and Vorobyev, 1998).
Several models have been proposed for describing the trichromatic colour vision of honeybees (Table 1). Such models have been applied to pollination ecology and to questions related to the evolution of flower colours and pollinator vision (e.g. Kevan, 1978; Chittka and Menzel, 1992; Menzel and Shmida, 1993; Lunau, 1995; Kevan et al., 1996; Vorobyev and Brandt, 1997; Waser and Chittka, 1998; Vorobyev and Menzel, 1999). All the models postulate that achromatic vision is not used for stimulus detection and assume that the signals from the three receptor types combine, forming two independent colour-opponent mechanisms, which Printed in Great Britain © The Company of Biologists Limited 2000
JEB2949
Honeybees, Apis mellifera, were trained to detect coloured disks with either a strong or a weak intensity difference against the background. Green, blue, ultraviolet-reflecting white and grey papers were reciprocally combined as targets or backgrounds, providing strong chromatic and/or achromatic cues. The behavioural performance of the honeybees was always symmetrical for both reciprocal target/background combinations of a colour pair, thus showing that target
detection is independent of whether the colour is presented as a background or as a target in combination with the other colour. Bright targets against dim backgrounds and vice versa were detected more reliably than dim target/background combinations. This result favours the general assumption that the detectability of a coloured stimulus increases with increasing intensity.
Key words: honeybee, Apis mellifera, colour vision, behaviour.
Summary
Introduction
DETECTION OF BRIGHT AND DIM COLOURS BY HONEYBEES
NATALIE HEMPEL DE IBARRA1,*, MISHA VOROBYEV1,2, ROBERT BRANDT1 ANDMARTIN GIURFA1,3
1Institut für Biologie – Neurobiologie, Freie Universität Berlin, Königin-Luise-Straße 28/30, D-14195 Berlin,
Germany, 2Department of Biological Sciences, University of Maryland, Baltimore County, 1000 Hilltop Circle,
Baltimore, MD 21250, USA and 3Departamento de Ciencias Biológicas, Universidad de Buenos Aires,
Ciudad Universitaria, CP 1428, Buenos Aires, Argentina *e-mail: nhempel@neurobiologie.fu-berlin.de
code the chromatic aspects of colour. These mechanisms define a two-dimensional colour-opponent space (Backhaus, 1991; Brandt and Vorobyev, 1997). The detectability of a coloured object against a particular background is predicted by the distance, ∆S, between the chromatic loci of these two stimuli in the colour space of the animal; the larger the distance, the better the detectability. The distance and, accordingly, the detectability increase with increasing signal-to-noise ratio of chromatic mechanisms, which is generally a function of the intensity of the light stimulus. The different assumptions of the models about the dependency of the
signal-to-noise ratio on stimulus intensity lead to different predictions for the detectability of the same colours.
We tested the detectability of coloured targets that differ substantially from the background in the shape of the reflectance spectra and/or in average reflectance. We used white and grey papers, which reflected uniformly in the ultraviolet, and dim blue and dim green papers (Fig. 2). The reflectance of the green paper was similar to that of the foliage spectrum (Menzel and Shmida, 1993) in the visible range of the honeybee. The intensity of the stimuli was adjusted so that the models of honeybee colour vision give clearly different predictions for the different colour combinations. Earlier experimental results with bees showed that dark stimuli against a bright background were learned more readily than bright stimuli against a dim background (von Weizsäcker, 1970; Wehner, 1981). Thus, we analysed the performance for reciprocal combinations of target and background colours to determine whether the detectability of a coloured target a presented on background b is equal to that of a coloured target b presented on background a.
Models
Different assumptions about the nature of the processes that allow colour detection and discrimination, as well as different experimental results, form the basis of the models of honeybee colour vision (Table 1; for details, see Appendix). Two of them, the colour-opponent coding model (COC) (Backhaus, 1991) and the general colour-opponent coding model (GCO) (Brandt and Vorobyev, 1997), use data obtained in behavioural
300 400 500 600 700
0 0.2 0.4 0.6 0.8 1.0
(green) (blue)
(UV)
L M
S
Wavelength (nm)
Sensiti
[image:2.612.46.290.75.229.2]vity
Fig. 1. The spectral sensitivities of the three photoreceptor types of the honeybee (after Menzel and Backhaus, 1991). The sensitivity peaks are at 344 nm (S or ultraviolet receptor), at 436 nm (M or blue receptor) and at 556 nm (L or green receptor).
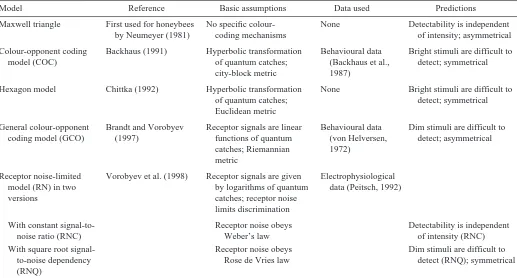
Table 1. Models of honeybee colour vision
Model Reference Basic assumptions Data used Predictions
Maxwell triangle First used for honeybees No specific colour- None Detectability is independent by Neumeyer (1981) coding mechanisms of intensity; asymmetrical
Colour-opponent coding Backhaus (1991) Hyperbolic transformation Behavioural data Bright stimuli are difficult to model (COC) of quantum catches; (Backhaus et al., detect; symmetrical
city-block metric 1987)
Hexagon model Chittka (1992) Hyperbolic transformation None Bright stimuli are difficult to of quantum catches; detect; symmetrical Euclidean metric
General colour-opponent Brandt and Vorobyev Receptor signals are linear Behavioural data Dim stimuli are difficult to coding model (GCO) (1997) functions of quantum (von Helversen, detect; asymmetrical
catches; Riemannian 1972) metric
Receptor noise-limited Vorobyev et al. (1998) Receptor signals are given Electrophysiological model (RN) in two by logarithms of quantum data (Peitsch, 1992)
versions catches; receptor noise
limits discrimination
With constant signal-to- Receptor noise obeys Detectability is independent
noise ratio (RNC) Weber’s law of intensity (RNC)
With square root signal- Receptor noise obeys Dim stimuli are difficult to
to-noise dependency Rose de Vries law detect (RNQ); symmetrical
[image:2.612.44.561.462.740.2]experiments, whereas another, the receptor noise-limited model (RN) (Vorobyev and Osorio, 1998; Vorobyev et al., 1998), is based on electrophysiological data. The RN model has two versions, assuming either that noise is constant (RNC) or that noise is defined by fluctuations of the number of quanta absorbed (RNQ). Two models use general considerations about the nature of colour processing instead of experimental data, as in the case of the Maxwell triangle (see Wyszecki and Stiles, 1982, pp. 120–121; for application to honeybee vision, see Neumeyer, 1981) and the hexagon model (Chittka, 1992). Models can be classified according to the postulated dependence of the signal-to-noise ratio on the light intensity, which may remain invariant, decrease or increase. The Maxwell triangle and the RNC models postulate that signal-to-noise ratio, and thus detectability, is independent of light intensity. By comparison, the GCO and the RNQ models postulate that the signal-to-noise ratio increases with increasing light intensity, thus making bright stimuli easy to detect. Finally, the COC and hexagon models assume that receptor signals saturate when the target intensity exceeds that of the background (signal-to-noise ratio decreases with increasing light intensity), thus making bright stimuli difficult to detect. According to these two models, the optimum detectability occurs when the average stimulus reflectance is similar to that of the background (Fig. 3).
The models assume that receptors are adapted to the background, whose locus is postulated to be in the centre of the colour space. In reality, both stimulus and background may affect the adaptation of receptors (Neumeyer, 1980; Dittrich, 1995); moreover, it is not clear whether receptors adapt fully to backgrounds. It is important to choose correctly an achromatic point in a colour space if we are to describe colour induction and colour constancy. However, the predictions of detectability are generally not sensitive to the choice of the
[image:3.612.55.295.71.260.2]achromatic point. Linear models (such as the GCO model) predict that a bright target presented on a dim adapting background is detected significantly better than a dim target on a bright background, i.e. these models give asymmetric predictions. The Maxwell triangle also gives asymmetric predictions, but asymmetry is weak compared with the predictions of the linear models. The models that adopt Weber’s law (which is incorporated by logarithmic transformation of receptor signals) assume that only relative changes in receptor signals are coded. Thus, it is not important where the achromatic point is located, and the predictions of RN models are, consequently, symmetrical, i.e. the detectability of a stimulus a against a background b is equal to that of a stimulus b against a background a. The COC and Fig. 2. The spectral reflectance of the coloured papers used as stimuli
and backgrounds: green, blue, ultraviolet-reflecting white and ultraviolet-reflecting grey. The foliage spectrum represents an average of different leaf spectra (Menzel and Shmida, 1993).
300 400 500 600 700 0
0.2 0.8 1.0
Blue Foliage
Wavelength (nm) White
Green
Reflectance
Grey
0.01 0.1 1
0.3 0.4 0.5 0.6 0.7 0.8 0.9 1 2 3 4 5 6 7 8 9 10
Hexagon GCO
White Grey
COC Maxwell triangle
and RNC
RNQ
∆
S
[image:3.612.335.558.73.387.2]Reflectance
Fig. 3. Predictions of the models of honeybee colour vision for the detectability of different ultraviolet-reflecting grey stimuli on a green, foliage-like background. The reflectance of hypothetically ideal grey papers varies from 0.01 (close to black) to 1 (ideal white). The reflectances of the stimuli used are labelled as ‘Grey’ and ‘White’ (see arrows). The detectability of colour against a background is predicted by its distance from the background in colour space, ∆S. The larger the separation, the better the detectability. For comparison, the values of ∆S calculated by
hexagon models do not explicitly state that they adopt Weber’s law, but they implement the mathematical rule for a hyperbolic transformation of receptor quantum catches into receptor signals. This also leads to symmetrical predictions.
Materials and methods
Individually marked, free-flying honeybees, Apis mellifera L., were trained to enter a wooden Y-maze (Giurfa et al., 1996b, 1997) to collect 50 % sucrose solution (Fig. 4). The maze, covered with ultraviolet-transparent Plexiglas, was placed either close to a large open window in the laboratory or outdoors in the shade. In both cases, it was illuminated by natural daylight. Only one bee was present in the apparatus at a time. The bee had to enter the decision chamber of the maze through an orifice (5 cm in diameter) in the middle of an interposed wall. The insect could see both back walls of the maze simultaneously only when it was inside this decision chamber. The centre of the decision chamber was taken as the decision point. One arm presented vertically on its back wall a circular coloured target (8 cm in diameter) placed flat on a background covering the back wall (20 cm×20 cm). Bees were rewarded with sucrose solution each time they chose the target. Stimuli were presented at either 15 or 20 cm (distance D in Fig. 4) from the decision point, and thus subtended 30 ° or 23 °, for different groups of bees. The alternative arm displayed only the background on its back wall and offered no reward. The training disk was presented in a pseudo-random succession, in the right or the left arm to ensure that bees did not associate the reward with a particular arm.
The bees learned to enter the Y-maze step by step during 5–6 visits where reward was offered on an achromatic plate. Then, in a pre-training session of four visits, each bee was rewarded individually at the stimulus presented twice in each of the arms. The bee then had to complete 30 consecutive visits to the Y-maze, and its choices were recorded. Each bee was presented with one particular target/background combination. We recorded only the first choice (entering one of the arms) on each visit, because every further choice might have been influenced by the outcome of the previous one. The choice of the arm with the training disk was recorded as correct, and the bee was rewarded ad libitum. The choice of the alternative arm with the background alone was recorded as incorrect and the bee had to leave the maze and enter it again and choose the correct arm before it was rewarded. These further choices were not taken into consideration.
Two experiments were conducted. In the first experiment, conducted in 1997, bees were tested with white (wh), grey (gy) and green (gr) coloured papers. The following combinations of target and background colours were presented to different groups of bees: gr/wh (i.e. green target against white background), wh/gr, gr/gy, gy/gr, wh/gy and gy/wh. Stimuli were presented 15 or 20 cm from the decision point. In the second experiment, conducted in 1999, we tested white, grey and blue (bl) coloured papers in the following combinations: wh/bl, bl/wh, bl/gy and gy/bl. The back walls were positioned 15 cm from the decision point.
Blue was provided by HKS-41N cardboard and green by HKS-58N cardboard (K+E Stuttgart, Stuttgart-Feuerbach, Germany). Ultraviolet-reflecting white was produced by mixing transparent acrylic varnish with BaSO4; ultraviolet-reflecting grey was obtained by adding carbon powder to the white. The reflectance spectra of the coloured papers were measured by means of a spectrophotometer (SR01, Gröbel UV-Elektronik) (Fig. 2). The white and grey papers had uniform reflectances within the visual range of the honeybee, and intensities were chosen such that they rendered quite different model predictions: the intensity of the grey paper was close to the detection optimum predicted by the COC and hexagon models, and the intensity of the white paper was close to the maximum possible reflection (Fig. 3).
Receptor quantum catches Qiwere calculated according to:
where i is S, M or L, λ denotes the wavelength, I(λ) is the illumination spectrum (standard function D65; see Wyszecki and Stiles, 1982), Si(λ) is the spectral sensitivity function of receptor i (Menzel and Backhaus, 1991) and R(λ) is the reflectance spectrum of the coloured paper considered. For each target/background combination, receptor-specific contrasts (qi) were calculated as:
qi = Qti/Qb
i, (2)
where Qt
i and Qbi denote the quantum catches of receptor i corresponding to target and background colours, respectively. Receptor-specific contrasts were further used to calculate chromatic contrasts between target and background (Table 2; see Appendix).
(1) ⌠
⌡
700
300
I(λ)Si(λ)R(λ)dλ,
Qi=
Decision point Decision chamber
Entrance to the decision chamber
Background
Stimulus Decision line
[image:4.612.316.559.71.240.2]D
The choices made by a honeybee were summed after testing for homogeneity (χ2-test), and choice frequencies were calculated as the percentage of correct choices. A Fisher exact test (Zar, 1999) was used to analyse whether the performance of the bee differed for the different target/background combinations used.
Results
[image:5.612.332.551.75.399.2]Individually trained bees had to detect a target on a differently coloured background while completing 30 visits. The coloured papers constituting the reciprocal target/ background combinations tested with different groups of bees were white and grey, which reflected uniformly in the ultraviolet, dim green and dim blue. Bees were trained with the stimuli located at either 15 cm or 20 cm from the decision point. The results did not differ between the two groups (χ2 -test), regardless of the colour combinations, and were therefore pooled. The results shown in Fig. 5A are for target/background pairs of white, grey and green papers (together with the results obtained in our previous study; Vorobyev et al., 1999), and in Fig. 5B for target/background pairs of white, grey and blue papers. Since the data sets presented in Fig. 5A,B were gathered in different years, we did not compare absolute values between the experiments to avoid any possible influence of seasonal effects.
For each colour pair tested, the reciprocal combinations resulted in similar proportions of correct choices. There were no asymmetries related to particular colours being used as targets or backgrounds (Fisher exact test, all not significant); for example, the white/green combinations with the white disk on the green background and the green disk on the white background were detected equally well.
[image:5.612.49.567.524.699.2]The results obtained with the two white/green combinations did not differ significantly from those obtained with the two
Table 2. Receptor quantum catches, receptor-specific and chromatic contrasts of the colour combinations used Receptor-specific contrasts, qi Chromatic distance, ∆S, between target and background (0,0)
(receptor quantum catches according to different models of honeybee colour vision relative to background)
Maxwell
Colour on background S M L triangle COC Hexagon GCO RNC RNQ
White on green (wh/gr) 11.63 10.47 7.05 0.12 0.7 0.04 27 3.6 1.7
Green on white (gr/wh) 0.09 0.08 0.14 0.13 0.7 0.04 0.4 3.6 1.7
Grey on green (gy/gr) 1.34 1.06 0.65 0.16 2.4 0.16 3 4.9 1.6
Green on grey (gr/gy) 0.75 0.95 1.55 0.18 2.4 0.16 5 4.9 1.6
White on grey (wh/gy) 8.68 9.91 10.92 0.05 0.2 0.02 10 1.5 0.6
Grey on white (gy/wh) 0.12 0.10 0.09 0.05 0.2 0.02 0.1 1.5 0.6
White on blue (wh/bl) 24.4 7.96 12.07 0.27 1.5 0.06 124 9.0 2.8
Blue on white (bl/wh) 0.04 0.13 0.08 0.24 1.5 0.06 0.7 9.0 2.8
Grey on blue (gy/bl) 2.82 0.8 1.11 0.32 5.4 0.26 14 9.8 2.5
Blue on grey (bl/gy) 0.36 1.24 0.9 0.25 5.4 0.26 7 9.8 2.5
S, S-(ultraviolet) receptor; M, M-(blue) receptor; L, L-(green) receptor; COC, opponent coding model; GCO, general colour-opponent coding model; RNC, receptor noise-limited model with constant signal-to-noise ratio; RNQ, receptor noise-limited model with square root signal-to-noise dependency.
50 60 70 80 90 100
d d
N=6 n=180 N=9 n=270 N=4
n=120 N=7 n=210
% Correct choices
50 60 70 80 90 100
c c
b b
a a a
a
% Correct choices
N=3 n=90
N=8 n=240
N=6 n=180
N=8
n=240 N=8 n=240 N=3 n=90
A
B
white/grey combinations (Fisher exact test, all not significant; Fig. 5A). Significant differences were only introduced by the grey/green combinations, which gave significantly different result from those of the two white/green and the two white/grey combinations (Fisher exact test, all P<0.05; Fig. 5A). Similarly, a significantly worse performance was observed in the results obtained for the grey/blue compared with the white/blue combinations (Fisher exact test, all P<0.01; Fig. 5B).
Discussion
The present results show that bright and dim colours were detected differently by free-flying honeybees. The white/green and white/blue target/background combinations were detected better than the grey/green and grey/blue ones. Bees detected the achromatic white/grey target/background combinations as reliably as the white/green ones. Summing up, the detection of the dim target/background combinations was impaired compared with that of combinations with a substantial difference in their mean reflectance. The performance for reciprocal target/background combinations was equal in each of the five colour pairs, indicating that target detection is independent of which colour is presented as the background or as the target.
Model predictions
The various models of honeybee colour vision have previously been tested for their ability to predict the behavioural spectral sensitivity of the honeybee (Brandt and Vorobyev, 1997; Vorobyev and Brandt, 1997). The predictions of the models that are not based on experimental data (Maxwell triangle, hexagon model; Table 1) differed significantly from the experimental results obtained by von Helversen (1972),
while the models based on experimental data closely predicted the spectral sensitivity, although the parameters of these models were obtained from different experiments, either behavioural (COC model) or physiological (RN models). The predictions of the model whose parameters were adjusted to fit the spectral sensitivity (GCO model) perfectly matched the latter. However, the present study shows that all the models fail to predict some experimental results, and they gave only partially correct predictions concerning the detectability of our stimuli (Table 3).
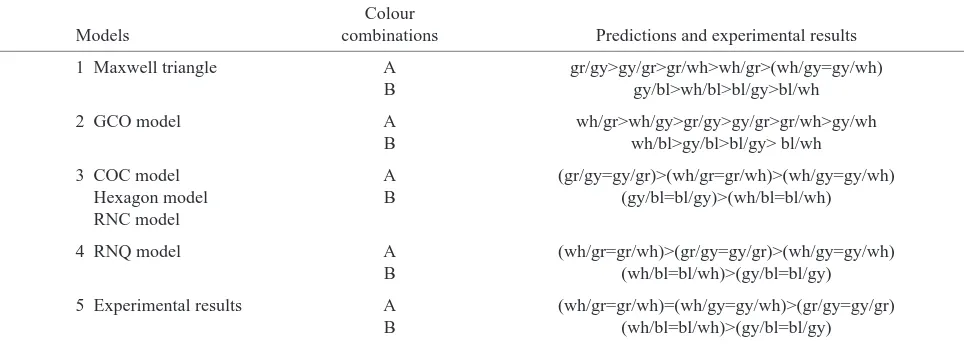
[image:6.612.53.535.99.272.2]The symmetry in the choice proportions found within each reciprocal target/background pair tested was predicted by the models, except by the Maxwell triangle and the GCO model. The asymmetry in the predictions of the GCO model for the dim target/background combinations, e.g. grey/green and grey/blue, however, is weak, as also is the case in the predictions of the Maxwell triangle model. The GCO model, as a linear model, was designed to describe the detectability of stimuli that differ only slightly from the achromatic background, and it performs well in such conditions (Brandt and Vorobyev, 1997). However, the stimuli used here differ substantially from each other in intensity, and the stronger the difference was, the stronger was the asymmetry in predictions. This means that, for such stimuli, the assumptions of linear models are not valid. It has been proposed that logarithmic transformation of receptor signals can be used to describe discrimination of stimuli that differ substantially from their background (RN models; Vorobyev et al., 1998). Logarithmic transformation is a mathematical formulation of the assumption that relative, rather than absolute, changes in receptor quantum catches are coded (Weber’s law). The latter assumption is in agreement with a considerable amount of psychophysical data. One of the consequences of such an Table 3. A comparison of the ranking from different models and our experimental results for different target background colour
combinations
Colour
Models combinations Predictions and experimental results
1 Maxwell triangle A gr/gy>gy/gr>gr/wh>wh/gr>(wh/gy=gy/wh) B gy/bl>wh/bl>bl/gy>bl/wh
2 GCO model A wh/gr>wh/gy>gr/gy>gy/gr>gr/wh>gy/wh B wh/bl>gy/bl>bl/gy> bl/wh
3 COC model A (gr/gy=gy/gr)>(wh/gr=gr/wh)>(wh/gy=gy/wh)
Hexagon model B (gy/bl=bl/gy)>(wh/bl=bl/wh)
RNC model
4 RNQ model A (wh/gr=gr/wh)>(gr/gy=gy/gr)>(wh/gy=gy/wh) B (wh/bl=bl/wh)>(gy/bl=bl/gy)
5 Experimental results A (wh/gr=gr/wh)=(wh/gy=gy/wh)>(gr/gy=gy/gr) B (wh/bl=bl/wh)>(gy/bl=bl/gy)
1, 2, asymmetrical predicting models; 3, 4, symmetrical predicting models; 5, experimental results. wh, white; gy, grey; gr, green; bl, blue.
assumption is that the detectability of reciprocal colour pairs is predicted to be symmetrical. The models using hyperbolic transformation of receptor quantum catches (COC, hexagon) also predict that the detectability of reciprocal colours is symmetrical. It is important to note that the hyperbolic and logarithmic transformations differ from each other only for stimuli that differ substantially from the background in their intensity.
The predictions of the two models that assume that the signal-to-noise ratio decreases with increasing stimulus intensity (COC and hexagon models) and that bright stimuli are therefore difficult to detect because receptor signals saturate are at odds with the experimental data. Although the chromatic contrast between the grey, green and blue papers, as calculated by the two models, that are based on behavioural data (COC and GCO models), would be sufficient for reliable detectability, the performance of the honeybees was very poor: the dim grey/green and grey/blue combinations were detected least easily. This result corresponds to the assumption that the signal-to-noise ratio improves with increasing light intensity. Thus, the RNQ model correctly predicts that dim stimuli against dim backgrounds are more difficult to detect than bright combinations. However, all the models tested consequently predicted that white/grey combinations that offer intensity contrast, rather than colour contrast, would be poorly detected since they assume only the participation of chromatic mechanisms in colour coding.
Detection of achromatic target/background combinations Honeybees reliably detected the achromatic white/grey combinations, although they were presented in a range of visual angles (α>15 °) within which only chromatic cues were found to be used by bees (Giurfa et al., 1996b, 1997). An implication of this result is that, even for such large visual angles, achromatic mechanisms are involved in target detection. It has been shown that a stimulus devoid of chromatic contrast could not be detected by bees if it subtended a visual angle greater than 15 ° (Giurfa and Vorobyev, 1998). The contradiction between these results and our own could be explained by the differences in the amount of the achromatic signal that the stimuli used in the studies presented to the L-receptor. Whilst Giurfa and Vorobyev (1998) used a stimulus with an L-receptor (green) contrast of 2.4, the white/grey combination used in the present study presented an achromatic contrast of 11 (white on grey) and 0.09 (grey on white, a ‘negative’ contrast since the target is 11 times darker than the background for the L-receptor) (Table 2), i.e. stimuli contrasted much more strongly against the background.
Our finding that honeybees can detect an achromatic target subtending a large visual angle, provided that the achromatic contrast is strong, can be explained by a model proposed by Giurfa and Vorobyev (1998). This model describes the angular range of achromatic, L-receptor-mediated target detection. It assumes that achromatic vision is mediated by neurons (detectors) with centre-surround receptive fields and that the response of such detectors changes linearly with the signal
input, i.e. the stronger the stimulus contrast, the better the detectability. Such neurons are not sensitive to uniform stimuli, but they are sensitive to borders. The proportion of border in uniform stimuli subtending a large visual angle is low, so centre-surround neurons are not effective with such stimuli. However, a high-contrast signal would elicit a neuronal response. Support for the assumed low-contrast sensitivity of such a detector is provided by the metric analysis of the spectral sensitivity function of the bee. Brandt and Vorobyev (1997) analysed the data obtained by von Helversen (1972) and showed that the sensitivity of a hypothetical achromatic channel is very low compared with that of chromatic mechanisms. Lehrer and Bischof (1995) observed that the detection performance for grey stimuli of different intensities against a white background improved with increasing intensity contrast, a result that is in line with predictions of the linear detector model.
Our results indicate that both chromatic and achromatic aspects of coloured targets can be available to the visual system of honeybees at the same time. However, while the results of colour detection and discrimination experiments allow us to judge whether colours are perceived as similar or not, such experiments do not provide information about how colours are perceived. We cannot, therefore, learn from our results whether the detection of the white/green and white/blue combinations was driven by the chromatic or achromatic cue alone or by a combined signal relying on both cues.
The value of ultraviolet-reflecting white signals An advantage of the white and grey papers we used is that such stimuli give a reliable signal for S-receptors. Ultraviolet-reflecting papers are not available commercially so, in previous behavioural studies of bee vision, stimuli with a strong ultraviolet reflection were not often used. Ultraviolet-reflecting white or grey objects are rarely observed in nature and, therefore, may appear unusual to bees. However, Daumer (1956, p. 449) used ultraviolet-reflecting targets and showed that bees can be easily trained to recognise them. Our results confirm that bees can learn ultraviolet-reflecting white stimuli, which favours the finding that bees are able to learn all colours (Menzel, 1967). Since the reflectance spectrum of the green paper that we used is similar to that of foliage, our results can be directly used to verify the validity of some ecological and evolutionary speculations (Vorobyev et al., 1999).
easily distinguishable by bees. However, this does not mean that this colour is in any way ‘attractive’ for bees, although the field studies of Craig and Bernard (1990) show that pollinators, mainly stingless bees, are attracted by ultraviolet-reflecting white spider webs and learn to avoid them if the decoration design of the web remains invariant (Craig, 1994). It is well known that the learning rates differ for various colours in experienced bees (Menzel, 1967) and that naive bees have colour preferences (Giurfa et al., 1995). In flowers, the tissues are mostly ultraviolet-absorbing, and there are no pigments that reflect substantially in the ultraviolet. Ultraviolet reflection by white flowers is produced by special structures located in the epidermis, such as air-filled intracellular structures or starch grains (Kugler, 1963). Thus, the scarcity and evolution of ultraviolet-reflecting white flowers may be explained by biochemical and morphological constraints on flowers and in terms of cost–benefit effects rather than by selective pressures imposed by limited visual capacities of pollinators.
Appendix
All models of colour vision as described here use the basic ideas of a metric theory of human colour discrimination (von Helmholtz, 1896; Schrödinger, 1920; Wyszecki and Stiles, 1982). According to this theory, colour can be represented as a point in a colour space, and the separation of any two points in that space is assigned a distance (∆S). If the distance becomes smaller than a given threshold, then the colours are indistinguishable. Generally, the larger the distance between colour points, the better the colours are discriminated, and colours whose points are close to those of the background are difficult to detect. All models assume that colour is coded by two chromatic mechanisms, and they use two-dimensional chromatic diagrams to represent colours. The background is assumed to be achromatic, and its colour locus is situated in the centre of chromatic diagrams.
Maxwell triangle
A classical two-dimensional representation, the Maxwell triangle (Wyszecki and Stiles, 1982), is obtained in the unit plane qS+qM+qL=1 of the receptor space, where q is the receptor-specific contrast. A line connecting the origin with the point q or its extension intersects the unit plane at a point qt.
The location of that point relative to the background locus determines the ‘chromaticity’ of the colour, and the distance between the points in the triangle can be related to their discriminability (Neumeyer, 1981). The axes in the triangle plane correspond to chromatic colour-opponent mechanisms, and the colour triangle can be interpreted as a colour-opponent plane (Brandt and Vorobyev, 1997).
The coordinates of the colour locus, x and y, are given by:
and
The chromatic distance (∆S) between the locus of the colour (xt,yt) and the locus of the background (xb,yb) is calculated using the Euclidean expression:
where ∆x=xt−xband ∆y=yt−yb.
Color-opponent coding model (COC) (Backhaus, 1991) The two scales resulting from multidimensional scaling of colour similarity experiments (Backhaus et al., 1987) were interpreted as colour-opponent mechanisms that combine in a ‘city-block’ manner. The model assumes that the output of receptors, receptor ‘excitations’, Ei, are related to receptor-specific contrasts by a hyperbolic transformation:
Ei = qi/(1 + qi) . (A4) Thus, Ei may vary from zero to unity. This transformation implies that the sensitivity decreases with increasing intensity. Coding is performed by two colour-opponent mechanisms termed A and B, whose output is calculated as:
A = ∑aiEi (A5)
and
B = ∑biEi, (A6)
for S-, M- and L-receptors, with ai={−9.86, 7.70, 2.16} and bi={−5.17, 20.25, −15.08}. The two chromatic mechanisms span a chromatic or colour-opponent plane, the so-called ‘COC diagram’. City-block metric is used to calculate the distance between two stimuli or stimuli and background (∆S):
∆S = |∆A| + |∆B| . (A7) Hexagon model (Chittka, 1992)
Receptor signals are given by receptor ‘excitations’ (E) as in the COC model (equation A4). Coding is performed by two colour-opponent mechanisms:
and
y = EM−0.5(EL + ES) . (A9) To calculate the distance between stimuli, common Euclidean metric is used:
The chromaticity diagram of this model has the shape of an equilateral hexagon, which gave its name to the model.
General colour-opponent model (GCO) (Brandt and Vorobyev, 1997)
This is a linear model that assumes that receptor signals are (A10) ∆S =
冪
(∆x)2+ (∆y)2.(A8)
x =
冪
3/2(EL−ES)(A3) ∆S =
冪
(∆x)2+ (∆y)2,(A2) y = qS−qM+ qL
qS+ qM+ qL
2/3 /2
冪
冢
冣
(A1) x = qM−qL
qS+ qM+ qL
proportional to the receptor-specific contrasts. Coding is performed by unspecified colour-opponent mechanisms, whose axes are parallel to the Maxwell triangle plane. To describe the location of a colour, orthogonal axes, X1and X2, are used:
and
Colour distance is given here by a general quadratic form (Riemannian metric):
where the G-values are the components of the metric tensor and C is a constant. The threshold spectral sensitivity (von Helversen, 1972) has been used to find the relative values of the metric tensor (Brandt and Vorobyev, 1997). This method gave the following values: G11=122, G12=−43.8 and G22=45.1. The value of the constant C, which relates one model unit to one COC model unit, is 1.23.
Receptor noise-limited models (RNC, RNQ) (Vorobyev et al., 1998)
These models are based on three assumptions: (i) for a visual system with n receptor channels, colour is coded by n−1 unspecified opponent mechanisms (the achromatic signal is disregarded); (ii) opponent mechanisms give zero signal for stimuli that differ from the background only in intensity; and (iii) thresholds are set by receptor noise and not by opponent mechanisms.
Let fibe the signal of receptor mechanisms i (i=S, M or L) and ∆fi be the difference in receptor signal between two stimuli. Vorobyev and Osorio (1998) considered stimuli that are close to an achromatic background and have shown that, if assumptions i–iii are correct, then the colour distance is given by the following equation:
where ωi denotes the standard deviation of the noise in the receptor mechanism i. From the assumption that Weber’s law is valid, it follows that: fi=ln(qi) (Vorobyev et al., 1998).
Here, we consider two versions of the receptor noise-limited model. (i) Receptor noise is proportional to the signal, i.e. the relative value of the noise is constant (constant noise-to-signal ratio) (RNC). The ωi-values were obtained from electrophysiological recordings in single photoreceptor cells (Peitsch, 1992). According to this estimate, ωS=0.13, ωM=0.06 and ωL=0.12. (ii) Receptor noise is proportional to the square
root of the signal (Rose de Vries law; de Vries, 1943), i.e. the relative value of the noise decreases with an increase in stimulus intensity (square-root dependency of noise-to-signal ratio) (RNQ):
where Qt
idenotes the quantum catch of stimulus by receptor i, Qb
ithe quantum catch of the background (both normalized to maximal quantum catch) and ωi′ represents the estimated values from electrophysiological recordings (Peitsch, 1992). To relate the predictions of the RN models with those of the COC model, the constant C should be set to 1.12.
We thank Randolf Menzel, Eric Warrant, Daniel Osorio, Peter Kevan and two anonymous referees for discussions and helpful comments. We are grateful to Josué Núñez, Walter Farina, Hector Verna, Fernando Grosclaude and Guillermo Zaccardi at the Faculty of Natural Sciences of the University of Buenos Aires (Argentina) for support during the conduct of the experiments. We also thank Pamela Hafner for carrying out part of the experiments and to Mary Wurm for help with the English. N.H.deI. was supported by the Academy of Sciences of Berlin-Brandenburg, and M.V. and M.G. by the Deutsche Forschungsgemeinschaft (DFG, Me-Giu 365/20-2). The permanent address of M.G. is at the University of Berlin. He appears with the address of the University of Buenos Aires as part of a cooperation program with the research group on social insects at this university.
References
Backhaus, W. (1991). Colour opponent coding in the visual system
of the honeybee. Vision Res. 31, 1381–1397.
Backhaus, W., Menzel, R. and Kreissl, S. (1987). Multidimensional
scaling of colour similarity in bees. Biol. Cybern. 56, 293–304.
Blackledge, T. A. (1998). Signal conflict in spider webs driven by
predators and prey. Proc. R. Soc. Lond. B 265, 1991–1996.
Brandt, R. and Vorobyev, M. (1997). Metric analysis of increment
threshold spectral sensitivity in the honeybee. Vision Res. 37, 425–439.
Chittka, L. (1992). The color hexagon: a chromaticity diagram based
on photoreceptor excitations as a general representation of colour opponency. J. Comp. Physiol. A 170, 533–543.
Chittka, L. and Menzel, R. (1992). The evolutionary adaptation of
flower colors and the insect pollinators color vision systems. J.
Comp. Physiol. A 171, 171–181.
Chittka, L., Shmida, A., Troje, N. and Menzel, R. (1994).
Ultraviolet as a component of flower reflections and the colour perception of Hymenoptera. Vision Res. 34/11, 1489–1508.
Craig, C. L. (1994). Predator foraging behavior in response to
perception and learning by its prey: interactions between orb-spinning spiders and stingless bees. Behav. Ecol. Sociobiol. 35, 45–52.
Craig, C. L. and Bernard, G. D. (1990). Insect attraction to
ultraviolet reflecting spider webs and web decorations. Ecology 71, 616–623.
(A15)
ωi= ωi′ + ,
1
2Qt
i
1
2Qb
i
冪
(A14) ∆S =
C ωS ,
2(∆f
L− ∆fM)2+ ωM2(∆fL− ∆fS)2+ ωL2(∆fS− ∆fM)2
(ωSωM)2+ (ωSωL)2+ (ωMωL)2
冪
(A13) ∆S = C
冪
G11(∆X1)2+ 2G12(∆X1∆X2) + G22(∆X2)2,(A12)
X2= [qS−(qM+ qL)/2]
冪
2/3 .Daumer, K. (1956). Reizmetrische Untersuchung des Farbensehens
der Bienen. Z. Vergl. Physiol. 38, 413–478.
de Vries, H. (1943). The quantum character of light and its bearing
upon the threshold of vision, the differential sensitivity and visual acuity of the eye. Physika 10, 553–564.
Dittrich, M. (1995). A quantitative model of successive color
induction in the honeybee. J. Comp. Physiol. A 177, 219–234.
Giurfa, M., Eichmann, B. and Menzel, R. (1996a). Symmetry
perception in an insect. Nature 382, 458–461.
Giurfa, M., Hammer, M., Stach, S., Stollhoff, N., Müller-Deisig, N. and Mizyrycki, C. (1999). Pattern learning by honeybees:
conditioning procedure and recognition strategy. Anim. Behav. 57, 315–324.
Giurfa, M., Núñez, J., Chittka, L. and Menzel, R. (1995). Colour
preferences of flower-naive honeybees. J. Comp. Physiol. A 177, 247–259.
Giurfa, M. and Vorobyev, M. (1998). The angular range of achromatic
target detection by honeybees. J. Comp. Physiol. A 183, 101–110.
Giurfa, M., Vorobyev, M., Brandt, R., Posner, B. and Menzel, R.
(1997). Discrimination of coloured stimuli by honeybees: alternative use of achromatic and chromatic signals. J. Comp.
Physiol. A 180, 235–243.
Giurfa, M., Vorobyev, M., Kevan, P. and Menzel, R. (1996b).
Detection of coloured stimuli by honeybees: minimum visual angles and receptor-specific contrasts. J. Comp. Physiol. A 178, 699–709.
Kaiser, W. and Liske, E. (1974). Die optomotorischen Reaktionen
von fixiert fliegenden Bienen bei Reizung mit Spektrallichtern. J.
Comp. Physiol. A 89, 391–408.
Kevan, P. G. (1978). Floral coloration, its colorimetric analysis and
significance in anthecology. Linn. Soc. Symp. Ser. 6, 51–78.
Kevan, P. and Backhaus, W. (1998). Colour vision: Ecology and
evolution in making the best of the photic environment. In Color
Vision (ed. W. Backhaus, R. Kliegl and J. S. Werner), pp. 163–178.
Berlin, New York: de Gruyter.
Kevan, P., Giurfa, M. and Chittka, L. (1996). Why are there so
many and so few white flowers? Trends Physiol. Sci. 8, 280–284.
Kugler, H. (1963). UV-Musterungen auf Blüten und ihr
Zustandekommen. Planta 59, 296–329.
Lehrer, M. (1993). Parallel processing of motion, shape and colour
in the visual system of the bee. In Sensory Systems of Arthropods (ed. K. Wiese, F. G. Gribakin, A. V. Popow and G. Renninger), pp. 266–272. Basel, Switzerland: Birkhäuser.
Lehrer, M. and Bischof, S. (1995). Detection of model flowers by
honeybees: the role of chromatic and achromatic contrast.
Naturwissenschaften 82, 145–147.
Lehrer, M., Srinivasan, M. V., Zhang, S. W. and Horridge, G. A.
(1988). Motion cues provide the bee’s visual world with a third dimension. Nature 332, 356–357.
Lunau, K. (1995). Notes on the colour of pollen. Plant Syst. Evol. 198, 235–252.
Menzel, R. (1967). Untersuchungen zum Erlernen von Spektralfarben
durch die Honigbiene (Apis mellifica). Z. Vergl. Physiol. 56, 22–62.
Menzel, R. and Backhaus, W. (1991). Colour vision in insects. In Vision and Visual Dysfunction: The Perception of Colour (ed. P.
Gouras), pp. 262–288. London: Macmillan Press.
Menzel, R. and Shmida, A. (1993). The ecology of flower colours
and the natural colour vision of insect pollinators: The Israeli flora as a study case. Biol. Rev. 68, 81–120.
Neumeyer, C. (1980). Simultaneous color contrast in the honeybee. J. Comp. Physiol. A 139, 165–176.
Neumeyer, C. (1981). Chromatic adaptation in the honeybee:
Successive color contrast and color constancy. J. Comp. Physiol. A
144, 543–553.
Peitsch, D. (1992). Contrast responses, signal to noise ratios and
spectral sensitivities in photoreceptor cells of hymenopterans. PhD thesis, Free University, Berlin.
Schrödinger, E. (1920). Grundlinien einer Theorie der Farbmetrik im
Tagessehen. Ann. Phys. 63, 397–520.
Srinivasan, M. V. (1994). Pattern recognition in the honeybee: recent
progress. J. Insect Physiol. 40, 183–194.
von Helmholtz, H. (1896). Handbuch der Physiologischen Optik,
second edition. Hamburg: Voss.
von Helversen, O. (1972). Zur spektralen Unterschiedsempfindlichkeit
der Honigbiene. J. Comp. Physiol. A 80, 439–472.
von Weizsäcker, E. (1970). Dressurversuche zum Formensehen der
Bienen, insbesondere unter wechselnden Helligkeitsbedingungen.
Z. Vergl. Physiol. 69, 296–310.
Vorobyev, M. and Brandt, R. (1997). How do insect pollinators
discriminate colours? Isr. J. Plant Sci. 45, 103–113.
Vorobyev, M., Hempel de Ibarra, N., Brandt, R. and Giurfa, M.
(1999). Do ‘white’ and ‘green’ look the same to a bee?
Naturwissenschaften 86, 592–594.
Vorobyev, M. and Menzel, R. (1999). Flower advertisement for
insects: Bees, a case study. In Adaptive Mechanisms in the Ecology
of Vision (ed. S. N. Archer, M. B. A Djamgoz, E. R. Loew, J. C.
Partridge and S. Vallerga), pp. 537–553. Dordrecht: Kluwer Academic Publishers.
Vorobyev, M. and Osorio, D. (1998). Receptor noise as a
determinant of colour thresholds. Proc. R. Soc. B 265, 1–8.
Vorobyev, M., Osorio, D., Bennett, A. T. D., Marshall, N. J. and Cuthill, I. C. (1998). Tetrachromacy, oil droplets and bird plumage
colours. J. Comp. Physiol. A 183, 621–633.
Waser, N. and Chittka, L. (1998). Bedazzled by flowers. Nature 394, 835–836.
Wehner, R. (1981). Spatial vision in arthropods. In Handbook of Sensory Physiology, vol. VIc (ed. H. J. Autrum), pp. 287–616.
Berlin: Springer.
Wehner, R. and Rossel, S. (1985). The bee’s celestial compass – a
case study in behavioural neurobiology. In Experimental
Behavioral Ecology (ed. B. Hölldobler and M. Lindauer), pp.
11–53. Stuttgart, New York: Gustav Fischer Verlag.
Wyszecki, G. and Stiles, W. S. (1982). Color Science – Concepts and Methods, Quantitative Data and Formulae, second edition.
New York: Wiley.


![[−2]proPSA versus ultrasensitive PSA fluctuations over time in the first year from radical prostatectomy, in an high-risk prostate cancer population: A first report](data:image/gif;base64,R0lGODlhAQABAIAAAP///wAAACH5BAEAAAAALAAAAAABAAEAAAICRAEAOw==)