Functional MR Imaging and Electrocortical Stimulation
David B. FitzGerald, G. Rees Cosgrove, Steven Ronner, Hong Jiang, Brad R. Buchbinder, John W. Belliveau, Bruce R. Rosen, and Randall R. Benson
PURPOSE: To determine the accuracy of functional MR imaging in locating language areas for planning surgical resection. METHODS: Intraoperative photographs were digitized and overlaid on functional MR language maps. The sensitivity and specificity of functional MR imaging for identi-fying language areas were determined for five different language tasks by comparing functional MR areas of language activation with results of electrocortical stimulation. A match was considered to occur if an activated area contacted, overlapped, or surrounded a language tag. The borders of the activation areas were extended by 1 and 2 cm to determine whether the number of matches changed. Language and nonlanguage tag matches were tabulated separately. RESULTS: Sensi-tivity/specificity for all patients and all language tasks ranged from 81%/53% for areas that touched to 92%/0% for areas separated by 2 cm. Individual language tasks were not as sensitive as a battery of language tasks combined. Location of language areas varied among subjects for a given task and among tasks for a given subject. CONCLUSION: Functional MR imaging should be considered a useful presurgical planning tool for mapping cortical language areas, because it is sensitive, it provides increased time for planning before surgery, and it is noninvasive.
Index terms: Magnetic resonance, functional; Magnetic resonance, in treatment planning
AJNR Am J Neuroradiol18:1529 –1539, September 1997
Surgical resection in the dominant
hemi-sphere near cortical language areas can result
in language deficits after surgery. The distance
of the resection from language sites, as
deter-mined with cortical stimulation, is the most
im-portant variable predicting recovery from
post-operative aphasia (1). Thus, accurately locating
all essential language areas is critical for a
speedy recovery as well as for avoiding
postop-erative deficits.
Functional imaging of cortical language
ar-eas is an extension of work done with
somato-sensory and motor areas in the cortex.
Func-tional magnetic resonance (MR) activation
during language tasks has been identified in
Broca’s area (2) (R. R. Benson, J. W. Belliveau,
K. K. Kwong, et al, “Lateralization and
Localiza-tion of Language Using FuncLocaliza-tional MR,” In:
Pro-ceedings of the Society for Neuroscience 24th
Annual Meeting,
Washington, DC: Society for
Neuroscience; 1994:6[9.7]). Activation in the
posterior superior temporal gyrus (Benson et al,
“Lateralization...”) as well as in the left middle or
superior temporal gyrus (A. C. Nobre, R. T.
Constable, G. McCarthy, J. C. Gore, “Activation
of Brain Areas during a Language Task Using
Conventional MRI,” In:
Proceedings of the
Soci-ety for Neuroscience 23rd Annual Meeting,
Washington, DC: Society for Neuroscience;
1993:740.11) has also been reported,
suggest-ing Wernicke’s area can be located through
Received September 3, 1996; accepted after revision March 24, 1997. Dr Belliveau’s sources of funding are National Institutes of Health grant MH50054, the Human Frontier Science Program, and the American Heart Association Established Investigator Award.
Presented in part in functional MR imaging workshops held at Massa-chusetts General Hospital and at the annual meeting of the Congress of Neurological Surgeons, Montreal, Quebec, Canada, September 1996.
From the NMR Center (D.B.F., J.W.B., B.R.R., R.R.B.), the Department of Neurosurgery (G.R.C., S.R., H.J.), and the Neuroradiology Division (H.J., B.R.B.), Massachusetts General Hospital, Charlestown.
Address reprint requests to David B. FitzGerald, c/o Bruce Rosen, MD, MGH NMR Center, Building 149 (2301), 13th Street, Charlestown, MA 02129.
AJNR 18:1529–1539, Sep 1997 0195-6108/97/1808 –1529
©American Society of Neuroradiology
functional MR imaging. In one report (T.
Mak-abe, H. Handa, K. Kinoshita, et al, “Usefulness
of Functional MR Imaging [fMRI] for Presurgical
Evaluation of the Eloquent Area,” In:
Proceed-ings of the Society of Magnetic Resonance 3rd
Scientific Meeting,
Berkeley, Calif: Society of
Magnetic Resonance; 1995:1343), areas
iden-tified by functional MR imaging were considered
to agree with results of electrocortical
stimula-tion in Broca’s area in two patients.
Our purpose in conducting this study was to
evaluate functional MR imaging as a predictive
technique for locating eloquent areas in the
dominant hemisphere. Our approach was to
lo-cate the cortical language areas using
func-tional MR imaging, map essential language sites
by using direct electrocortical stimulation, and
evaluate sensitivity and specificity of functional
MR areas of activation as compared with
essen-tial language areas identified by electrocortical
stimulation.
Materials and Methods
Patients
Thirteen patients with lesions in the presumed domi-nant hemisphere underwent functional MR imaging. At surgery they underwent electrocortical stimulation under local anesthesia. Patients gave informed consent and our protocol was approved by our hospital’s subcommittee on human studies. Of the 13 patients, one patient was claus-trophobic and was excluded because of motion during the functional MR study. Another patient was excluded owing to an unreliable cortical stimulation result.
Of the 11 remaining patients, eight had tumors, one had a benign cyst, one had epilepsy, and one had a cavernous angioma. One patient (P4) had surgery at another institu-tion, but the functional MR imaging was performed at our hospital. This patient’s surgical report, discharge sum-mary, and intraoperative photographs were forwarded to us. One patient (P8) was bilingual; her native language was Greek and she had a good working knowledge of English.
All 11 patients were right-handed. One patient (P10) who was strongly right-handed, which would usually pre-dict left-hemisphere dominance (3), was determined with Wada testing and later confirmed with functional MR test-ing to be right-hemisphere dominant. The patient’s hemi-spheric laterality ratio (4) was computed to be an average of 0.925 based on four runs of visual verb generation, indicating slight right-hemisphere dominance. For this pa-tient, mapping between cortical stimulation and functional imaging was performed in the right hemisphere. In all other patients, language maps and cortical stimulation were per-formed in the left hemisphere. In four patients (P1, P3, P5, P7), Wada testing confirmed left-hemisphere dominance;
one patient (P2) had equivocal Wada test findings, which tended toward left-hemisphere dominance.
Imaging
Whole-brain MR imaging was done on a 1.5-T Signa scanner with multisection echo-planar imaging. The initial scan included 59 sagittal sections ear to ear, with a section thickness of 3 mm. After the sagittal scan was obtained, an automated shim sequence was performed (5), which re-duced inhomogeneities in the magnetic field over the whole brain, thus increasing local sensitivity to activity-related signal change.
High-resolution echo-planar T1-weighted images con-sisted of 13 sections 7 mm thick with an in-plane resolu-tion of 1.5 mm. The gap between secresolu-tions varied from 1.0 mm to 2.5 mm depending on the size of the patient’s brain. The sections were oriented parallel to a line connecting the inferior frontal and temporal poles in an oblique axial plane. This section orientation minimized artifacts caused by orbit and neck structures as well as the number of sections needed to image the whole brain, thus maximiz-ing the number of images per section that could be ac-quired.
For functional imaging, we used an echo-planar asym-metric spin-echo sequence (2000/70 [repetition time/ echo time]; 180° offset of225 milliseconds) in the same orientation and location as the high-resolution echo-planar T1-weighted sections using a 1283 64 matrix (field of view, 4003200 mm), giving an in-plane resolution of 3.1 mm. Each section was imaged 78 times over 156 seconds with the first three images discarded because of initial nonequilibrium magnetization.
Foci for language activation as determined by electro-cortical stimulation are inferred to be 1 to 2 cm2 (6).
Projecting a functional imaging voxel of 3.133.137 mm to the cortical surface results in a pixel size of 3.137 mm. This pixel size is sufficiently smaller than the expected foci size so as to provide fine-grained resolution of functional MR language task areas as compared with areas identified by electrocortical stimulation.
Finally, we acquired two conventional T1-weighted spoiled gradient-echo volumetric (1.2-mm isotropic) scans, first without then with contrast agent (gado-pentetate dimeglumine) to generate surface renderings of the brain. These renderings, which included blood vessels, were used to register the activation maps with the surgical site.
tubes to plastic high ambient sound attenuation head-phones.
Tasks
Five tasks were used to activate language areas by means of either auditory or visual input. The format for each scan consisted of two periods of 30 seconds each of a task, with 30-second periods of fixation before, between, and after the tasks, for a total of 150 seconds. Up to two scans of each task were acquired per patient.
Visual Tasks.—Word reading is presumed to impose linguistic demands on the brain, with results from positron emission tomographic (PET) studies indicating that later-alized activation is produced during the reading of single words (7). A total of 80 medium- to high-frequency con-crete nouns of three to seven letters were chosen and separated into two lists. Each noun was presented for 150 milliseconds, with 1350 milliseconds between nouns, giv-ing a total elapsed time of 1500 milliseconds for each stimulus. Patients were instructed to read the word to themselves, without moving their mouth. The control task was visual fixation on a crosshair.
Visual verb generationhas also been shown to produce lateralized language activity in PET studies (8, 9). The same set of stimuli as in the word reading task, although in a different order, was projected onto the screen, with pa-tients instructed to think of a verb that is associated with the noun. For example, the word “ball” might generate the verb “hit.”
Auditory Tasks.—For auditory tasks, the primary and higher-order auditory cortex may be activated in addition to frontal language areas. This is consistent with our goal of evaluating the accuracy of tasks in determining lan-guage-activated areas.
Listening to single words was used to stimulate audi-tory and language areas. The words used were the same as in the word reading task. Words were recited on average every 1.5 seconds, with two periods of 20 words per scan. The control task involved attending to scanner noise.
Listening to text, as opposed to isolated words, was also used. A passage from a simple text on language and the brain had been previously recorded at a typical reading rate. The passage was then played through the head-phones. The tape was played for two periods of 30 seconds each, alternating with the control task, which was attend-ing to scanner noise.
Auditory verb generationused the same set of words as the visual verb-generation task, but the words were pre-sented through the headphones. Patients were instructed to think of the response, but not to vocalize it.
Ten patients performed visual verb generation, six per-formed auditory verb generation, four listened to a pas-sage, three read words, and two listened to words. The bilingual patient was given the visual verb-generation task in both Greek and English.
Although the task of naming objects has been validated and used extensively by neurosurgeons for cortical stim-ulation, it was not included in our battery of tasks, because
our experience with this task in functional MR imaging is that it produces poorly lateralized activity with a large amount of visual cortical activity. Since our goal was to minimize nonlinguistic activity as much as possible, object naming was therefore not included. Counting and over-learned speech are frequently preserved in aphasia and was therefore not considered a good predictor of language cortex.
Patients who were likely to have the sensorimotor re-gion (the precentral and postcentral gyri) exposed during surgery were asked to perform a tongue movement task, consisting of moving only their tongue from side to side. Tongue movement and the control task of rest were alter-nated for 30-second periods each. In some cases, patients were also instructed to open and close the hand contralat-eral to the hemisphere that would be exposed during sur-gery. Hand activity and rest tasks alternated for 30 sec-onds each. Both tongue and hand tasks were performed to reduce the possibility of confusing language and somato-sensory/motor areas.
Postscan Processing
The high-resolution 3-D spoiled gradient-echo image of the cortex was merged with the MR angiogram by using Analyze (Mayo Clinic, Minneapolis, Minn), which provided a surface rendering with anatomic landmarks. Statistical maps for each scan were generated from each section and time series on a pixel-by-pixel basis using the Komol-gorov-Smirnov nonparametric test (J. Baker, R. Weiss-koff, C. Stern, et al, “Statistical Assessment of Functional MRI Signal Change,” In:Proceedings of the Society of Mag-netic Resonance 2nd Scientific Meeting, Berkeley, Calif: Society of Magnetic Resonance; 1994:626; and D. Wu, and J. S. Lewin, “Evaluation of Non-parametric Statistical Measures and Data Clustering for Functional MR Data Analysis, In:Proceedings of the Society of Magnetic Reso-nance 2nd Scientific Meeting, Berkeley, Calif: Society of Magnetic Resonance; 1994:629). Komolgorov-Smirnov maps were converted to 2ln (P) statistical maps (10). Each functional scan was checked for motion before pro-ceeding. Typically, the first and last time point in the middle section were subtracted from each other. If a “halo” or “corona” appeared, indicating rigid body motion of the brain, the time series was motion corrected (11) (R. Turner, K. J. Friston, R. Howard, S. C. R. Wiliams, R. S. J. Frackowiak, “Automated Registration and Normalization of Functional MR Time Course Images,” In:Proceedings of the Society of Magnetic Resonance 3rd Scientific Meeting,
Berkeley, Calif: Society of Magnetic Resonance; 1995: 235).
The need to focus on results at the individual rather than group level made a fixed statistical threshold unrealistic, as people vary in their functional MR activation levels for a given task. Our experience in the lab across a wide variety of task paradigms in many brain regions is that some subjects are “strong” activators (eg, exhibit a large per-centage change in blood flow) and others are “weak” ac-tivators. The high degree of variability in location of lan-guage areas as well as differing surgical sites also prohibits setting thresholds based on a priori defined anatomic lo-cations.
Usually, functional MR studies and statistical analyses focus on setting thresholds at the voxel level to reduce type 1 (false-positive) error (12–14). However, the desire for deficit-free neurosurgery requires a balance between avoiding type 1 and type 2 (false-negative) errors. Type 1 errors can be reduced by use of cluster criteria to exclude single-voxel activation (12). Setting a requirement in which too many voxels are displayed results in the possibility of missing small but valid areas of language activation.
The display threshold for this study was adjusted on a task-by-task basis for each patient, resulting in the projec-tion to the cortical surface of areas of activaprojec-tion of about 1 cm or larger. This is consistent with the inference made by Steinmetz and Seitz (6), on the basis of a review of cortical stimulation data, that foci of language may be 1 to 2 cm2,
distributed throughout the cortex, and variable in location. The choice of 1-cm clusters is also consistent with the ob-servation that resecting 1 cm or more away from an essential language site results in fewer permanent deficits than resect-ing closer to a language site (1). The least strresect-ingent threshold for single-voxel display was aPvalue of .032.
The rendering was colorized, with yellow indicating a lesion, green indicating language activation, and red or blue indicating motor or sensory activation. Multiple views of the cortex and site(s) of activation were then printed for reference during surgery.
Cortical Stimulation
All craniotomies were performed with the patient under a local anesthetic (0.5% lidocaine and 0.25% bupivacaine hydrochloride) and mild intravenous sedation (propofol). Cortical stimulation was carried out using a constant cur-rent generator (Model S-12, Grass Instruments, Quincy, Mass) to produce biphasic stimulation (0.5 milliseconds per phase) with a frequency of 50 pulses per second. A hand-held bipolar stimulator probe with 2-mm-diameter ball tips and 5-mm spacing was used as the cortical probe. Somatosensory and motor areas were identified first to avoid confusing motor control areas for speech with areas essential for language. During stimulation, the patient was questioned about motor and sensory phenomena. Such responses as involuntary muscle contractions in the lips, involuntary finger movements, or tingling in the tongue were considered to identify motor or somatosensory areas, respectively. Sites found to control sensory or motor areas around the mouth, tongue, or hand were marked with sterile tags with a number or letter on the tag. Sites that
showed an effect on language were tagged in the same manner.
Current levels during cortical stimulation were adjusted by raising the stimulation level in 1-mA increments until an effect on language occurred. Thresholds for motor and sensory areas were generally lower than those found for speech or language areas. All thresholds for tagged areas were lower than the after-discharge level as assessed by simultaneous multichannel electrocorticography. Typical stimulation currents for threshold responses were in the 3-to 7-mA range. Functional MR images were used initially to assess which cortical regions should be stimulated and tagged.
Language areas were identified by using several tasks. Patients were presented with a line drawing on a card and asked to say, “This is a. . .” followed by the name of the object. Patients were also requested to recite overlearned speech (eg, naming the days of the week or the months of the year, counting from 1 to 20) as well as reversals of overlearned speech (eg, listing the days of the week back-ward from Thursday). Patients also read words aloud, which consisted of the same words as those used during functional MR imaging. A sterile tag was placed on the cortex if cortical stimulation caused perseveration, hesita-tion, phonemic, or semantic errors or speech arrest for any of the four tasks on repetitive testing.
The bilingual patient performed the object-naming task in her primary language (Greek) and then in her second language (English). An interpreter in the room validated the answers given.
After completion of the cortical mapping procedure, an intraoperative photograph was taken for comparison pur-poses. Cortical resection then proceeded in a routine man-ner.
Data Analysis
The intraoperative photograph was digitized with the use of a desktop scanner and imported into Adobe Photo-shop 3.0 (Adobe Systems Inc, Mountain View, Calif). The lateral projection from the 3-D renderings of activation was also imported into Adobe Photoshop. Both images were then scaled, rotated, and coregistered for maximum agreement, using the cortical surface veins and sulci as anatomic landmarks. Each image was given a separate layer in Photoshop and then superimposed via a transpar-ency option to evaluate the degree of mismatch between the two images of the surface vessels. The worst-case mismatch between the photograph and the rendering was 0.7 cm at the edge of the surgical field for patient P6, with agreement improving to 0.3 cm in the area of highest mismatch near a tag. Mismatch for other patients was 0.2 cm or less, with 1-millimeter matching or better for four patients.
cortical stimulation tags were also assessed as a function of distance. On the basis of previous assessments of dis-tance between cortical stimulation tags and essential lan-guage areas (1, 6, 15), the borders of the activation areas were extended by 1 and 2 cm to see whether the number of matches changed. Language and nonlanguage tag matches were tabulated separately.
The percentage of language stimulation tags that matched language activation areas was considered the true-positive rate, or sensitivity, of functional MR imaging. Specificity was the percentage of true-negatives (nonlan-guage tags; ie, sensory or motor tags) not found by func-tional MR imaging. The absence of a language tag was interpreted as the absence of activity in that area for a particular language task. However, cortical stimulation with a different language task might have resulted in speech arrest at the same site (16). Time constraints in an intraoperative setting limited testing to simple tasks, pre-cluding comprehensive language testing. Thus, a true-negative for language was not defined as an area without a language tag but rather as an area with a nonlanguage tag. Therefore, our working definition of specificity is the per-centage of nonlanguage tags (which we must define as true negatives given the constraints of electrocortical stim-ulation testing) that did not match with functional MR language areas. Two repetitions of the same task for a given patient (eg, two trials of visual verb generation) were averaged together and considered to be a single task for the purposes of this article.
Receiver operator curves based on sensitivity and spec-ificity for functional MR imaging were calculated for three match criteria: areas of activation contacting, overlapping, or surrounding language tags; areas of activation within 1 cm of the centroid of the tags; and areas of activation within 2 cm of the centroid of the tags. For each patient, all tasks were combined to compute an overall or combined sensitivity and specificity for that patient. As an example, assuming one language task matched one of three lan-guage tags and another lanlan-guage task matched a different language tag, the combined sensitivity for the patient would be 67%, in that two of three tags matched.
Task sensitivity and specificity were evaluated by task across patients for each of the three criteria (Table). The
number of tags matched by functional MR imaging were added across patients for a single task and divided by the total number of language tags for all patients. As an ex-ample, all auditory verb-generation tasks were added to-gether, giving 12 tags that contacted language activation and a total of 13 language tags, for a contact sensitivity of 92%. Each tag was only counted once. Motor or sensory stimulation sites were not always obtained during cortical stimulation, so specificity could not be calculated for those patients.
Results
Intraoperative photographs and functional
images were combined for all patients. A
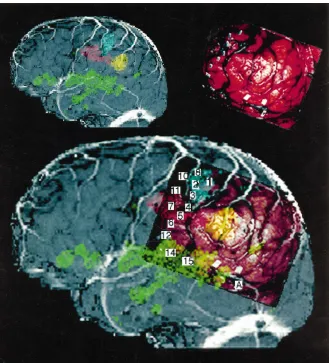
repre-sentative data set is shown in Figure 1.
Variation among Patients
As few as one and as many as seven
lan-guage tags were placed on a patient. The
aver-age was 3.4 tags per patient. Stimulation
threshold current levels for language ranged
from 1.5 to 11.5 mA for all patients as a group.
Current levels at different language sites varied
by as much as 5 mA for a given patient.
Considerable variability was found among
patients for a given language task. For example,
the task of visual verb generation, performed by
10 of the 11 patients, produced variable
pat-terns of activation as shown in Figure 2. All
patients showed activation in the frontal lobe
(inferior frontal gyrus and middle frontal gyrus),
with activation areas differing in size and shape.
All patients also showed activation in the
tem-poral or parietal lobes, although these areas
were generally smaller and more variable than
areas of frontal activity across patients.
Listening to text produced activation at or
near the superior temporal gyrus in all patients.
Sensitivity and specificity over distance by paradigm for all patientsTouching 1-cm Separation 2-cm Separation No. of
Language Tags
No. of Nonlanguage
Tags Sensitivity,
%
Specificity, %
Sensitivity, %
Specificity, %
Sensitivity, %
Specificity, %
Task
Visual verb generation 58 59 82 32 84 0 38 34
Reading 33 80 67 60 67 20 3 5
Listening to words 80 44 100 0 100 0 5 9
Listening to a passage 75 88 100 56 100 50 12 16 Auditory verb generation 92 40 100 20 100 0 13 5
No. of tags 48 44 63 24 64 9 71 69
All patients showed activation in the frontal
lobe, but these areas were generally smaller and
more variable than the areas in the temporal
lobe. A sample functional image of activation
produced by listening to text is shown in Figure
3C.
Auditory verb generation produced activation
at or near the superior temporal plane or
supe-rior temporal gyrus in the five patients in whom
it was tested. Activation also occurred
else-where in the cortex in differing locations. A
sample of an auditory verb generation
func-tional image is shown in Figure 3D.
The number of patients who performed the
task of reading and listening to words was too
small to articulate differences across patients
effectively.
Variation among Tasks
Using the match criterion by which the
acti-vation areas must contact the tags, an auditory
task was more sensitive than a visual task in six
patients (P4, P5, P6, P8, P9, and P11). Patient
P4 had neither of two language sites for visual
verb generation, but had the same one tag for
both auditory verb generation and listening to
recited text. Passive word reading captured one
of two tags in visual verb generation for patient
P5, while the auditory tasks of passive word
listening and auditory verb generation captured
both tags. Visual verb generation captured two
of three tags, while both auditory verb
genera-tion and passive listening to text captured all
three tags for patient P6.
Of the five language tags for patient P1, four
were clearly contacting language activation
ar-eas anterior to the motor arar-eas. The one tag not
touching was in Wernicke’s area. Although
speculative, we believe that if an auditory task
had been included in the battery of tasks given,
this region might have been located by
func-tional MR imaging.
[image:6.587.218.547.82.445.2]Neither of the visual tasks (passive word
Fig 1. Patient P11.
Top left, Functional MR rendering of ac-tivation maps combined with 3-D render-ing and MR angiogram.
Top right, Intraoperative photograph shows language and sensorimotor tags.
reading and visual verb generation) matched
the single language tag for patient P9, although
both passive listening to text and auditory verb
generation did capture the tag. Interestingly,
patient P11 had one of three language tags
cap-tured by visual verb generation. Listening to text
captured the two tags not captured by visual
verb generation. Thus, both auditory and visual
tasks were needed to achieve 100% sensitivity
for this patient.
Nonnative Language
For the bilingual patient (P8), sensitivity to
visual verb generation was found to depend on
the language used. With English, three
lan-guage tags were in direct contact with lanlan-guage
activation areas. In comparison, visual verb
generation in Greek had only one language tag
in contact with a functional activation area,
us-ing the same activation threshold (
P
5
.01) (see
Fig 4). Furthermore, when verb generation was
done with auditory input in English, all four tags
were matched (auditory verb generation was
not performed in Greek).
Sensitivity and Specificity among Patients
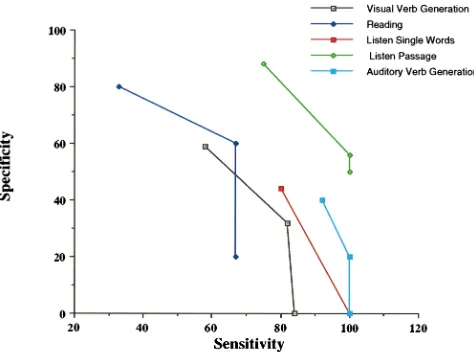
[image:7.587.50.548.84.444.2]A graph of sensitivity and specificity of data is
shown in Figure 5. Sensitivity for all tasks
com-bined across all patients increased from 81%
when the most stringent criterion (contact) was
used to 92% when the 2-cm criterion was used.
This means that 81% of all language tags were
contacted by functional MR areas of language
activation, with activation from only one of the
tasks required to touch the language tag.
Inter-personal variability was high, with individual
values ranging from 0% to 100% sensitivity
across the three criteria. For six patients, all
tags were found to be touching areas of
func-tional MR activation. For three patients,
sensi-tivity increased to 100% from 80%, 50%, and
71%, respectively, as the criterion changed from
contact to 1 cm away from the centroid of the
tags. Sensitivity for the remaining two patients
remained the same, at 80% and at 0%, from
contact to 2 cm of separation.
Specificity for all tasks combined across all
patients decreased from 54% to 0% as the
[image:8.587.219.545.84.335.2]cri-terion was relaxed from contact to 2 cm from
the boundary of activation to the centroid of the
tags. This decrease is not surprising, as the
criteria for specificity require that nonlanguage
tags not be touched by language areas of
func-tional MR activation. Thus, if any sensorimotor
tag is touched by a language activation area,
the specificity measure for that patient is
con-sidered to decrease. Given the close location of
sensory or motor centers to speech centers
[image:8.587.218.547.365.598.2]Fig 4. Patient P8. From left to right, top to bottom: activation map of visual verb generation in English; activation map of visual verb generation in Greek; intraop-erative photograph merged with activation map (area shown corresponds to the square drawn ontop leftimage); intraop-erative photograph merged with activation map (area shown corresponds to the square drawn ontop rightimage).1 indi-cates 5 mA: hesitation naming object in Greek, English not tested;2, 5 mA: speech arrest in both Greek and English;3, 4.5 mA: hesitation in English during number recitation, no hesitation in Greek;4, 4.5 mA: hesitation in English during number recitation, no hesitation in Greek.Blank tagswere used to identify sites of no re-sponse. Yellow indicates lesion; green, language activation.
along the central sulcus (as an example, see Fig
1), an increase in the area of separation
be-tween activation and tags is certain to include
more nonlanguage tags, thus decreasing
spec-ificity.
Discussion
Variation among Patients
Our results agree with other published studies
(17–19) of language mapping and cortical
stim-ulation in that there is variation across
individ-uals for the levels of current in cortical
stimula-tion that cause language errors. The wide
variation in cortical location of language
func-tion observed in this funcfunc-tional MR study for a
given task (see Fig 2) agrees with the findings
by Ojemann et al (17). Visual verb generation
was also concluded to be distinct from picture
naming or word reading and to vary in location
across subjects in a study comparing cortical
stimulation and functional PET imaging (J. G.
Ojemann, G. A. Ojemann, E. Lettich, “Cortical
Stimulation during a Language Task with
Known Blood Flow Changes,” In:
Proceedings of
the Society for Neuroscience 23rd Annual
Meet-ing,
Washington, DC: Society for Neuroscience;
1993:740.12).
Further agreement on variation across
pa-tients was found in a study by Davies et al (20)
of temporal lobe resections assisted by subdural
grids, which showed substantial variation in the
distance from the temporal pole of the dominant
hemisphere to the area of speech arrest (3 to 9
cm). In a study of 45 patients by Schaffler et al
(19), language maps showed a “core” and
“shell” area for both anterior and posterior
lan-guage areas, but a broad interpatient region of
variability on the periphery of these areas.
The differences in language maps among
in-dividuals as determined by both cortical
stimu-lation and functional MR imaging are also
con-sistent with anatomic findings for healthy
subjects. Variable asymmetries are found
be-tween the right and left side of the brain in
language areas, with gyral patterns in the
oper-cular area different in terms of packing and
width than those on the other side of the brain
(21, 22). Four different topographies of the
pa-rietal opercular region have been reported, with
38% of subjects showing different patterns
be-tween left and right hemispheres (23).
Single versus Multiple Tasks
The finding that more than one task is
nec-essary to maximize identification of essential
language areas by using functional MR imaging
is consistent with the need for multiple tasks
during cortical stimulation (16). That different
areas of the brain are involved in different
lan-guage tasks agrees with PET findings as well
(9). Although auditory verb generation had the
best sensitivity for a single task, visual verb
generation was also needed for one patient
(P11) to maximize the number of language tag
matches. Our results suggest the need to
ad-minister a battery of language tasks, both visual
and auditory, while the patient is in the scanner
to ensure identification of the maximal number
of language areas. A possible explanation for
the observed greater sensitivity of aural tasks
than visual tasks was a tendency toward
height-ened activation of the temporoparietal cortex.
Nonnative Language
[image:9.587.50.287.83.259.2]Patient P8 showed hesitation in her second
language at tags 3 and 4, but at the same
cur-rent level there was no hesitation in her first
language. Although the converse did not occur
(ie, hesitation in her first language without
hes-itation in her second language), the existence of
cortical areas specific for one language is
con-sistent with findings reported in other
multilin-gual patients undergoing cortical stimulation
(24 –27). Interestingly, in all seven subjects
re-ported in those studies, errors occurred in only
one of the two languages tested. In our study,
patient P8 only had errors in her second
lan-guage, English.
Differing patterns of activation for two
lan-guages are consistent with a study in which
finger spelling and oral language were located
in different sites in a single patient (28). This is
also consistent with the observation that
lan-guages not acquired at the same time are
spa-tially differentiated (K. Kim, J. Hirsch, N. Relkin,
R. DeLaPaz, K-M. Lee, “Localization of Cortical
Areas Activated by Native and Second
Lan-guages with Functional Magnetic Resonance
Imaging (fMRI),” In:
Proceedings of the
Interna-tional Society for Magnetic Resonance in
Medi-cine, Fourth Scientific Meeting and Exhibition,
Berkeley, Calif: Society of Magnetic Resonance;
1996:283). Lesion data also indicate that, for
some patients, there is differential impairment
of language in which only one language is
af-fected (29). Thus, in addition to the battery of
language tests mentioned above, our results
suggest that bilingual patients should be tested
in both languages to avoid deficits in either
lan-guage.
Aggregate Sensitivity
The change in aggregate sensitivity that
oc-curred between the criterion of touching and
that of 1 cm separation (from 81% to 92%)
together with the lack of change that occurred
from 1 to 2 cm is noteworthy. It is suggestive of
the finding by Haglund et al (1) that significantly
fewer language deficits result if resection
mar-gins are greater than 1 cm and suggests that
functional MR imaging may find virtually all
lan-guage areas.
This report and that of Makabe et al
(“Useful-ness...”) help to establish a correlation between
cortical stimulation and functional MR imaging
for identification of language areas. These
re-ports of physiological correlation as well as a
report of PET and MR correlation (D. R.
Wein-berger, N. F. Ramsey, B. Kirkby, et al,
“Three-dimensional Bold Functional MR and O-15
Wa-ter PET Neuroactivation Maps Are Highly
Correlated,” In:
Proceedings of the Society for
Neuroscience 25th Annual Meeting,
Washing-ton, DC: Society for Neuroscience; 1995:273)
help to validate the use of functional MR
imag-ing in healthy volunteers, and not just in
pa-tients scheduled for a craniotomy, for purposes
of language research. The location of a given
language task varied across patients. For all
patients, different language tasks produced
ac-tivation in different locations of the cortex. The
use of multiple language tasks increased the
sensitivity of functional MR imaging to cortical
language areas as revealed by electrocortical
stimulation. The performance of tasks in both
native and second languages raised the
sensi-tivity to essential language cortex in the one
patient tested in more than one language.
In conclusion, functional MR imaging shows a
high degree of promise for language location for
presurgical planning. The correlation between
functional MR language location and
electrocor-tical stimulation helps to validate functional MR
imaging both as a clinical and a research tool
for language processing. Further work is
needed in assessing the language tasks used
during imaging. This technique should be
con-sidered a strong presurgical planning tool, a
valuable adjunct to electrocortical stimulation,
and a valuable resource in language research.
Acknowledgments
We thank Thomas Talavage, William Logan, Tetsuo Makabe, and Alice W. Flaherty for their helpful comments and proofreading. Peyman Pakzaban, Timo Krings, and W. Jerry Oakes contributed photographs and clinical materi-als.
References
1. Haglund MM, Berger MS, Shamseldin M, Lettich E, Ojemann GA. Cortical localization of temporal lobe language sites in patients with gliomas.Neurosurgery1994;34:567–576
2. Hinke RM, Hu X, Stillman AE, et al., Functional magnetic reso-nance imaging of Broca’s area during internal speech. Neurore-port1993;4:675– 678
3. Bryden MP, Steenhuis RE. Issues in the assessment of handed-ness. In: Kitterle FL, ed.Cerebral Laterality.Hillsdale, NJ: Law-rence Erlbaum Associates; 1991:35–51
4. Benson RR, Logan WJ, Cosgrove GR, et al., Functional MRI local-ization of language in a 9-year-old child.Can J Neurol Sci1996; 23:213–219
5. Reese TG, Davis TL, Weisskoff RM. Automated shimming at 1.5T using echo-planar image frequency maps.J Magn Reson Imaging
1995;5:739 –745
6. Steinmetz H, Seitz RJ, Functional anatomy of language process-ing: neuroimaging and the problem of individual variability. Neu-ropsychologia1991;29:1149 –1161
7. Petersen SE, Fox PT, Posner MI, Mintun M, Raichle ME. Positron emission tomographic studies of the processing of single words.J Cogn Neurosci1989;1:153–170
8. Pardo JV, Fox PT. Preoperative assessment of the cerebral hemi-sphere dominance for language with CBF PET.Hum Brain Map-ping1993;1:57– 68
10. Press WH, Teukolsky SA, Vettering WT, Flannery BP.Numerical Recipes in C.2nd ed. Cambridge, United Kingdom: Cambridge University Press; 1992:623– 629
11. Jiang A, Kennedy DN, Baker JR, et al. Motion detection and correction in functional MR imaging.Hum Brain Mapping1995; 3:224 –235
12. Forman SD, Cohen JD, Fitzgerald M, Eddy WF, Mintun MA, Noll DC. Improved assessment of significant activation in functional magnetic resonance imaging (fMRI): use of a cluster-size thresh-old.J Magn Res Med1995;33:636 – 647
13. Friston KJ, Jezzard P, Turner R. Analysis of functional MRI time-series.Hum Brain Mapping1994;1:153–171
14. Friston KJ, Worsley KJ, Frackowiak RSJ, Mazziotta JC, Evans AC. Assessing the significance of focal activations using their spatial extent.Hum Brain Mapping1994;1:210 –220
15. Ojemann GA. Functional mapping of cortical language areas in adults, intraoperative approaches. In: Devinsky O, Beric A, Dogali M, eds. Electrical and Magnetic Stimulation of the Brain and Spinal Cord.New York, NY: Raven Press; 1993:154 – 163
16. Ojemann GA, Sutherling WW, Lesser RP, Dinner DS, Jayakar P, Saint-Hilaire J-M. Cortical stimulation. In: Engel J Jr, ed.Surgical Treatment of the Epilepsies.New York, NY: Raven Press; 1993: 399 – 414
17. Ojemann G, Ojemann J, Lettich E, Berger M. Cortical language localization in left, dominant hemisphere: an electrical stimulation mapping investigation in 117 patients. J Neurosurg 1989;71: 316 –326
18. Lesser RP, Luders H, Klem G, Dinner DS, Morris HH, Hahn JG. Cortical afterdischarge and functional response thresholds: results of extraoperative testing.Epilepsia1984;25:615– 621
19. Schaffler L, Luders HO, Beck GJ. Quantitative comparison of language deficits produced by extraoperative electrical stimula-tion of Broca’s, Wernicke’s and basal temporal language areas.
Epilepsia1996;37:463– 475
20. Davies KG, Maxwell RE, Jennum P, et al. Language function following subdural grid-directed temporal lobectomy.Acta Neurol Scand1994;90:201–206
21. Rubens AB, Mahowald MW, Hutton JT. Asymmetry of the lateral (sylvian) fissures in man.Neurology1976;26:620 – 624 22. Wada JA, Clarke R, Hamm A. Cerebral hemispheric asymmetry
in humans: cortical speech zones in 100 adults and 100 infant brains.Arch Neurol1975;32:239 –246
23. Steinmetz H, Ebeling U, Huang Y, Kahn T. Sulcus topography of the parietal opercular region: an anatomic and MR study.Brain Lang1990;38:515–533
24. Black PM, Ronner SF. Cortical mapping for defining the limits of tumor resection.Neurosurgery1987;20:914 –919
25. Ojemann GA, Whitaker HA. The bilingual brain. Arch Neurol
1978;35:409 – 412
26. Rapport RL, Tan CT, Whitaker HA. Language function and dys-function among Chinese- and English-speaking polyglots: corti-cal stimulation, Wada testing and clinicorti-cal studies. Brain Lang
1983;18:342–366
27. Ojemann GA. Brain organization for language from the perspec-tive of electrical stimulation mapping.Behav Brain Sci1983;6: 189 –230
28. Mateer CA, Polen SB, Ojemann GA. Cortical localization of finger spelling and oral language: a case study.Brain Lang1982;17: 46 –57


![2,3, exo,exo 5,6 Tetrabromobicyclo[2 2 1]hept 2 ene](data:image/gif;base64,R0lGODlhAQABAIAAAP///wAAACH5BAEAAAAALAAAAAABAAEAAAICRAEAOw==)