The speed at which an animal flies determines both its travel duration and its instantaneous power requirement because flight power changes with flight speed. The curve of power versus air speed during horizontal forward flight has a
minimum at the so-called minimum power speed (Vmp). At a somewhat higher flight speed, the maximum range speed (Vmr), the distance flown per unit of work done is maximal. To optimize flight performance, an animal may want to maintain Printed in Great Britain © The Company of Biologists Limited 1999
JEB1832
Aerodynamic theory predicts that minimum power (Vmp) and maximum range (Vmr) flight speeds increase when the body mass of an individual animal increases. To evaluate whether foraging bats regulate their flight speed within a fixed speed category relative to Vmp or Vmr, I investigated how the natural daily changes in body mass caused by feeding affected the flight speed of neotropical nectar-feeding bats (Phyllostomidae: Glossophaginae) within a strictly defined, stereotyped behavioural context.
Individual bats were maintained in a flight tunnel (lengths of five different types 14–50 m) with a fully automated feeding, weighing (using an electronic balance at the roost) and flight speed measuring system. Flight speeds were measured during normal nocturnal foraging activity by an undisturbed bat while it flew between the two ends of the flight tunnel to obtain food from two computer-controlled nectar-feeders. For a comparison of flight enclosure measurements with field data, flight speeds were also obtained from unrestrained bats foraging in their natural environment (Costa Rica).
Foraging flight speeds spanned a range of at least a factor 3 within a single species, which demonstrates the wide range of speeds possible to these animals. Significant, positive correlations between flight speed and the natural individual variability in body mass were found in nearly all cases, with body mass exponents ranging between 0.44 and 2.1. Bats flying at normal speeds were therefore not near their upper limit of muscle power. The most reliable measurements of speed increase with mass (with individual mass changes of up to 30 %) were close to the increase theoretically predicted for Vmpand Vmrfor an individual bat (with constant wing span and area), which should vary as M0.42, where M is mass. This provides evidence that the glossophagine bats attemped to maintain their flight speed within a fixed speed category relative to Vmpor Vmrduring foraging.
Among differently sized species of glossophagine bat (N=4), flight speeds V varied with V=20M0.23, in agreement with the mass exponent of 0.21 expected from aerodynamic models for interspecific variation.
In addition to the mass effect, at least five other variables significantly influenced flight speed. (1) Both mean and maximum flight speeds increased with the length and the cross-sectional area of the flight tunnel. Mean (maximum) flight speeds of 11–12 g Glossophaga soricina bats (in m s−1) were 4.6 (5.3) over a 7 m and 7.3 (10.5) over a 50 m flight path. (2) The flight speed range adopted by a bat during one night could vary significantly between nights, independently of body mass and the effect of the size of the flight enclosure. (3) Bats flew significantly faster under illumination than in darkness. This effect was shown (i) by bats kept under natural ambient illumination that initiated foraging during the twilight phase of the evening, (ii) when bats continued to feed into the light phase directly after the dark–light transition in the laboratory and (iii) during foraging under constant, artificial illumination. (4) After a period of rest, the initial flight speed during a foraging bout was significantly increased by 25 %, but declined to the mean level within 20 s of activity. (5) Flight speed could differ significantly between foraging (flight from feeder to feeder) versus non-foraging (flight from end to end of the enclosure without visiting the feeders) flights.
The results of this study demonstrate a clear ability of bats to regulate their flight speed in response to small natural changes in body mass as predicted by aerodynamic theory for Vmp and Vmr. The set point in flight speed regulation, however, was influenced by multiple additional variables.
Key words: flight speed, body mass, foraging, minimum power speed, maximum range speed, aerodynamics, Glossophaga soricina, Glossophaginae, nectar-feeding bat, bird, predation risk.
Summary
Introduction
FLIGHT SPEED AND BODY MASS OF NECTAR-FEEDING BATS (GLOSSOPHAGINAE)
DURING FORAGING
YORK WINTER*
Institute of Zoology II, Erlangen University, Staudtstrasse 5, 91058 Erlangen, Germany
*e-mail: ywinter@biologie.uni-erlangen.de
its flight speed at Vmp or Vmr, depending on the behavioural
context. This requires not only the flexibility to select flight speeds within a certain speed range, but also a regulating feedback control system that determines the optimum speed and keeps the flight speed at the set point. Even for a single individual, Vmpand Vmrare not invariant. Instead, they depend
on a number of variables including body mass. With an increase in body mass, flight power increases while Vmp and
Vmrshift to higher flight speeds (see Norberg, 1995). A flying
animal maintaining its speed at Vmp or Vmr will therefore
increase its air speed as it gains mass, e.g. as it feeds. Despite keen interest in the laws of flight speed regulation, it was hitherto not known whether individual bats or birds would respond to changes in body mass with a change in their flight speed in the direction predicted by aerodynamic theory. Two studies that addressed this issue directly found the opposite effect. Kestrels (Falco tinnunculus), when loaded with artificial weights simulating prey items, reduced their flight speed along a 135 m indoor flight corridor (Videler et al., 1988). By slowing down from a speed well above Vmptowards
Vmp, the kestrels reduced their power requirement. This, at
least partially, offset the effect of the weights on instantaneous flight power. Similarly, Plecotus auritus bats observed in a 4.5 m flight enclosure reduced their flight speed in response to natural and artificial mass gains (Hughes and Rayner, 1991). This caused an increase in instantaneous power demand for the bats as they reduced their speed below Vmp, as judged by
aerodynamic considerations.
The aim of the present study was to perform a further test of the compliance of animals with the predictions of aerodynamic theory. Instead of adding artificial loads that might stress the animals, however, I evaluated natural changes in body mass caused by food intake. This was performed within a strictly defined, stereotyped behavioural context using neotropical nectar-feeding bats (Phyllostomidae: Glossophaginae) which remained undisturbed by the experimenter during the automatic measurements. Glossophagine bats are specialist nectar and pollen feeders of 6–30 g that consume an amount of nectar equivalent to approximately 150 % of their body mass during their nightly foraging activity (von Helversen and Reyer, 1984; Winter, 1998b; Winter and von Helversen, 1998). Foraging is carried out on the wing, and these bats fly on average for 4–5 h per night, utilising approximately 50 % of their daily energy expenditure (von Helversen and Reyer, 1984; Winter and von Helversen, 1998). Nectar (and pollen) is gathered during several hundred to approximately 1000 hovering visits to flowers, and a bat will visit individual flowers repeatedly while they continue to secrete nectar during the night. Although nectar is processed rapidly, the food intake leads to a gradual increase in body mass of approximately 10–15 % over a night (Winter, 1998b; Winter and von Helversen, 1998). It is important to realize that nectar-feeding bats visit their feeding locations repeatedly during one night, possibly in a ‘trap-lining’ mode of foraging (von Helversen, 1993). Flight between flowers is therefore a commuting flight between
known locations rather than a search flight (as would be typical for the foraging flight of an insectivorous bat). This is relevant because flight speeds should differ for commuting and search flights.
In captivity, glossophagine bats readily adopt a behaviour pattern corresponding to that of their natural foraging and feed by continuously alternating between different feeder stations. For the experiments described here, individual bats were maintained in a flight enclosure with a fully automated feeding, weighing (using an electronic balance at the roost) and flight speed measuring system. Flight speeds were measured during nightly foraging activity while a bat alternated between two computer-controlled nectar-feeders positioned at the opposite ends of the flight enclosure. The data obtained from this general arrangement allowed me to investigate the relationship between the natural body mass changes of single individuals and their flight performance during the night. Five different flight enclosures were used (installed in the laboratory and outside) with four different species of bat, and additional data were collected in the natural environment (Costa Rica). Only using this diverse approach was it possible to document clearly the multiple variables that influenced foraging flight speed in addition to body mass.
Materials and methods
Animals
This study was conducted with individuals from four species of neotropical nectar-feeding bat (Phyllostomidae: Glossophaginae) kept and bred in mixed-species groups in tropical greenhouses at the Institute of Zoology, Erlangen University. The species used were (origin of individuals or of breeding stock given in parentheses): Glossophaga
commissarisi Gardner (Costa Rica), Glossophaga soricina soricina Pallas (Mexico), Glossophaga soricina antillarum
Rehn (Jamaica), Glossophaga longirostris Miller (Grenada) and Hylonycteris underwoodi Thomas (Costa Rica). The flight ability of nectar-feeding glossophagine bats does not deteriorate in captivity as has been reported for insectivorous
Plecotus bats (Hughes and Rayner, 1991). Given sufficient
space, they voluntarily maintain their natural flight activity of approximately 4–5 h of flying time per night (Y. Winter, personal observation). This is the case even when they are maintained with ad libitum nectar-feeders for which a cumulative foraging effort of approximately 30 min would suffice to balance their daily energy budget. Therefore, even without a special training programme, the individual bats used during this study were in good condition for flight.
Flight tunnel: general design
Therefore, a bat always had to come back to the balance roost to rest. The mass data from the balance were transferred to a computer (via the serial port) for storage. Body masses were calculated as the mean of 10 measurements obtained during a 1.8 s period and were only stored when the bat was hanging quietly at the roost. Mass data were rejected when the standard deviation of the mean from 10 measurements was above a threshold value that indicated movement of the animal. Thus, body masses were determined with an accuracy of greater than 20 mg. As explained below, it was not possible completely to avoid alternative roosting sites in the larger flight tunnels so that continuous body mass records were not obtained from all individuals in all the differently sized flight tunnels.
During the experiments, the bats were fed with an artificial nectar solution provided from two computer-controlled nectar-feeders based on a custom-built syringe pump (Winter and von Helversen, 1998). One feeder was positioned at each end of a flight tunnel. The feeders were controlled from a computer (MS-DOS 286) using a custom-written program and were operated such that a bat had to visit them alternately to receive food. Thus, while foraging from the nectar-feeders, a bat repeatedly passed through the full length of the tunnel. At their opening, the nectar-feeders had a photoelectric sensor that detected the presence of the hover-feeding bat. Using these sensors, the travel time between the two feeders could be recorded with an accuracy better than 0.01 s. In addition, a full-length pass could also be detected independently of these photosensors. This was achieved using two sets of infrared light source plus photosensor (Fig. 1) placed on the bottom and ceiling of the flight cage, 5 m from each end, which were triggered by a bat passing between them. A full-length tunnel transit could thus be detected even if the bat did not visit both feeders. Using this information, data could be classified as foraging (feeder visits at both ends) or non-foraging (no feeder visit) flights. For measuring instantaneous flight speeds, additional sets of infrared-light source and photosensor were placed at different positions along the flight track to record the passing of a bat. These sensors were connected to a second computer (MS-DOS 286) for timing and data storage.
Interspecific effects of body mass on flight speed in three species of Glossophaga
Most laboratory flight enclosures will not permit a bat or bird to attain flight speeds typical of natural conditions. To evaluate the influence of limited space on flight speed, measurements were conducted in a typical laboratory-size flight tunnel which in addition required a U-turn manoeuvre to fly from end to end. To assess the effect of body mass over a larger range of masses than can be obtained from a single species, flight speeds for one individual each of three differently sized Glossophaga species (G. commissarisi, G. soricina antillarum and G. longirostris), ranging in body mass from 8 to 17 g, were determined. The bats were observed in a
U-turn flight tunnel set up in a climate-controlled room with a distance of 14 m between its two ends (described and depicted by Winter and von Helversen, 1998); the photoperiod in this
room was set to 12 h:12 h L:D. Flight speeds within this tunnel were determined using two different methods. While a bat alternated between feeders during foraging along the 14 m U -turn flight path, mean flight speeds were determined from the flight duration between departing from one feeder and arriving at the other. This was recorded using the infrared photosensors in the feeder openings. To measure the speed profile of instantaneous flight speeds along the U-turn flight path, a series of 15 additional infrared photosensors was placed along the flight path, and speeds were measured for each section (Winter and von Helversen, 1998). No body mass records were obtained during these measurements of instantaneous flight speeds because the bats hung from the electric wires instead of the electronic balance.
Effects of body mass and enclosure size on flight speed in Glossophaga soricina
[image:3.609.322.562.65.284.2]To overcome the size limitations of any laboratory flight Fig. 1. Circuit diagram of the photoelectric device for the detection of a transient partial shadowing of an infrared light source used to detect a flying bat passing between a light source and a sensor (designed by N. Kondratieff and Y. Winter). Circuit operation: a reduction in light intensity at photodiode BPW34 reduces the voltage at R6 and at the (+)-inputs of OpAmps A (IC1A) and D (IC1D). OpAmps A and D match the signal impedance (amplification 1) for comparator OpAmp
B (IC1B). While A connects directly to the (−)-input of B, the signal
from D is delayed via a low-pass filter (R2C1). Therefore, a change in
signal intensity at R6 arrives at the (−)-input of comparator OpAmp B
enclosure, I erected a series of straight flight tunnels within an open pine forest on the premises of the animal-keeping facilities of the Zoological Institute. The flight tunnels were exposed to ambient illumination and temperature, although the roosting section was heated locally. The lights from a nearby pedestrian path provided some illumination throughout the night. Three different designs were used in successive years: two tunnels had a diamond-shaped (rhombic) cross-section with a side length of 0.7 m and a horizontal and vertical maximum of 1 m. The total lengths, from end to end, of the two versions used were 33 and 42 m. The third type was a 50 m long flight tunnel with a square cross section of 2 m×2 m. These tent-like flight enclosures were made of polyethylene sheeting (thickness 0.2 mm) suspended from a central wire strung between two trees and supported by a series of wooden or metal frames at 5 m intervals. Measurements were performed during the summer months with a single individual of
Glossophaga soricina antillarum in both the 33 m (two nights)
and the 42 m (five nights) flight tunnels, and with five individuals of G. s. soricina in the 50 m flight tunnel (total 10 nights). The numbers in parentheses are the nights during which both flight speed and body mass data were measured.
Hylonycteris underwoodi
Hylonycteris underwoodi was the smallest and most highly
specialized glossophagine species that was available. Flight speed and body mass data were obtained from one individual kept in a straight 34 m long flight tunnel of inverted triangular cross section (top width 1 m, height 1.5 m, bottom width 0.2 m) set up in a sub-basement corridor of the Zoology building. The bottom of the flight tunnel was 80 cm above the floor and was made of mosquito netting to permit the flow of air. Artificial photoperiod was set to 12 h:12 h L:D, except for one ‘night’ during which the lights were left on to provide continuous illumination.
Data analysis
Data analysis was restricted to flights in which a bat had passed along the full length of the flight tunnel in continuous, straight flight and triggered the sensors at each end. Incomplete passes (with intermediate turns) or passes in which not all sensors along the flight path were triggered were excluded from the analysis. Data from full-length passes were separated into three groups: (i) the bat visited the feeder at both ends, (ii) the bat visited the feeder at only one end, and (iii) the bat did not visit the feeder at either end. To restrict the data analysis for this study to a strictly defined behavioural context (foraging), only passes in which a bat had visited a feeder at both ends of the flight tunnel (foraging flights) were included (except for data in Fig. 7C). Often this was less than 50 % of all data. During an early phase of this project, it became clear that ambient illumination affected flight speed. Therefore data from the twilight hours of the night were excluded from the analysis. A general shortcoming of the automatic data collection was that the behaviour of an animal was not observed directly. Thus, it was not always certain whether an
individual had flown along a straight flight path or had meandered or even circled on the way. Measurements of very ‘slow’ flight speeds were caused mainly or even exclusively by such intermittent manoeuvres. Flight speeds at the ‘slow tail’ of the distribution (less than 2 % of the data) were therefore not considered for data analysis (see also Fig. 7C).
Field measurements
Field estimates of flight speeds during foraging were obtained for two glossophagine bat species while they were foraging for nectar within their natural habitat in the neotropical lowlands on the Atlantic side of Costa Rica (‘La Selva’ Biological Station, Puerto Viejo, Province Heredia). Data for Lonchophylla robusta were obtained by Marco Tschapka (Tschapka, 1998) and, because the source may not be readily accessible, a brief description of his method is given here. A radio-collared and reflective-foil-marked (Heller and von Helversen, 1990) individual of Lonchophylla robusta regularly used the same flight path along a row of five palm trees when approaching a flowering Matisia cordata tree for feeding. The bat could be clearly observed passing the different palm trees and was timed using a stopwatch over a flight distance of 29.5 m. The body mass of the animal was determined at the time of capture.
A second data set was obtained for individuals of
Glossophaga commissarisi foraging for nectar at the
bat-pollinated bromeliad Vriesea gladioliflora growing as epiphytes in small trees on the main laboratory clearing of the station area. Up to seven open flowers of different Vriesea plants were instrumented during the night with small infrared photosensors and light-emitting diodes connected to the parallel port of a battery-operated MS-DOS notebook computer for recording the times using a custom-written program. During the night, individuals of G. commissarisi triggered the photosensors while inserting their heads into the flowers during hover-feeding. Foraging activities of different individuals at the flowers hardly overlapped so that it was possible to reconstruct individual foraging paths while feeding from and flying between the instrumented flowers. Flight speeds were calculated from the travel time between flowers. Mean body mass for G. commissarisi bats at this location was taken from Tschapka (1998).
In addition to computing mean flight speeds between flowers by dividing distance by flight time, I also tried to estimate the mid-section travel speeds of G. commissarisi between the bromeliad flowers. The following formulae were derived for the single purpose of estimating this mid-section flight speed from the field measurements given in Fig. 8B. The approach rests on the simplifying assumption that acceleration and deceleration can be adequately approximated by using a single mean value for acceleration, determined in the laboratory. It was assumed that flight distance Stotbetween two flowers can
be divided into three sections, an acceleration section Sa, a
mid-section Sc with constant flight speed Vc, and a deceleration
section, also abbreviated Sa, which was taken to be equal in
data (see Fig. 2). Measured flight duration ttot between two
flowers was given as:
ttot = 2ta + tc, (1)
where ta is the duration of the acceleration phase and tcis the
flight duration along the mid-section. Acceleration distance Sais:
Sa = 0.5ata2, (2)
where a is acceleration (taken here to be constant). For both acceleration and deceleration (assumed to be equal to the acceleration phase), this gives:
2Sa = 2(0.5a)ta2 = ata2. (3)
Total flight distance Stotis then the sum of the acceleration and
deceleration distance and the length of the mid-section Sc,
which is equal to flight speed Vcmultiplied by flight duration
tc:
Stot = ata2 + Vctc, (4)
and, with Vc=ataand ttot=2ta+tc,
Stot = ata2 + ata(ttot−2ta) , (5)
which can be rearranged to the quadratic equation:
ata2−attotta + Stot= 0 (6)
and solved for taas:
Mid-section flight speed is Vc=ata, as noted above. Stotand ttot
were measured in the field, and a was measured for G.
commissarisi in the laboratory (see Figs 2, 8A).
Results
Interspecific effects of body mass on flight speed in three species of Glossophaga
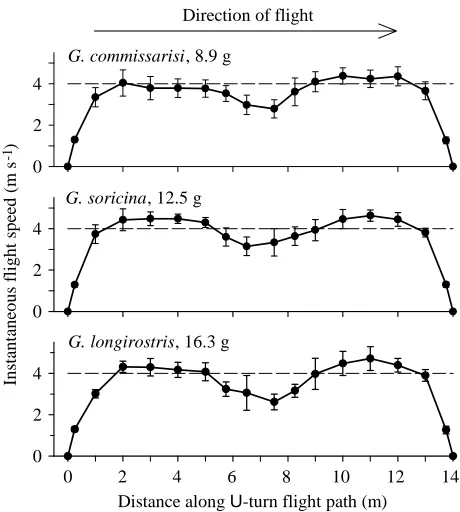
Flight speeds of the three Glossophaga species along the 14 m U-turn flight path (Fig. 2; Table 1B) were very similar despite the nearly twofold difference in body mass between G.
commissarisi and G. longirostris (Table 1). All three species
required approximately 2 m (or 0.9 s) to accelerate to their mid-section flight speeds of 4–4.5 m s−1(Fig. 2). The bats slowed down during the U-turn (radius 1–1.5 m) to between 56 % (G.
longirostris) and 70 % (G. soricina) of their maximal flight
speeds (shown in Table 1B), the largest G. longirostris thus decelerated the most. During the U-turn, the bats reversibly converted kinetic into potential energy by changing flight altitude: they ascended to the cage ceiling to reach their maximum height at the turning point and from there descended into the new direction. Acceleration after the turn (see Fig. 8A) was thus powered both from muscular work and by the transfer of potential energy to kinetic energy.
Body mass had a significant influence on flight speed in all three Glossophaga species (Fig. 3): G. commissarisi and G.
soricina increased their flight speed with increasing body mass
(Table 1A); in G. longirostris, this relationship was non-linear. Between 15 and 16 g, G. longirostris increased speed with mass, while at masses above 16 g flight speed decreased with increasing body mass (Fig. 3D) (P<0.001 for each separate regression).
Interestingly, in one of their observation nights, both G.
commissarisi and G. soricina flew with a flight speed
significantly higher than during the other nights, independent of body mass (Fig. 3B,C, analysis of covariance, ANCOVA, with body mass as covariate, P<0.001). At this higher speed,
G. commissarisi still increased its flight speed with body mass
(t-test on regression coefficient, P<0.001), while in G. soricina flight speed remained at the high level irrespective of changes in body mass (t-test on regression coefficient, P>0.05).
Effects of body mass and enclosure size on flight speed in
Glossophaga soricina
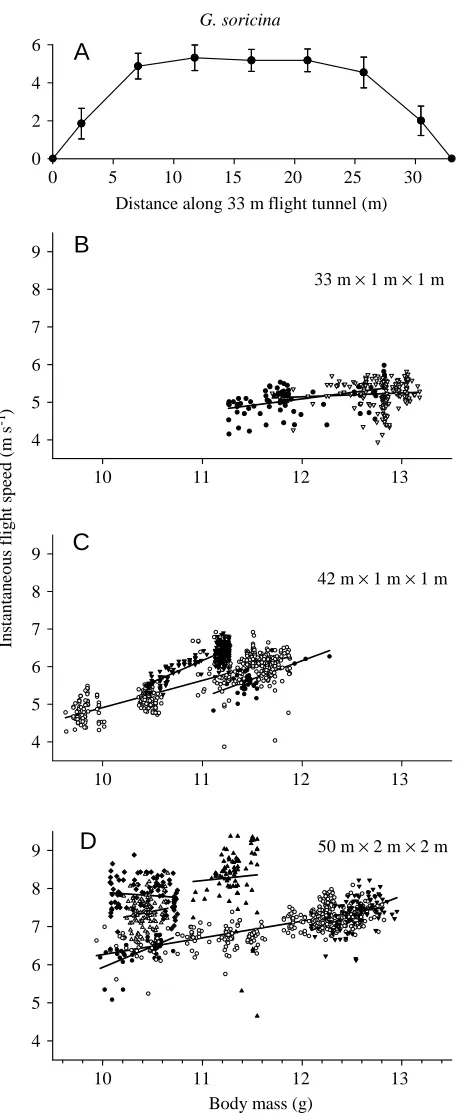
Instantaneous flight speeds for G. soricina were measured in the central 5 m section of three flight enclosures of different lengths (33, 42 and 50 m). The general trend observed in the 14 m U-turn tunnel was also apparent in the longer flight tunnels. In all three enclosures, a significant positive relationship between body mass and flight speed was generally observed (Fig. 4; Table 1B).
(7)
ta= .
2a
attot−
冪
a2ttot2−4aStot0 2 4
G. commissarisi, 8.9 g
0 2 4
G. soricina, 12.5 g
Distance along U-turn flight path (m)
0 2 4 6 8 10 12 14
0 2 4
G. longirostris, 16.3 g
Ins
ta
nta
ne
ous
f
lig
ht
sp
ee
d
(m
s
-1)
[image:5.609.325.555.69.325.2]Direction of flight
Fig. 2. Instantaneous flight speeds of three species of Glossophaga
bats flying between two nectar-feeders along a U-turn flight path
(7 m + 7 m). Data were obtained for a single individual of each species passing and triggering a series of photoelectric devices (15 on the ground plus two at the feeders) placed along the flight path and connected to a computer for timing and recording the event. The total number of flights was greater than 900 for each species. Error
bars indicate ±1 S.D. The dashed line at 4 m s−1 is included for
In the 42 and 50 m flight tunnels, significant shifts in flight speed that were independent of body mass were noted during some nights. This was the case for G.s.a.3, which at 11 g flew
at approximately 5.6 m s−1on one night and at approximately 6.2 m s−1on another night in the 42 m flight tunnel (Fig. 4C; Table 1B; G.s.a.3A,B). Similarly, individuals of G. s. soricina
(10–11 g) observed in the 50 m flight tunnel flew at mean speeds between 6.4 m s−1and 8.3 m s−1on different nights (Fig. 4D; Table 1B). Between-night differences in G.s.a.3 and
G.s.s.1 were statistically significant (ANCOVA with body
mass as covariate, P<0.01).
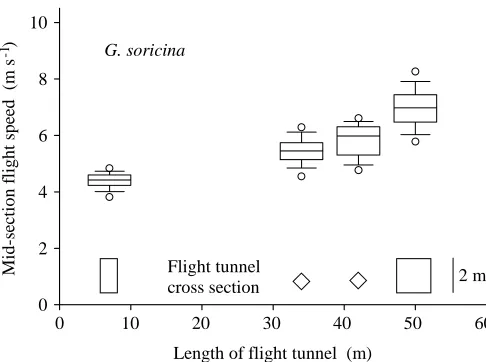
Enclosure size had an obvious effect on mean and maximum flight speeds in Glossophaga soricina. While mean and
maximum speeds were 4.6 and 5.3 m s−1on the 7 m half-section of the 14 m U-turn tunnel, they were 7.3 and 10.5 m s−1in the 50 m flight tunnel (Fig. 5).
Hylonycteris underwoodi
A single individual of this small bat was observed over a 3 week period in a 34 m straight flight tunnel erected in a sub-basement corridor. The vertical position of the flying bat in the tunnel was normally approximately 50 cm (one-third of the tunnel’s height) below the top cover. Thus, there was sufficient room between the wingtips and the plastic walls. Body mass, which was 8.1 g on average, varied during single nights by 0.4–2.1 g. Speed and body mass data were measured over 13 Table 1. Flight speed and its change with body mass in individuals of four species of glossophagine nectar-feeding bats during
foraging between two feeders located at opposite ends of differently sized flight enclosures
Flight
Mass Mass range Mean V Exponent n N path
Individual (g) (g) (%) (m s−1) b S.E.M. samples days P (m) Figure
A Mean flight speeds from feeder to feeder
G.c. 8.7 1.4 16 3.12 1.91 0.098 2733 4 <0.001 14 (U) 3B
G.s.a.1 12.6 2.4 19 3.39 0.38 0.049 7741 7 <0.001 14 (U) 3C
G.l. 16.5 3.4 20 3.31 Not linear − 6665 17 − 14 (U) 3D
B Instantaneous flight speeds at mid-section of flight tunnel
G.c. 8.9 − − 4.38 − − 1091 2 − 7/14 2
G.s.a.1 12.5 − − 4.63 − − 4269 4 − 7/14 2
G.l. 16.3 − − 4.72 − − 923 3 − 7/14 2
G.s.a.2 12.5 1.9 15 5.17 0.56 0.105 259 2 <0.001 33 4B
G.s.a.3A 11.0 2.2 21 5.61 1.42 0.046 445 5 <0.001 42 4C
G.s.a.3B 11.1 0.8 8 6.24 2.09 0.091 231 1 <0.001 42 4C
G.s.a.3C 11.5 0.9 8 5.64 2.00 0.396 42 1 <0.001 42 4C
G.s.s.1A 10.4 0.6 6 6.39 1.89 0.373 47 1 <0.001 50 4D
G.s.s.2 11.9 2.9 24 7.09 0.73 0.037 372 3 <0.001 50 4D
G.s.s.3 12.5 0.9 7 7.35 1.72 0.342 94 2 <0.001 50 4D
G.s.s.4 10.4 0.4 4 7.36 0.72 0.616 89 1 NS 50 4D
G.s.s.1B 10.4 0.7 6 7.83 −0.22 0.259 95 1 NS 50 4D
G.s.s.5 11.3 0.6 6 8.29 0.01 0.930 82 2 NS 50 4D
H.u.A 8.1 2.5 31 5.26 0.52 0.029 2316 13 <0.001 34 6
H.u.B 8.1 2.5 31 5.26 0.44 0.082 7 <0.01 34 6
Flight speeds in part A are mean speeds over the full length of the 14 m U-turn flight course determined from the time between departure from and arrival at the two feeders.
Instantaneous flight speeds in part B were determined in the mid-section of a flight tunnel by a bat triggering two photocells spaced at 1 m or 5 m intervals.
G.c., Glossophaga commissarisi; G.s.s., G. s. soricina; G.s.a., G. s. antillarum; G.l., G. longirostris; H.u., Hylonycteris underwoodi (all
Phyllostomidae: Glossophaginae).
Mass is mean body mass during nocturnal activity.
Mass range is the difference between the highest and lowest body mass of a single individual.
Flight speed V was related to body mass M by the equation V=aMbby least-squares regression analysis of the log-transformed values. The mass exponent b is given in the table.
P values give the probability that b=0 (t-test); NS, not significant.
n is the number of data points used for regression analysis and pooled from N observation days.
Different individuals of the same species are distinguished by subscript. In two individuals (G.s.a.3A–C and G.s.s.1A,B), data from different observation days differed significantly (ANCOVA, body mass as covariate, P<0.01) and were therefore treated separately, as denoted by the letters A, B and C.
nights and, over the pooled data, speed varied with mass as
M0.52±0.03(regression coefficient ±S.E.) (Fig. 6). If only single
nights with a body mass change of more than 15 % were considered, then the mean of the nightly mass exponents was found to be 0.44±0.08 (N=7 days, Table 1B). H. underwoodi never showed any pronounced change in flight speed between nights, although on a few occasions the bat transiently reduced its normal flight speed of approximately 5.3 m s−1 to approximately 4.6 m s−1. Interestingly, flight speeds of this individual bat were more often approximately 4.7 m s−1during the initial 10 day training period of getting accustomed to the
flight tunnel when the data-acquisition system was not yet fully functional. Only during one ‘night’, with continuous illumination, did H. underwoodi fly at a speed significantly higher than 5.3 m s−1(see below).
Effect of ambient illumination
On several different occasions, I observed that bats flew faster under illumination than in darkness. This was seen most markedly during a single ‘night’ with H. underwoodi during which the room lights were left on (Fig. 7A). In this situation, a 7.7 g H. underwoodi flew at a speed of 6.4 m s−1, approximately 30 % faster than in darkness. Even at this higher speed, H. underwoodi still showed a significant increase in flight speed with body mass (t-test on regression coefficient,
P<0.01), although its maximum speed of approximately
7.2 m s−1 appeared to be constant at all masses during this night.
A similar change in flight speed was shown by this bat after the dark/light transition in the morning. H. underwoodi often continued its feeding activity for a few minutes into the daytime period, and on these occasions flight speed increased abruptly when the lights went on from a speed of approximately 5.5 m s−1 to approximately 6.5 m s−1 under illumination.
Similar behaviour was exhibited by G. soricina under ambient illumination. In the 33 and 42 m long outside flight tunnels, G. soricina often commenced feeding activity during twilight. Flight speed was significantly higher at the beginning of this time and then decreased steadily with diminishing light levels over a 30–45 min period.
Flight speed during a foraging bout
Behaviour during the night changed between foraging
8 9 3
4
Body mass (g)
15 16 17 18 19
3.0 3.2 3.4
11 12 13 14
3 4
G. commissarisi
G. soricina
G. longirostris
M
ean
14 m
f
li
g
h
t s
p
eed (m
s
-1)
B
ody
m
as
s (g
)
8.0 8.5 9.0
Mass
Time from start of night (h)
0 2 4 6 8 10 12
3.0 3.5
Speed
A
B
C
D
[image:7.609.57.290.75.593.2]*
Fig. 3. Mean flight speeds of three species of Glossophaga bats flying between two nectar-feeders positioned at the opposite ends of a 14 m U-turn flight path within a flight tunnel of 2 m height and 1 m width. Mean speeds were computed from the flight distance of 14 m divided by the time between departure from one nectar-feeder and arrival at the other. Note that the instantaneous speeds along this flight path were not uniform (see Fig. 2). (A) An example of the simultaneous change in mean flight speed and body mass of a G.
commissarisi bat during the course of a single night. (B,C) The
relationship between mean flight speed and body mass for G.
commissarisi and G. soricina on different nights. Lines are
correlations between speed and mass for single nights; overall correlations of flight speed with body mass are given in Table 1A. To convey an impression of the typical scattering of data points, original data are included in B for the regression line marked with an asterisk. Linear regression plots are shown in B and C because the range of masses was small and a logarithmic model did not significantly improve the fit. For ease of comparison with theoretical predictions, however, the results in Table 1 and the Discussion were derived in power-law form. (D) Flight speeds of Glossophaga
longirostris, which changed in a non-linear fashion with body mass.
periods (of 3–15 min) and periods of resting. The onset of a foraging period was determined from take-off recorded on the roost balance. Relating flight speed during a foraging bout with the time interval since take-off showed that flight speed was significantly higher (by approximately 25 %) at the onset of flight activity and decreased to average levels within approximately 20 s. This effect was observed in Glossophaga
soricina soricina in the 50 m outside flight tunnel (Fig. 7B) and
in Hylonycteris underwoodi in the 34 m sub-basement flight tunnel (results not shown).
Foraging versus non-foraging flight
Bats did not always visit the feeders when flying between the ends of a flight tunnel (see Materials and methods; Winter and von Helversen, 1998). A comparison of speed distributions of foraging flights (feeder visits at both ends) and non-foraging flights (no feeder visit at either end) showed that, despite a general agreement between modal values, there was a clear difference between the two distributions at higher flight speeds (Fig. 7C). During non-foraging flights, bats flew faster during approximately 10 % of the observations and showed a clear second speed maximum of 8–9 m s−1. Also, the highest flight speeds recorded in the 50 m flight tunnel for Glossophaga
soricina (up to 10.5 m s−1) were recorded during non-foraging flights.
Field measurements and interspecific allometry of flight speeds
Flight speed determined for an adult male of Lonchophylla
robusta of 16.7 g, bearing a 1.2 g radio transmiter (total mass
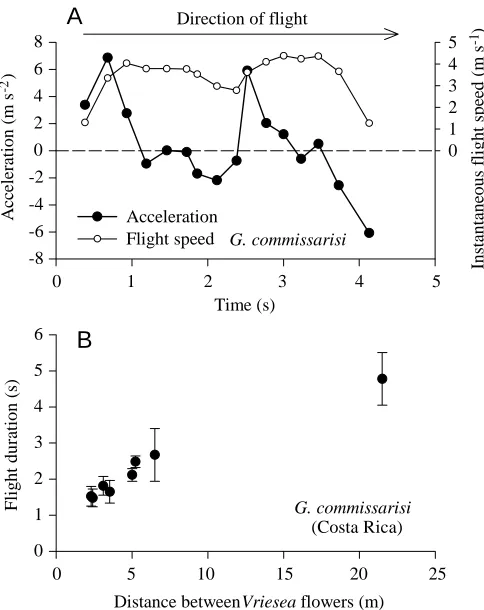
17.9 g), was 8.6±0.37 m s−1 (mean ± S.D., N=4; Tschapka, 1998). The time needed for an 8.8 g Glossophaga commissarisi to fly between the flowers of Vriesea bromeliads in an open clearing is shown in Fig. 8B. Flight duration over a 21.5 m distance was 4.78 s. From this value, a mean mid-section flight speed of 6.5 m s−1 was estimated using equation 7 and assuming an acceleration of 4.4 m s−2as measured in a flight tunnel during the first second after departure from the feeder (Fig. 8A).
The change in flight speed with mass between differently sized species was determined using field data from the present study and values from the literature. The preliminary allometric relationship derived from the log-transformed data follows a mass exponent b of 0.23 (Fig. 9). Because of the small sample size of glossophagine species studied to date (N=4), this value for b should be regarded with caution. It is,
10 11 12 13
4 5 6 7 8 9
10 11 12 13
4 5 6 7 8 9
In
st
an
ta
ne
o
u
s fli
ght
sp
ee
d
(
m
s
-1)
Distance along 33 m flight tunnel (m)
0 5 10 15 20 25 30
0 2 4 6
33 m × 1 m × 1 m
42 m × 1 m × 1 m
Body mass (g)
10 11 12 13
4 5 6 7 8 9
G. soricina
A
B
C
[image:8.609.51.282.68.626.2]D
50 m × 2 m × 2 mFig. 4. Instantaneous flight speeds of Glossophaga soricina bats in three different straight flight tunnels with the following dimensions: 33 m×1 m×1 m (A,B), 42 m×1 m×1 m (C) and 50 m×2 m×2 m (D) (length × width ×height). (A) The change in flight speed along the length of the 33 m flight track determined by eight photosensors placed at approximately 5 m intervals (error bars indicate ± 1 S.D.,
N=74–1294). (B–D) Data from the mid-section of a flight tunnel
however, in general agreement with the theoretically expected value for b of 0.21 for the interspecific variation of Vmpand
Vmrin bats (Norberg and Rayner, 1987).
Discussion
This study provides clear evidence that individuals of glossophagine nectar-feeding bats increase their flight speed in response to gains in body mass during foraging. This was observed by measuring flight speeds during stereotyped foraging behaviour of undisturbed bats flying between two feeder stations at opposite ends of a flight tunnel. Nocturnal feeding led to body mass increases during the night, in response to which bats increased their flight speed (Figs 3, 4, 6). The opposite response, a statistically significant decrease in flight speed with body mass, was not observed, except for the special case of G. longirostris at high body masses along a 14 m U-turn flight path (Fig. 3D). The behaviour of the bats was therefore qualitatively consistent with predictions of aerodynamic theory according to which an animal maintaining flight at a fixed speed category (such as minimum power speed
Vmpor maximum range speed Vmr) shifts to higher flight speeds
at higher body masses.
The general results of this study are contrary to the observations of Videler et al. (1988) and Hughes and Rayner (1991), who both observed decreases in flight speed at higher body masses. However, these results may not be contradictory. The data from differently sized Glossophaga species in the 14 m U-turn flight tunnel provided evidence that, as manoeuvrability becomes more difficult at higher wing loadings within a confined space, flight speed may well decrease with an increase in body mass (Fig. 3D). While G.
longirostris increased its flight speed at body masses between
15 and 16 g, this trend was reversed above 16 g where flight speed decreased with increasing body mass (Fig. 3D). This was probably an effect of manoeuvrability difficulties along the U-turn flight path and may be directly comparable with the behaviour of an 11 g Plecotus auritus within a 1 m×1 m×4.5 m flight enclosure (Hughes and Rayner, 1991).
In relating the findings of this study to aerodynamic theory, two questions need to be addressed: (i) how does the observed increase in flight speed with body mass compare quantitatively with the predictions derived from aerodynamic considerations for the changes of Vmrand Vmpwith body mass, and (ii) how
far do the measured flight speeds correspond to the flight speed categories Vmpor Vmr?
The body mass exponent of flight speed increase
Despite individual differences in the application of aerodynamic theory to animal flight by various researchers, there appears to be general agreement that a defined speed category such as minimum power speed (Vmp) and maximum
range speed (Vmr) should increase with body mass. For an
individual animal with constant wing span and wing area, Vmp
and Vmr should scale with body mass M according to the
relationship V=aM b, with the mass exponent b equal to approximately 0.42 (Pennycuick, 1975, 1989; Norberg and Rayner, 1987; Rayner, 1990). Thus, even if an animal did not fly at exactly Vmp or Vmr, but instead at a speed in fixed
proportion to it (for example 1.2×Vmp), we would still expect
the same mass exponent for speed increase.
Flight speeds in Glossophaga soricina spanned a range of approximately a factor of 3 (3.5–10.5 m s−1, Figs 3C, 4, 7C), which demonstrates the wide range of speeds possible in these animals. Bats therefore chose a range of speeds differing in their balance between lift and drag. Slower speeds have the advantage of decreased drag, while at higher speeds it might
Length of flight tunnel (m)
0 10 20 30 40 50 60
Mid-s
ec
tion f
lig
ht
spe
ed
(m
s
-1)
0 2 4 6 8 10
䉫
䉫
Flight tunnel cross sectionG. soricina
[image:9.609.50.293.70.251.2]2 m
Fig. 5. Flight speeds of Glossophaga soricina bats in the mid-section of flight cages of four different sizes. The boundaries of the box indicate the twenty-fifth and seventy-fifth percentiles, and the line within marks the median. Whiskers indicate the tenth and ninetieth percentiles, and open circles the fifth and ninety-fifth percentiles. The images at the bottom show the cross-sectional areas of the four different flight tunnels used.
Body mass (g)
7 8 9
Ins
ta
nta
ne
ous
f
lig
ht
sp
ee
d
(m
s
-1)
4 5 6
H. underwoodi
[image:9.609.325.558.74.217.2]be easier to generate sufficient lift but with a higher drag penalty. In those cases in the present study where a positive scaling of speed with mass was found, b varied between 0.44 and 2.1 (Table 1; Fig. 10). The behaviour of the bats was therefore very versatile, providing several possible interpretations. The large variability may suggest, on the one hand, that the bats did not regulate their speed by following the theory of fixed-wing aerodynamics, which raises the question of whether quasi-steady aerodynamics are appropriate for modelling flapping flight in bats. On the other hand, the large variability in the data may have been due to the additional influence of behavioural variables and experimental design (size and shape of flight tunnels). This may partly mask the still existing influence of aerodynamic factors as predicted by current quasi-steady aerodynamic theory.
The largest and smallest values for b were obtained either
in flight tunnels with a small cross-sectional area (33 m and 42 m tunnels, Glossophaga soricina), which restricted flight speeds (Fig. 5, and see below), or from data sets with only a low variability in body mass (<10 %) (Fig. 10). Thus, these values may be less reliable indicators of the bats’ natural behaviour. One of the tightest correlations of flight speed with body mass was found for G. commissarisi in the 14 m U-turn flight tunnel, with a highly significant mass exponent
b of 1.9±0.1 (Fig. 3A,B; Table 1A) well above the predicted
value of 0.42. The manoeuvre around the U-turn represented a special complication, however, for which simple predictions from aerodynamic theory for straight flight do not apply.
The range of values found here for b included, at its lower end, the theoretically predicted value. It is intriguing that, with increasing variability of body mass in a data set (up to 31 % change in body mass), the mass exponent b converged on the predicted exponent of 0.42 (Fig. 10). On the basis of a wider range of individual body masses, the derived regression slopes (b) may be considered more reliable than those from less-variable data sets and, incidentally, their standard errors were also much smaller (Table 1B; Fig. 10). As discussed in more detail below, flight speeds were influenced by a number of variables, of which body mass was only one. However, although the variability in the data may indicate that they still hold some surprises, they tend to support the idea that glossophagine bats have, and use, the ability to regulate flight speed with body mass to maintain their speed within a defined speed category as predicted by current aerodynamic models.
Instantaneous flight speed (m s-1)
4 5 6 7 8 9 10 11
Number of flights
0 100 200 300 400 500 600
Feeding Not feeding Body mass (g)
7 8 9
In
st
an
ta
n
eou
s
fl
ig
h
t s
p
ee
d
(m
s
-1)
4 5 6 7
Time from start of foraging bout (s)
0 30 60 90 120 150 180
R
elativ
e flig
h
t sp
ee
d
(%)
80 100 120
140
B
C
A
Under illumination
In darkness
H. underwoodi
G. soricina (50 m)
[image:10.609.46.289.64.520.2]G. soricina (50 m)
Choice of flight speed range: Vmpor Vmr?
It is customary in discussions of flight speed to consider the flight speed category (i.e. Vmpor Vmr) chosen by the animal.
Taking into account the dearth of empirical information regarding the shape of the power-to-speed relationship in glossophagine bats or small bats in general, such an attempt is speculative at present and may well be a premature exercise that does not yield reliable conclusions (Ellington, 1991; Voigt and Winter, 1999). Maximum range speed Vmrin particular is
only poorly defined since, in the vicinity of Vmr, substantial
changes in speed either way make very little difference to the effective lift/drag ratio (Pennycuick, 1997).
The mean value of measured flight speeds of Glossophaga
soricina during foraging was 7.3 m s−1 at 11.3 g (50 m flight tunnel, N=5; Table 1B; Fig. 7C), which was in agreement with foraging flight speeds from other glossophagine species under field conditions (Fig. 9). Current equations derived from
aerodynamic models predict the following values for Vmpand
Vmr for a G. soricina with a body mass of 0.0113 kg, a wing
span of 0.272 m and a wing area of 0.0110 m2(morphological
Time (s)
0 1 2 3 4 5
A
cc
eleration (m
s
-2)
-8 -6 -4 -2 0 2 4 6 8
Ins
ta
nta
n
eous
f
light s
p
ee
d
(m
s
-1)
0 1 2 3 4 5
Acceleration Flight speed
Direction of flight
Distance between Vriesea flowers (m) 0 5 10 15 20 25
Flig
ht dura
tion (s
)
0 1 2 3 4 5
6
B
A
G. commissarisi
(Costa Rica)
[image:11.609.52.294.71.376.2]G. commissarisi
Fig. 8. Instantaneous flight speed, flight acceleration and flight duration in Glossophaga commissarisi. (A) Flight speeds and derived acceleration against time of a G. commissarisi bat during flight in a 14 m U-turn flight cage (values are derived from the data in Fig. 2; direction of flight is indicated by the arrow). Values are plotted on the time axis above the (right) end point of the time interval for which they were determined. (B) Field measurements of flight duration by G. commissarisi while flying between flowers of Vriesea
gladioliflora bromeliads for nectar-feeding (Costa Rica). Values are
means ± 1 S.D., N=4–15. Data from A and B were used with equation 7 for estimating mid-section flight speeds of G. commissarisi during foraging flights (see Results).
Body mass M (kg) 0.007 0.01 0.015 0.02
Flig
ht s
pe
ed,
V
(m
s
-1)
5 6 7 8 9
V = 20 M 0.23 L.c.
G.c.
L.r.
G.s.
[image:11.609.328.558.72.223.2]Glossophaginae
Fig. 9. Flight speeds of glossophagine bats. Data from a 24.4 g
Leptonycteris curasoae (L.c.; 8.2 m s−1, field estimate, mass includes 1.4 g radio tag; Sahley et al., 1993), a 17.9 g Lonchophylla robusta (L.r.; 8.6 m s−1, field estimate, mass includes 1.2 g radio tag; Tschapka, 1998), an 11.3 g Glossophaga soricina (G.s.; 7.3 m s−1, 50 m flight tunnel, mean from five individuals, this study) and an 8.8 g G. commissarisi (G.c.; 6.5 m s−1, combined field and laboratory estimate, this study). Open circles show the individual data for G.
soricina from the 50 m flight tunnel (Table 1B), and open squares the
data for Hylonycteris underwoodi flying in darkness (5.2 m s−1) or under illumination (6.4 m s−1) (see Fig. 7A). The least-squares regression line gives the relationship between the interspecific change in flight speed V (m s−1) and body mass M (kg) and was computed from the three field measurements (G. c., L. r., L. c.) and the value for G. soricina from the 50 m flight cage,
V=20±8.3M0.23±0.10 (regression coefficients ± S.E., N=4; P=0.10,
r2=0.80).
Fig. 10. The mass exponent b obtained from regressing instantaneous flight speeds V from the mid-section of different flight tunnels on body mass M (V=aMb) for data sets with differing body mass variability (data from Table 1B). The dashed line at b=0.42 indicates the mass exponent theoretically expected from aerodynamic considerations for the within-individual (constant wing span and area) increase in flight speed with body mass for a specific flight speed category (such as minimum power speed, Vmp, or maximum range speed, Vmr; Pennycuick, 1975, 1989; Norberg and Rayner, 1987; Rayner, 1990). Error bars indicate the standard error of the regression coefficient (from Table 1B).
Body mass variability, (Mmax− Mmin )/Mmean
0 10 20 30
Ma
ss
e
x
pone
nt,
b
0 1 2
0
-1 0.42
[image:11.609.318.568.431.563.2]data from Winter, 1998a, based on N=4): Vmp 3.6 m s−1
(Norberg and Rayner, 1987) and 6.2 m s−1(Pennycuick, 1989, with CDb=0.1; Pennycuick, 1997; where CDbis the body drag
coefficient); Vmr 4.8 m s−1 (Norberg and Rayner, 1987) and
11.7 m s−1 (Pennycuick, 1989, with CDb=0.1; Pennycuick,
1997) (using the formerly recommended value of CDb=0.4 for
programme 1 in Pennycuick, 1989, yields Vmp=4.4 m s−1and
Vmr=8.0 m s−1). Discussion of this large range of theoretical
predictions (a factor of >2 for Vmr) based on different
aerodynamic models is beyond the scope of this paper. Furthermore, discrepancies between recent metabolic measurements and aerodynamic predictions raise the question of whether current quasi-steady aerodynamic theory can be used to predict reliably the metabolic power curve for a
Glossophaga bat. While quasi-steady aerodynamic analysis
based on quantified kinematics and wake velocity predicts an increase in aerodynamic power output during hovering flight over power output during horizontal forward flight by a factor of 1.7–2.6 (Norberg et al., 1993), measurements of metabolic power input revealed a difference of only a factor of 1.1–1.2 between hovering flight power and forward flight power at medium speed (Winter and von Helversen 1998; Winter et al., 1998; Winter, 1998a; Voigt and Winter, 1999). Thus, the metabolic power curve of Glossophaga may be J-shaped (as reported for two hummingbird species; Berger, 1985; Ellington, 1991) with an as yet unknown increase in power at higher flight speeds.
At this point, we can note that the measured velocity of 7.3 m s−1 for G. soricina in the 50 m flight tunnel exceeded predicted values of 3.6 m s−1 and 6.2 m s−1 for Vmp and fell between the two current predictions of 4.8 m s−1and 11.7 m s−1 for Vmr. The observed increase in speed with body mass provides a strong argument for the hypothesis that bats did in fact try to maintain their speed within a fixed speed category relative to Vmp or Vmr. This speed category was well below flight speed at maximum power (1) because the bats were able to increase their speed with a gain in mass and thus demonstrated reserve muscle and metabolic capacity and (2) because the maximum speed of 10.5 m s−1 recorded here for Glossophaga soricina was nearly 50 % greater than the mean speed.
The correlated increase in flight speed with body mass requires a feedback control system for flight speed that is not trivial. Because bats in the long flight tunnels probably flew above minimum power speed, the set point of flight speed was not identical with, but instead above, the speed of minimum metabolic power drain. After an increase in body mass due to feeding, flight speed regulation therefore led to a double increase in instantaneous flight power requirement: a bat expended more energy by being heavier and also increased its expenditure by flying faster (at speeds above Vmp). It is not known how this regulatory task is solved.
Flight speed regulation: optimizing energy or minimizing predation risk?
The discussion of optimal flight speeds has emphazised
aspects of (1) energetic efficiency (minimizing cost of transport, see Hedenström and Alerstam, 1995), (2) time efficiency (maximizing rates of food gathering, see Ydenberg et al., 1994; Ware, 1975; Norberg, 1981) and (3) metabolic limits on flight power that in larger animals restrict flight to slow speeds (see Pennycuick, 1997). While these factors are of general importance, additional factors may influence the choice of foraging flight speeds within the small spatial scale of an animal’s feeding habitat as simulated during this study. One arises from the potential presence of predators: while an energetic inefficiency may be compensated for at another time, death is final. Neotropical nectar-feeding bats may be vulnerable to flying predators such as owls, carnivorous bats (although aerial pursuit by them remains undocumented), bat falcons Falco rufigularis during twilight (observations from Mexico and Venezuela; O. von Helversen, personal communication) or ambush predators such as snakes, which might lie in wait by flowers, or opossums, which have been observed to leap at glossophagine bats hover-feeding at a flower (O. von Helversen, personal communication). Predation risk may be a very strong selective force, especially in small and vulnerable but still long-lived bats (K-strategists, e.g. Begon et al., 1998) that may not be intuitively obvious. A bat may therefore have to find a compromise between optimizing energetic performance during foraging and maintaining a mode of flight that enhances its ability to escape from a predator. Flying faster at higher body masses may enhance the ability to generate quickly the aerodynamic forces necessary for initiating an escape manoeuvre. In a world of predators, factors in addition to energy might influence flight speed and it may be illuminating to quantify startle reactions during foraging flight.
Additional effects on flight speed
The switch in mean flight speed observed in single individuals of both Glossophaga soricina and G. commissarisi (Figs 3, 4) was surprising. From an optimal foraging perspective, it would be interesting to know whether the observed switch in mean speeds between different nights was related to the choice between time-efficient versus cost-efficient modes of foraging. While a cost-cost-efficient forager should fly with Vmr, a time-efficient forager should fly even faster (Ware, 1975; Norberg, 1981; Ydenberg et al., 1994; Hedenström and Alerstam, 1995; Y. Winter, in preparation). Alternatively, the differences in base speeds could be a functional response to differences in assumed predation pressure. While an explanation is currently lacking, this flexibility may illustrate that the choice of flight speed is a behaviourally more complex phenomenon than just the choice between Vmrand Vmp. In this context, the observation that bats that were not foraging, but flying up and down the tunnel without feeding, sometimes flew considerably faster (up to 10.5 m s−1) than when feeding is also important (Fig. 7C).
from) full speed. Here, a Glossophaga bat needed approximately 2 m to accelerate to 4 m s−1 (7 m flight path, Fig. 2) and it reached a speed of 5 m s−1within 5 m of the 33 m flight tunnel with 1 m cross section (Fig. 4A). In addition to length, there was also an effect of width or proximity of flight to the walls. Flight speed in the 42 m tunnel with 1 m cross section was well below flight speed in the 2 m wide 50 m tunnel (Figs 4, 5). A similar effect has been documented for sphingid moths (Stevenson et al., 1995).
The nocturnal bats flew faster under illumination than in darkness. This might be a behavioural response to assumed predation risk. An increase in flight speed is one behavioural option to avoid being caught. Alternatively, visual information may have been necessary for maintaining a straight flight path at higher speed in a narrow flight tunnel. This interpretation is supported by the comparison of flight speeds observed in
Hylonycteris underwoodi with those of other glossophagine
bats (Figs 7A, 9). A speed of 6.4 m s−1, as flown by H.
underwoodi under full illumination, appears to be typical for a
glossophagine bat of this size. Possibly, the narrow confines of the flight tunnel imposed a restriction on flight speed that H.
underwoodi was able to overcome only with the additional
visual input for orientation.
Similarly, the 25 % higher flight speed at the onset of a foraging bout (Fig. 7B) may be regarded as an evolutionarily adaptive response of a bat that, with each foraging bout, sets out into an environment with an uncertain predation risk. Only after it has received information about its environment does it fly more slowly. Alternatively, ‘sloppy regulation’ might be an explanation that would not require an adaptive argument. At the onset of flight, after a period of rest, tissue oxygen and ATP stores (among other factors) are high. A bat may correctly gauge the energy drain caused by flight only after flight metabolism has reached a steady state. An initially higher flight speed could therefore be a non-adaptive or a neutral byproduct of an imprecise regulatory mechanism.
In conclusion, the bats observed during this study demonstrated the clear response of increasing their flight speed during foraging when their body mass increased. Thus, their normal flight speed was not at an upper limit, but instead the bats had reserve muscle power. The magnitude of the increase in speed was similar to the aerodynamic predictions of how an animal should maintain its flight speed at a fixed speed category. However, the variability in the data and the several additional factors that influenced individual flight speed, besides body mass, demonstrated that flight speed regulation overall was more complex, even within the stereotypical behavioural context of this study. At present, we have little idea of the feedback control system for flight speed used by these bats.
I am indebted to Christian Voigt and Marco Tschapka for their valuable cooperation during field work in Costa Rica. Nic Kondratieff helped to develop and build the optical sensor for speed measurements. I thank Raphaël Arlettaz, Marc Holderied and Johannes Thiele for discussing this project. They and Ulla Norberg, John Videler, Colin Pennycuick and
Otto von Helversen provided much-appreciated comments on an earlier draft of this manuscript. I am grateful to Otto von Helversen for maintaining the infrastructure for keeping and breeding glossophagine bats. Funds for this study were provided by the Deutsche Forschungsgemeinschaft (DFG).
References
Begon, M., Townsend, C. R. and Harper, J. L. (1998). Ecology: Individuals, Populations and Communities, 3rd edn. Oxford:
Blackwell.
Berger, M. (1985). Sauerstoffverbrauch von Kolibris (Colibri coruscans und C. thalassinus) beim Horizontalflug. In Biona Report 3. Bird Flight (ed. W. Nachtigall), pp. 307–314. Stuttgart:
Fischer Verlag.
Ellington, C. P. (1991). Limitations on animal flight performance. J. Exp. Biol. 160, 71–91.
Heller, K. G. and von Helversen, O. (1990). Survival of
phaeneropterid bushcricket studied by a new marking technique (Orthoptera, Phaneropteridae). Ent. Gen. 15, 203–208.
Hedenström, A. and Alerstam, T. (1995). Optimal flight speed of
birds. Phil. Trans. R. Soc. Lond. B 348, 471–487.
Hughes, P. M. and Rayner, J. M. V. (1991). Addition of artificial
loads to long-eared bats Plecotus auritus – handicapping flight performance. J. Exp. Biol. 161, 285–298.
Norberg, R. Å. (1981). Optimal flight speed in birds when feeding
young. J. Anim. Ecol. 50, 473–478.
Norberg, U. M. (1995). How a long tail and changes in mass and
wing shape affect the cost for flight in animals. Funct. Ecol. 9, 48–54.
Norberg, U. M., Kunz, T. H., Steffensen, J., Winter, Y. and von Helversen, O. (1993). The cost of hovering and forward flight in
a nectar-feeding bat, Glossophaga soricina, estimated from aerodynamic theory. J. Exp. Biol. 182, 207–227.
Norberg, U. M. and Rayner, J. M. V. (1987). Ecological
morphology and flight in bats (Mammalia: Chiroptera): wing adaptations, flight performance, foraging strategy and echolocation.
Phil. Trans. R. Soc. Lond. 316, 337–419.
Pennycuick, C. J. (1975). Mechanics of flight. In Avian Biology (ed.
D. S. Farner and J. R. King), pp. 1–75. New York: Academic Press.
Pennycuick, C. J. (1989). Bird Flight Performance: A Practical Calculation Manual. Oxford: Oxford University Press.
Pennycuick, C. J. (1997). Actual and ‘optimum’ flight speeds: field
data reassessed. J. Exp. Biol. 200, 2355–2361.
Rayner, J. M. V. (1990). The mechanics of flight and bird migration
performance. In Bird Migration (ed. E. Gwinner), pp. 283–299. Berlin: Springer Verlag.
Sahley, C. T., Horner, M. A. and Fleming, T. H. (1993). Flight
speeds and mechanical power outputs of the nectar-feeding bat,
Leptonycteris curasoae (Phyllostomidae: Glossophaginae). J. Mammal. 74, 594–600.
Stevenson, R. D., Corbo, K., Baca, L. B. and Quang, D. L. (1995).
Cage size and flight speed of the tobacco hawkmoth Manduca
sexta. J. Exp. Biol. 198, 1665–1672.
Tschapka, M. (1998). Coexistence and resource utilization in a
community of nectar-feeding bats (Phyllostomidae: Glossophaginae) in the Atlantic lowland rainforest of Costa Rica (in German). Doctoral thesis, Universität Erlangen.
Unwin, D. M. and Ellington, C. P. (1979). An optical tachometer
for measurement of the wing-beat frequency of free-flying insects.
Videler, J. J., Vossebelt, G., Gnodde, M. and Groenewegen, A.
(1988). Indoor flight experiments with trained kestrels. I. Flight strategies in still air with and without added weight. J. Exp. Biol.
134, 173–183.
Voigt, C. C. and Winter, Y. (1999). Energetic cost of hovering
flight in nectar-feeding bats (Phyllostomidae: Glossophaginae) and its scaling in moths, birds and bats. J. Comp. Physiol. B 169, 38–48.
von Helversen, O. (1993). Adaptations of flowers to the pollination
by glossophagine bats. In Animal–Plant Interactions in Tropical
Environments (ISBN 3-925382-36-4) (ed. W. Barthlott), pp. 41–59.
Bonn: Museum Koenig.
von Helversen, O. and Reyer, H. U. (1984). Nectar intake and
energy expenditure in a flower visiting bat. Oecologia 63, 178–184.
Ware, D. M. (1975). Growth, metabolism and optimal swimming
speed of a pelagic fish. J. Fish. Res. Bd Can. 32, 33–41.
Winter, Y. (1998a). Energetic cost of hovering flight in a
nectar-feeding bat measured with fast-response respirometry. J. Comp.
Physiol. B 168, 434–444.
Winter, Y. (1998b). In vivo measurement of near maximal rates of
nutrient absorption in a mammal. Comp. Biochem. Physiol. 119A, 853–859.
Winter, Y., Voigt, C. and von Helversen, O. (1998). Gas exchange
during hovering flight in a nectar-feeding bat, Glossophaga
soricina. J. Exp. Biol. 201, 237–244.
Winter, Y. and von Helversen, O. (1998). The energy cost of flight:
do small bats fly more cheaply than birds? J. Comp. Physiol. B 168, 105–111.
Ydenberg, R. C., Welham, C. V. J., Schmid-Hempel, R. U. P. and Beauchamp, G. (1994). Time and energy constraints and the
relationships between currencies in foraging theory. Behav. Ecol.


![1′ Methyl 4′,5 diphenyl 5,6,7,8,9,10 hexahydro 1,3 cycloheptapyrimidino[2,3 b]thiazole 2 spiro 3′ pyrrolidine 2′ spiro 3′′ 1H indole 2′′,3(2H,3′′H) dione](data:image/gif;base64,R0lGODlhAQABAIAAAP///wAAACH5BAEAAAAALAAAAAABAAEAAAICRAEAOw==)