With 9 figures ' Printed in Great Britain
INSTANTANEOUS MEASUREMENTS OF OXYGEN
CONSUMPTION DURING PRE-FLIGHT WARM-UP AND
POST-FLIGHT COOLING IN SPHINGID AND
SATURNIID MOTHS
BY GEORGE A. BARTHOLOMEW, DAVID VLECK AND CAROL M. VLECK
Department of Biology, University of California, Los Angeles, CA 90024
(Received 6 May 1980)
SUMMARY
A method for instantaneous measurement of oxygen consumption in an open flow respirometry system is described. During pre-flight warm-up in both sphingids and saturniids, oxygen consumption reaches levels 20 to 70 times resting values. J^o, required to maintain the thorax at flight temperature by intermittent wing-quivering and fluttering is about one-third the maximum Vo% during warm-up. The Q10 of resting J^o, averages 2-4 in both sphingids and saturniids. At any given thoracic temperature,
l?Ot during post flight-cooling exceeds Po, at rest.
Factorial scope (maximum J^orr-resting J^Ot) during warm-up is independent of mass and thoracic temperature. In sphingids it averages 39, in saturniids, 43. Absolute metabolic scope in both groups increases with thoracic temperature and is roughly proportional to VQX. In saturniids about 49 % of the heat produced during warm-up is stored in the thorax; in sphingids the figure is about 73%. The data on metabolic scope, power requirements for flight, Ql0 and body mass are used to develop equations that predict thoracic temperature during flight for both sphingids and saturniids.
INTRODUCTION
Because of its rapidity and the extremely high rates of mass-specific oxygen consumption involved, the pre-flight warm-up of heterothermic moths offers a spectacular example of endothermic control of body temperature. Although it has attracted physiological study intermittently for at least 50 years (see, for example, Dotterweich, 1928), none of the prior studies of this phenomenon or associated events of flight and post-flight cooling, have yielded data on instantaneous rates of oxygen consumption. This lack has impeded analysis of the energetics of the events linked to the rapid changes in body temperature associated with each episode of flight in heterothermic moths.
energy cost of warm-up as computed on the basis of biophysical parameters, (3) verification of measurements of the total oxygen consumption during warm-up, (4) determination of the energy cost of maintaining elevated body temperatures, and (5) estimation of the effects of body temperature on oxygen consumption during cooling. In this study we examine these and related topics.
METHODS
These studies were carried out during July and August 1977 at the Barro Colorado Island Station of the Smithsonian Tropical Research Institute in Panama.
Animals. We captured the moths at night at lights. From time of capture until measurement each moth was stored in a separate paper cup in an air conditioned room at a temperature of 20—23 °C a nd kept under continuous illumination to inhibit activity. All measurements of oxygen consumption were made between 11.00 and 17.00 hours. Two to three hours before measurement, we anaesthetized each moth with CO 2, removed scales from the dorsal surface of the thorax to expose about
2 mm2 of cuticle, punctured the integument with a small hypodermic needle, and inserted a 40 gauge copper-constantan thermocouple to a depth of approximately 2 mm into the flight muscles. Then we transferred the moth into a metabolic chamber and attached its thermocouple to a Bat 8 thermocouple thermometer (Bailey Instruments). The thermocouple was held securely in place by the haemolymph which coagulated around the leads where they pierced the integument. Warm-up was initiated by prodding the moth gently with a pipe cleaner inserted through one of the air inlets in the metabolic chamber.
Oxygen consumption
Oxygen consumption was measured with an Applied Electrochemistry Analyzer equipped with a double-cell sensor (Model N-37M). Measurements during pre-flight warm-up and post-flight cooling were made in an open system. Measurements of resting moths were made in a closed system. In both situations the sample air was dried and the CO2 removed before introducing it into the sensor. Rates of air flow
were measured with flow meters calibrated with a Brooks mass flow meter.
Open system measurements. Depending on its size, the moth was placed in a 550 ml or a 700 ml transparent plastic container lined with mosquito netting to give the animal secure footing (in the case of one large saturniid, a 1400 ml container was used). At one end the container had holes for incoming air and thermocouples, at the other, a fitting to take a Tygon tube for excurrent air. Air flow was controlled by a pump that pulled air successively through animal chamber, CO2 absorbent, drying train,
sensor, and flow meter. Air flow was usually held at 125 cm3/min but lower rates were sometimes used for small moths. Oxygen consumption was determined from the difference between the concentration of oxygen in two similar parallel circuits, one with an animal in it, one without. The system was capable of detecting differences of o-ooi % in oxygen concentration in dry, CO2-free air. Intervals were timed with a
Instantaneous measurements of oxygen consumption. Conventional methods of calculating rate of oxygen consumption (t^oj using an open system assume that Vot is equal to the difference between rates of influx and efflux of oxygen from a meta-bolism chamber (Depocas & Hart, 1957; Hill, 1972; Withers, 1977). This is, of course, true only when the Vot is constant. If the animal in the chamber changes its P^Oii the assumption becomes invalid. Because of the mixing of gases in the chamber, after a change in PQ, the fractional concentration of oxygen (FE) in the excurrent air stream is in a non-steady state and only gradually approaches an equilibrium. Consequently, conventional methods yield accurate estimates of Vot only when Xro% changes very slowly with respect to the washout time of the system.
In the present experiments the metabolic rates of the moths changed continuously and rapidly during pre-flight warm-up and the initial part of post-flight cooling. Therefore, to calculate instantaneous Vo,, it was necessary to develop a method that used the dynamic characteristics of an open flow system. We describe this method in some detail because it is both novel and potentially broadly useful in the study of activity metabolism.
After a change in Po, in an open flow respirometry system, the approach of FE to the new steady state is an exponential function of time, assuming the gas in the chamber is uniformly mixed. The mathematics describing exponential washout are well known. They have been used to calculate the time necessary to approach within a given percentage of the equilibrium value (Christensen, 1947; Heusner, 1955; Lasiewski, Acosta & Bernstein, 1966), but as far as we are aware they have not previously been used to estimate instantaneous Po, except by McLean & Watts (1976) with regard to very large climate control chambers.
To calculate accurately the instantaneous Vot one needs to know not only the measured FB, but also the equilibrium value (FEeq) that would eventually be reached if no further changes in I^ot were to occur. For a given chamber volume and rate of
air flow, the rate of approach to equilibrium is constant regardless of the magnitude of the initial perturbation; that is, at a given time after a change in Vov FE will have changed a constant fraction of the interval to the new equilibrium value. This fraction varies with time (t), flow rate (P) and effective chamber volume (V) according to the equation:
Z = i - c - ^ ' /F, (1)
where Z is the fraction of the interval to the value of the new steady state that is reached in time Af. That is,
]
F
EL
w
Combining equations (1) and (z) and solving for FEe(l yields,
(3)
volume) of the chamber involved (see below). Values of F^eq can then be substituted for FE O, in one of the standard equations used in open flow respirometry to calculate Ao,. The open circuit we employed is functionally the same as a mask system used on larger animals and oxygen consumption can be determined by substituting i^eq for FEot in the following formula (Withers, 1977) and correcting to STP:
where V is the flow of CO2-free dry air in cm3/min, Fjo, is the fractional
concentra-tion of oxygen in incoming air, and FEot is the fractional concentration of oxygen in the excurrent air.
Accuracy of the method. Equation 3 assumes that only a single step change in Vot occurs between successive measurements of FE, which is justified if the time intervals between measurements are short. The accuracy of the calculation is limited chiefly by the uniformity of gas mixing in the chamber, the accuracy with which small changes in FE can be measured over a short time interval, and the precision with which the effective volume (V) of the system is measured. The oxygen analyser we used has the necessary characteristics of accuracy, stability, and rapid response. We tested our procedures by reducing the concentration of oxygen in the respirometry chamber to less than 20% by exhaling into it, then drawing room air through the chamber and measuring FE as it increased toward the value for room air (20-94%). We calculated the effective volume of the system by solving for V in equation (1). Because no animal was in the chamber, actual Vo% during the washout period was zero; calculated instantaneous trot closely approximates zero throughout, while Vo, calculated from measured FE instead of calculated FEe(l, erroneously indicates substantial but declining Vot throughout the experiment (Fig. 1).
Closed system measurements. Oxygen consumption of moths at rest was measured between 11.00 and 17.00 hours with a closed system using a single 02 sensor. The
respirometer chambers were glass jars equipped with wire mesh platforms on which the moths were placed. Thermocouple leads and glass tubes fitted with 2-way valves extended into the respirometer chamber through the rubber stopper used to seal it. A moth with thermocouple implanted was placed on the platform. The respirometer chamber was closed and the outlets connected in series with two other jars, an empty one down stream and a water-filled bubbler upstream.
2 0
1-5
[image:5.451.94.347.55.310.2]120 240 360 480 600
Fig. i. Comparison of calculations of rates of oxygen consumption based on Fg and •/*"«„ while fractional concentration of oxygen in an empty respirometer chamber was increased from ao-o to 20-94 % by drawing room air through the chamber. See text for details.
it at a uniform rate of 175 ml/min through the measuring circuit. Oxygen consumption in the closed system was calculated from the following formula and corrected to STP:
(5)
where V is the volume of dry gas in the respirometer; t is time. Other symbols as in equation (4).
Regressions were fitted by the method of least squares. The significance of the difference between regression lines was tested by analysis of covariance using an F-test and an a value of 0-05. Computations were carried out using the facilities of the UCLA Computing Center.
Identification of specimens were made or confirmed by Julian P. Donahue of the Entomology Section of the Natural History Museum of Los Angeles County where all of the moths are deposited. A list of the species studied appears in Table 4.
RESULTS
Pre-flight warm-up. Under the conditions of measurement, pre-flight warm-up was usually characterized by an explosive increase in rate of oxygen consumption ( ^ o j
»
ccompanied by a rapid rise in thoracic temperature (Tth). When Tt h approached120
100
80
60
40
20
Adeloneamia sp.
(Saturn iidae) Mass = 204 g
<P—7—O
45
40
35 O
S
20 25
30
25
20
Time (min)
Fig. 2. Instantaneous measurements of oxygen consumption and thoracic temperature in saturn moth during pre-flight warm-up and post-flight cooling.
60
50
40
-£ 30
E
*?
20
-10
-/
A *^
T.
A A i 1 4
Manduca /lores tan
(Sphingidae) Mass= l-26g
-i 1 -i -i , , - 40
- 35
30
25
a
3 2
mp
e
10 15
Time (min)
20 25
- 20
30
alighted on the wall of the metabolic chamber, ceased flying, and cooled down (Figs. 2 and 3). Occasionally individuals flew, or attempted to fly, for 15 or 20 min before coming to rest and cooling down (Fig. 4). Rates of heating and cooling were independent of the length of time the animal kept its thoracic temperature elevated.
Depending on the individual and the ambient temperature, the elevation of thoracic temperature during pre-flight warm-up varied from 10 to 18 °C, whereas oxygen consumption increased by 20 to 75 times resting levels (see Aerobic scope). Maximum instantaneous Vot during warm-up scales with approximately the three-quarter power of total body mass; the slopes and intercepts of the regressions for saturniids and sphingids do not differ significantly. In saturniids, the maximum values of Vo, during warm-up are not distinguishable from the rates during hovering flight, but in sphingids Vo, during hovering flight exceeds maximum Vo, during warm-up by more than 60% (Table 1).
Table 1. Coefficients for the allometric equation Y=aXb, relating oxygen consumption under various conditions to body mass in sphingid and saturniid moths
(The symbol b is the slope of the linear regression of the log transformed data; a is the antilog of the Y intercept and represents the magnitude of the parameter for a moth with a mass of 1 o g. JV is sample size; r", the coefficient of determination, specific* the percentage of the vari-bility in log Y that is accounted for by log X.)
Sphingidae Saturniidae Conditions of , * * , * ,
Units
cm'/g. h
c m '
c m '
cm'/g. h
cm'/g. h
measurement Max ir
Ot during warm-up Total frOt during
warm-up Total l^o, during
warm-up* Total I^Oj during
cooling
Po at rest
at22°C*
Vr
Ot during hovering flight*
a
44-55
i 04
1 28
0740
0-42
7228 b
0-757
0718
0004
0-996
0814
0768
N r1 a b N r1
23 070 48-19 0.724 19 0 6 4
28 0-56 1-219 °'954 I 0 °'78
27 0-741 i-oo 0776 28 0-74
26 0-56 0-626 0-519 15 0-58
28 0-79 0351 0674 40 0-68
26 0-83 4467 0593 30 0 7 3
•From Bartholomew & Casey (1978).
The Vo, required to maintain Tth at flight temperatures by intermittent wing quivering and fluttering is about one-third the maximum J^o, during warm-up. For example, the saturniid (Eacles imperialis) shown in Fig. 4 had a maximum Vo, of
100 to n o cm3/h just prior to take-off, but after warm-up, maintained Tth between 39 and 44-0 °C for 15 min with Vot averaging 33 cm3/h.
Q10 of resting Vo,. There is an extensive body of data on resting metabolism in relation to mass of saturniids and sphingids captured from the same Barro Colorado population used in the present study (Bartholomew & Casey, 1978). In order to apply a temperature correction to the allometric data previously obtained we determined the Q10 of Vo, of three saturniids and three sphingids at rest in a closed respirometry system over most of the range of temperatures these animals might experience while at rest under natural conditions. The mean Ql0 for both groups was approximately 2-4 (Table 2).
120
100
Eacles imperialis (Satumiidae) Man = 206 g
10 IS 20 25 30 35 40 Time (min)
Fig. 4. Instantaneous measurements of oxygen consumption during pre-flight warm-up, period of sustained elevated thoracic temperature, and post-flight cooling in a saturn moth.
Table 2. The Q10 of oxygen consumption at rest in some
sphtngid and saturniid moths
Species
Manduca sp.
Manduca sp.
Erimtyis tUo
Mass (g)
1389
1-254
1-072
Sphingidae T
b
( °C)
23-30 3O-37 23-30 3O-37 23-30 30-35
0 1 0 2-32 3'l6 2 3 0 3 O 7 2 1 5 2 4 5
2408 (X) 0392 (S.D.)
Species
Sphingicampa quadrilintata Automeris metzli
Automeris jucunda
Mass (g) 1-791
1234
0249
Satumiidae T (°C)
3O-37
23-30 3O-35 23-30 30-35
0 1 0 2 3 8
2 9 1 1-21 3-42 2 5 1
2-486 (Jf) O-82O (S.D.)
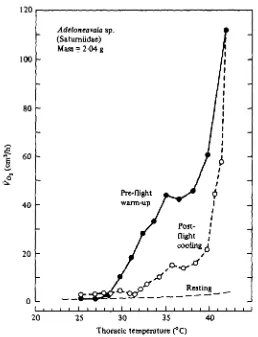
Both Po, and Tth continued to fall until resting levels were again established. Despite the absence of externally visible activity during post-flight cooling and the remarkable temperature independence of energy metabolism observed during pre-flight warm-up, J?o did not immediately return to resting levels. At any given Tth in both sphingids and saturniids, post-flight &o, was always substantially greater than resting Vot (Figs, s & 6).
Aerobic scope, size, and temperature. Absolute metabolic scope for activity, which is defined as the difference between maximum Xrot and resting Po, (Fry, 1947), is useful for comparing the performance of animals of the same size and type. However, because resting metabolism varies with size, and often with taxon, factorial scope, which is maximum I^o.-r resting J^of» is often more helpful in comparing animaj
120
100
80
60
40
20
-0 L I i
Adeloneavaia sp
(Satumiidae) Mass =? 2 0 4 g
20 2S 30 35
[image:9.451.91.349.64.401.2]Thoracic temperature (°C)
Fig. 5. The relation of oxygen consumption to thoracic temperature during pre-flight warm-up, post-flight cooling, and rest in a saturn moth. The pre-flight and post-flight values are instant-aneous measurements. The resting values are calculated using a Qu of 2-4 (Table a) and the allometric equation in Table 1.
The factorial scope of saturniids and sphingids during warm-up is remarkably large, often exceeding 70. We calculated factorial scope by dividing each measurement of Vox during warm-up by resting Po, at the same Tt h. Resting VQ% was calculated from the appropriate equation in Table 1 and corrected to Tt h using the mean Q10 values in Table 2. When measured t^ot was maximal, mean factorial scope for 18 saturniids was 43 (s.D. = 14) and for 22 sphingids it was 39 (S.D. = 15); these values are not significantly different (P > 0-3).
In both saturniids and sphingids, resting metabolism and maximum ^ ot during
warm-up increase with body mass raised to approximately the three-quarter power (Table 1). This indicates (1) that maximum J^o, and absolute scope are roughly proportional to resting Vov and (2) that factorial scope is independent of body mass. When mean factorial scope of each individual moth is regressed on body mass, the ^suiting slope is not significantly different from zero (P > o-8). This is consistent
60
50
40
30
-20 "
10
0 L *
-Manduca florestan
(Sphingidae) - Mass =1-62 g
-/
N
I
Pre-flight warm-up /
Post-flight cooling
A A
\
1
1 1 1 1 1 A a
i i i i
J
Resting _
20 25 30
Thoracic temperature (°C)
35
Fig. 6. The relation of oxygen consumption to thoracic temperature during pre-flight warm-up, post-flight cooling, and rest in a sphinx moth. Values determined as in Fig. 5.
Although absolute scope always increased with Tth during warm-up (Figs. 5 and 6), factorial scope did not. In sphingids as a group, factorial scope was weakly and negatively correlated with Tth when J^o, was maximal:
factorial scope = 138-2-81 Tth (n=22, r2 = o*39).
The slope is significantly different from zero (P < o-oi). A similar regression for saturniids also has a negative slope (—085), but it does not differ significantly from zero (P > 0-3).
Oxygen consumption during warm-up. We estimated total oxygen consumption during warm-up by integrating instantaneous Po, from the start of warm-up to the time of take-off. The regressions on body mass of total oxygen consumption during warm-up calculated from our open respirometry system do not differ significantly (Table 1) in either slope or 1 g intercept from the regressions based on data previously obtained by measurement of total O2 consumption during warm-up in a closed
system (Bartholomew & Casey, 1978).
2
4 0
30
20
10 -1
o
-8
1 1 1 1 1
Sphingidae Saturniidac
Saturniids: energy cost of warm-up
/ = 0-216+ 0-267*
O ^
1 1 1 1 1
l i l 1
Sphingids ^ Energy cost of warm-up
Y° - 0 1 0 8 + 0-276*
Energy stored as heat y = 0-167*
1 1 l 1
6
)
i i
i
i
i
_
-1
80
- 60
40 1
o
10
- 20
12
Fig. y. Storage of heat in the thorax and total heat production during pre-flight warm-up as functions of thoracic mass and change in thoracic temperature. The slopes of the oxygen con-sumption lines are both different from zero (P<o-O5) but the intercepts are not (P>o-os). Energy equivalent of oxygen consumption is assumed to be 20 J/cm1 Ot (RQ o-8).
with the product of total body mass (M) and change in thoracic temperature (A7\h).
Linear regressions yield the following equations :
(saturniids) Vo,= 0-288 + 0-078 AfArth (n = 19, r2 = o-8s),
(sphingids) Vo, = 0-043 + 0-092 M A rt h (n = 28, r2 = o-82),
where Vo, is cm8, M is g, and ATth is °C.
During pre-flight warm-up in moths, most of the heat produced is retained within the thorax, while the abdomen remains at or near ambient temperature (Hanegan & Heath, 1970; Heinrich, 1970; Heinrich & Bartholomew, 1971; Bartholomew & Casey, 1973). Heat storage is therefore equal to the product of thoracic mass, ATth,
and the heat capacity of the thorax (3-3 J/g °C = o-8 cal/g °C). We calculated thoracic mass (Y) of each moth for which we measured Vo, from the total mass (X) using the equations in Bartholomew & Casey (1978):
(saturniids) 7=0-329 AT0-87, (sphingids) 7=0-386 Z0 8 0.
The energy equivalent of oxygen consumption is 20 J/cm3 O2, assuming a respiratory
quotient of o-8. Based on pooled data from the individual moths in our sample during pre-flight warm-up, (Fig. 7), heat storage in saturniids averaged 49% (s.D. = 19) of total heat production, while in sphingids it averaged 73% (S.D. = 27). The two values differ significantly, P < o-ooi.
28 G. A. BARTHOLOMEW, D. VLECK AND CAROL M. VLECK
0 1 0-4
0-2
1 °
00
S - 0 2
-0-4
Body mats (g)
0-4 1 0 4 0
•6? -0-6
- 0 - 8
- 1 0
A Sphingidae O Satumiidae
Y" 0-681 A'0 7 0 2
N = 41 rJ = 0-51
I I I
1-0
0-5 %
I
•a
- 1 0 -0-5 0
Log body mass (g)
0-5
0-2
[image:12.451.66.378.67.382.2]0 1
Fig. 8. Oxygen consumption during post-flight cooling in relation to body size in sphingids and satumiids. See Table i for regressions for members of each family.
correction factor for respiratory evaporation and forced convection. We used their model to predict total Vo, during warm-up from our measurements of thoracic temperature and body mass, and from thermal conductances calculated from allo-metric equations presented by Bartholomew & Epting (1975 a, b). Measured Fo, averaged 38% greater than that predicted from the model. The differences between the predicted values and the measured values obtained in the present study result from heat transferred from thorax to abdomen and head, from forced convection due to wing fluttering, and perhaps from the mechanical work associated with wing-whirring during warm-up, all of which were ignored in the model.
Oxygen consumption during cooling. As mentioned above, at a given body temperature ?Oi during cooling is substantially greater than Po, at rest. We determined total oxygen consumption during cooling by integrating the area under the curve of &ot versus time during post-flight cooling until Tt h was within 1 °C of its level prior to
warm-up. V^o, at this time was not significantly different from that before warm-up began (P > 0-05; paired f-test). As one would expect, energy expended during cooling increases with body mass (Fig. 8 and Table 1). The regression of J?ot duri
29
120
20 24 28 32 36 40 Thoracic temperature (°C)
[image:13.451.104.340.67.327.2]44
Fig. 9. A model of the relation between thoracic temperature, rate of oxygen consumption in flight, maximum rate of oxygen consumption during warm-up and flight temperature in a sphinx moth. In this model the moth was assigned a mass of i-sz6g which yielded a VOl during
flight of 100 cm'/h (Table 1). Resting metabolism was calculated using the appropriate equation from Table 1 and a Q10 of 24 (Table 2). Maximum Vo t was calculated by multiplying
resting Pnt by the mean scope (39-0) for sphingids. See text for details, equations, and
dis-cussion.
8aturniids, but the differences are not significant. For both groups the energy expended during cooling is a surprisingly large fraction of that spent during warm-up. The amount of oxygen consumed during cooling as a percentage of that consumed during pre-flight warm-up averages 78% (s.D. = 44) in sphingids and 69% (s.D. = 51) in saturniids.
DISCUSSION
Sphingids and saturniids differ conspicuously in both behaviour and morphology. Sphinx moths are adapted for high-velocity flight and have highly streamlined bodies, high aspect ratios, and heavy wing loading. They feed on flower nectar while hovering and have relatively long post-larval lives. Saturn moths as a group are relatively slow fliers with low aspect ratios and light wing loading. They do not feed as adults and consequently depend on energy stores laid down in the larvae to support the energy costs of endothermy and flight which presumably serves mainly for locating members of the opposite sex and for finding proper sites for egg laying. During warm-up most ngids whirr their wings rapidly while most saturniids quiver their wings almost imperceptibly. Despite these differences, the two groups are surprisingly similar
allometrically in those aspects of the energetics of flight and endothermy which have been measured.
Oxygen debt. If the oxygen consumption of a resting animal is higher after a period of intense activity than it was before the period of activity, the animal is said to have acquired an oxygen debt. By this definition, both sphingids and saturniids demonstrate an oxygen debt during post flight cooling, particularly during the first half of the process (Figs. 5, 6). A similar elevation of post-flight metabolism has previously been reported in the sphinx moth, Metopsilus procellus (Zebe, 1954) and the locust, Schistocerca gregaria (Krogh & Weis-Fogh, 1951). At present, one can only speculate on the physiological basis for the elevated £"ot of motionless, cooling moths. The
rapidity of the decline in thoracic temperature immediately after the cessation of flight (Bartholomew & Epting, 1975 a, b) suggests the presence of facilitated cooling, presumably by means of circulation of haemolymph to the abdomen (Heinrich 1970; Heinrich & Bartholomew, 1971). However, the magnitude of the elevation of Po, during the early stages of cooling reported here is far greater than one can reasonably assign to the increase in rate of pulsation of the dorsal vessel in accelerating the exchange of haemolymph between thorax and abdomen. It seems unlikely that any strong flying animal would build up an oxygen debt during prolonged steady flight. However, under the conditions of measurement, post-flight cooling began only a few seconds, or at most a few minutes, after pre-flight warm-up. It is possible that the ' oxygen debt' we observed is related to processing of anaerobic metabolites produced during warm-up or the first few seconds of flight. However, no data on this point are presently available for heterothermic moths.
[image:14.451.53.412.544.610.2]Energy cost of warm-up and cooling. For a moth the energy cost of an episode of endothermy involves not only the energy required for warm-up and for flight, but also the energy expenditure during the interval in which it cools from flight tempera-ture to ambient temperatempera-ture. Despite the relatively low rates of oxygen consumption during cooling (Figs. 5, 6), the energy expended during cooling is a substantial fraction (70-80%) of that during warm-up, because of the time required for the process (Figs. 2, 3). However, for a 1 g moth, the combined costs of warm-up and cooling do not exceed those incurred during only a minute or two of flight. (Table 3) The energy expended during heating and cooling should be of negligible importance to sphingids, which replenished their fuel supply by feeding, but it could be ecologi-cally significant to saturniids which do not feed, if they warmed and cooled many times.
Table 3. Oxygen consumption of pre-flight warm-up and post-flight cooling compared to oxygen consumption during hovering flight in a sphingid and a saturniid
with a mass of i-og
Period of flight equivalent toKOt
Warm-up and Vot for 60 8 of warm-up and
Vo warm-up Vo cooling cooling flight cooling (cm1) (cm1) (cm1) (cm1) (s)
Sphingid 1-04 0-74 178 1-20 88 Saturniid i-aa 0-63 1-85 0 7 4 149
rapidly as does the power required to fly (Table 1), we conclude that power require-ments are not likely to place the upper limits on body size of saturniids or sphingids.
Both sphingid and saturniid moths must have high thoracic temperatures to initiate flight. Under field conditions, Tth during flight is independent of body mass in both families of moths (Bartholomew & Heinrich, 1973). Our measurements provide an explanation for these observations. The Tt h required for flight is
independent of body mass because (1) factorial scope is independent of body mass, and (2) resting Pot and the power input required for take-off (i.e. Po, during hovering
flight) scale similarly with mass. Before a moth can take off, it must warm up until its metabolic rate, which is the product of factorial scope and resting Po,, is at least equal to flight X?ot- For sphingids at 22 °C, resting Fo, = o-42 M°i 8 M (Table 1). The Q1Q of resting metabolism averages 2-41 (Table 2). Therefore at other thoracic
temperatures, 2"th-22
resting tro, = o-^z M°-81* (2-41)-""
Factorial scope in sphingids averages 39, and flight Po, = 72*28 M0"768 (Table 1). Consequently flight becomes possible when:
(39) (0-42 M°-81i) (2-41) 10 =72-28 M0-798.
Assuming that the exponents of mass in the equations for resting and flight metabolism are not significantly different, mass cancels out of the equation. Consequently, the
Table 4. Species and mass (g) of moths measured in present study
Saturniidae Sphingidae Species Automeritjucunda A.jucunda A.jucunda A.jucunda A. metsli A. mttxli A. zugana A. zurobara A. xurobara Dirpkia nr. agit Eaclei imperialit E. imperialii E. imperialit Hyperchiria nautica Sphingicampa quadrilineata S. quadrilineata S. quadrilineata Syttpkinx molina Adeloneavaiajaton Adeloneavaia tp. Rothtchildea erycina R.erycina Mass o-3°5 0-335 0195 0249 1-131 1-234 0-835 041S 1.094 0-360 2061 1-651 3-494 0 3 1 8 0-980 1-383 1-791 3-993 0-763 2 0 4 3 O-539 O-359 Species Enyoocypete E.ocyptte E.ocyptte Erimtyii ello E. ello E. ello E.ello E. ello E.ello EumoTpha anchemola E.anchemola
minimum Tth required for flight in sphingids is a constant approximately equal ftr 38-9 °C (Fig. 9). A similar computation for saturniids yields a thoracic temperature for take-off of 33 9 °C. These calculated take-off temperatures do not differ signi-ficantly from the mean flight temperatures of 38-5 °C for sphingids and 33-5 °C for saturniids measured in the field by Bartholomew & Heinrich (1973).
Students of vertebrate physiology have long been aware of the correlation between high absolute scope for aerobic activity and high resting metabolic rate. In hetero-thermic moths, factorial scope does not increase with Tth, but warm-up is necessary to achieve the high absolute scope necessary for flight. Our data support the hypo-thesis that a high resting metabolic rate is necessary for a high absolute scope, but not for high factorial scope.
This study was supported in part by grants from the U.S. National Science Foun-dation (DEB 75-14045; DEB 78-03174).
REFERENCES
BARTHOLOMEW, G. A. & CASEY, T. M. (1973). Effects of ambient temperature on warm-up in the moth
Hyalophora cecropia.J. exp. Biol. 58, 503-507.
BARTHOLOMEW, G. A. & CASEY, T. M. (1978). Oxygen consumption of moths during rest, pre-flight warm-up, and flight in relation to body size and wing morphology. J. exp. Biol. 76, 11-25.
BARTHOLOMEW, G. A. & EPTING, R. J. (1975 a). Rates of post-flight cooling in sphinx moths. In
Perspec-tives of Biophysical Ecology (ed. D. M. Gates and R. B. Schmerl), pp. 405-415. New York:
Springer-Verlag.
BARTHOLOMEW, G. A. & EPTING, R. J. (19756). Allometry of post-flight cooling rates in moths: a comparison with vertebrate homeotherms. J. exp. Biol. 63, 603-613.
BARTHOLOMEW, G. A. & HEINRICH, B. (1973). A field study of flight temperatures in moths in relation to body weight and wing loading. J. exp. Biol. 58, 123—135.
CHRISTENSEN, B. G. (1947). A simple apparatus for simultaneous measurement of the standard meta-bolism and the respiratory quotient in small laboratory animals, supplemented with investigations on normal and hypophysectomized rats. Acta physiol. scand. 13, 11-26.
DEPOCAS, F. & HART, J. S. (1957). Use of the Pauling oxygen analyzer for measurement of oxygen consumption of animals in open-circuit systems and in short lag, closed-circuit apparatus. J. appl.
Physiol. TO, 388-392.
DOTTERWEICH, H. (1928). Beitrage zilr Nervenphysiologie der Inseckten. Zool. J. Abt. Physiol. 44,
399-45O-FRY, F. E. J. (1947). Effects of the environment on animal activity. Publs. Ont. Fish. Research, Lab. no. 68, pp. 1-62.
HANEGAN, J. L. & HEATH, J. E. (1970). Mechanisms for control of body temperature in the moth
Hyalophora cecropia.J. exp. Biol. 53, 349-362.
HEINRICH, B. (1970). Thoracic temperature stabilization by blood circulation in a free-flying moth.
Science, N. Y. 168, 580-582.
HEINRICH, B. & BATHOLOMEW, G. A. (1971). An analyses of pre-flight warm-up in the sphinx moth,
Manduca sexta. J. exp. Biol. 55, 223-239.
HEUSNER, A. (1955). Technique de mesure de courte duree de la consommation d'oxygene et de l'activite du Rat. Etude critique du circuit de Benedict. C. r. SCanc. Soc. Biol., Paris 149, 2254—2257. HILL, R. W. (1972). Determination of oxygen consumption by use of the paramagnetic oxygen analyzer.
J. appl. Physiol. 33, 261-263.
KROGH, A. & WEIS-FOGH, T. 1(1951). The respiratory exchange of the desert locust (Schistocerca
gregaria) before, during and after flight. J. exp. Biol. 28, 344—357.
LASIEWSKI, R. C , ACOSTA, A. L. & BERNSTEIN, M. (1966). Evaporative water loss in birds. I. Character-istics of the open flow method of determination, and their relation to estimates of thermoregulatory ability. Comp. Biochem. Physiol. 19, 445-457.
MCLEAN, J. A. & WATTS, P. R. (1976). Analytical refinements in animal calorimetry. J. appl. Physiol. 40,827-831.
WITHERS, P. C. (1977). Measurement of V<3t, ^COj, and evaporative water loss with a flow-through
mask..7. appl. Physiol. 4a, 120-123.