Changes in temperature affect the rates of all biochemical reactions, including synaptic activation and release, the activation and inactivation of ionic channels in membranes, and the conduction velocity of action potentials. Interacting neuronal and synaptic processes usually have similar temperature sensitivities, so that comparable changes occur in their rates of activation or inactivation as the temperature varies. For instance, the activation and inactivation rate constants of the different ionic conductances in the squid giant axon all have similar Q10values that are approximately equal to 3 (Hodgkin and Katz, 1949; Hodgkin and Huxley, 1952; Moore, 1958). As a result, changes in temperature induce changes in the scale of the action potential, but have only a slight effect upon its waveform; an action potential at 6 °C approximates to a slower version of the action potential at 20 °C. Conversely, if functionally linked neuronal processes have dissimilar Q10 values, there will be a tendency for changes in temperature to produce more major discontinuities in system output.
It would appear that this latter situation characterises the synaptic relationship between neurones involved in the escape tailflip of the crayfish. This behaviour is driven by two sets of giant ‘command’ neurones, the lateral giant (LG) and the medial giant (MG), which excite overlapping sets of abdominal motor giant (MoG) flexor motoneurones. The excitation from the LG and MG to the MoG is mediated in each hemisegment by a powerful rectifying electrical synapse called the giant motor synapse (GMS; Furshpan and Potter, 1959). The GMS has a relatively low (but non-zero) conductance when the postsynaptic MoG is iso-potential with, or depolarised relative to, the presynaptic neurones, but becomes highly conductive when LG or MG is depolarised relative to MoG (Furshpan and Potter, 1959; Jaslove and Brink, 1986; Giaume et al. 1987; Edwards, 1990a,b). Voltage-clamp studies have shown that the rate of these voltage-dependent changes in junctional conductance is very dependent on temperature (Jaslove and Brink, 1986). At 19 °C, the increase in junctional conductance JEB1233
The effects of temperature on transmission through the voltage-sensitive giant motor synapse (GMS) were investigated in crayfish both experimentally and in computer simulation. The GMS is part of the fast reflex escape pathway of the crayfish and mediates activation from the lateral giant (LG) command neurone to the motor giant (MoG) flexor motoneurone. The investigation was motivated by an apparent mismatch between the temperature sensitivity of the activation time constant of the GMS, with a Q10reported to be close to 11, and that of
the active membrane properties of LG and MoG, which are thought to have Q10values close to 3. Our initial hypothesis
was that at cold temperatures the very slow activation of the GMS conductance would reduce the effectiveness of transmission compared with higher temperatures. However, the reverse was found to be the case. Effective transmission through the GMS was reliable at low temperatures, but failed at an upper temperature limit that varied between 12 °C and 25 °C in isolated nerve cord
preparations. The upper limit was extended above 30 °C in semi-intact preparations where the GMS was less disturbed by dissection. The results of experiments and simulations both indicate that transmission becomes more reliable at low temperatures because the longer-duration presynaptic spikes are able to drive more current through the GMS into the MoG, which is more excitable at low temperatures. Conversely, effective transmission is difficult at high temperatures because the transfer of charge through the GMS is reduced and because the input resistance of MoG is lowered as its current threshold is increased. The effect of the high Q10of the GMS activation
is to help preserve effective transmission through the synapse at high temperatures and so extend the temperature range for effective operation of the escape circuit.
Key words: lateral giant, motor giant, rectifying electrical synapse, crayfish, Procambarus clarkii, Pacifastacus leniusculus.
Summary
Introduction
EFFECT OF TEMPERATURE ON A VOLTAGE-SENSITIVE ELECTRICAL SYNAPSE
IN CRAYFISH
WILLIAM J. HEITLER1 ANDDONALD H. EDWARDS2
1Department of Biology, Gatty Marine Laboratory, University of St Andrews, St Andrews, Fife KY16 8LB, Scotland
and 2Department of Biology, Georgia State University, Atlanta, GA 30302-4010, USA
*e-mail: [email protected]
induced by a 50 mV step depolarisation of the presynaptic cell followed a single exponential with a time constant of 0.4 ms, and the fall in conductance after presynaptic repolarisation followed the same time course. This time constant increased to 7 ms at 9.4 °C, suggesting that the conductance change followed a first-order reaction with a Q10of 11 (Jaslove and Brink, 1986). The Q10values of the ionic mechanisms that support an LG, MG or MoG spike are not known. If they were like those of the squid giant axon and approximately equal to 3, the difference between this and the synaptic Q10of 11 suggested to us that a functional mismatch might occur at low temperatures where the rectifying conductance would change very slowly relative to the duration of the presynaptic action potential. Calculation indicates that the rectifying synapse time constant, τrect, would change from 0.4 ms at room temperature to 21 ms at 5 °C, whereas the duration of the action potential might only increase by a factor of 3. This led us to suppose that the synapse might fail to transmit effectively at low temperature because the GMS would respond too slowly for the presynaptic spike to initiate a significant increase in conductance. This would limit the depolarising synaptic current injected into the MoG through the synapse and cause the MoG to fail to be excited at low temperatures. At high temperatures, however, the synaptic time constant would shorten so much that GMS conductance would become effectively an instantaneous function of junctional voltage, and so the depolarisation of the presynaptic spike would propagate rapidly and effectively to the postsynaptic neurone. This notion fits with casual observation of crayfish behaviour: crayfish become sluggish and eventually paralysed as the temperature drops.
We tested the suggestion that the GMS response would fail in the cold and be reliable at higher temperatures by testing the effects of temperature on the LG spike and on transmission between the LG and MoG. We also used the available quantitative descriptions of the GMS and the LG and MoG neurones to develop a mathematical model of the LG–GMS–MoG circuit that we used to analyse the effects of temperature on the GMS. Contrary to our expectation, both the model and the experiments indicated that the high synaptic Q10 preserves effective synaptic transmission at low temperatures and extends it to a higher range of temperatures than would otherwise be reached.
Materials and methods Experimental procedures
Adult crayfish (Procambarus clarkii and Pacifastacus leniusculus) were obtained from commercial suppliers and maintained at 18 °C for at least 2 weeks before the animals were used. No differences in experimental results were observed for these two species.
Isolated nerve cord preparations
The animal was chilled in ice for 10 min or until it had ceased voluntary movements, after which the abdomen was removed and the head was destroyed. The abdominal ventral
nerve cord was cut away from the abdomen and pinned out in a dish lined with Sylgard (Dow-Corning), and then covered with saline (Van Harreveld, 1936). The sheaths around the connective between the fifth (G5) and last (G6) ganglion, around the third nerve root (N3) of G2 and around the connective between G1 and G2 were removed. A stimulating electrode was placed on the LG axon in the connective between G5 and G6, and bipolar extracellular recording electrodes were placed on the LG axon in the connective between G1 and G2. Intracellular recording electrodes were placed in the LG axon in G2 and in the ipsilateral MoG at the base of N3 of G2, just postsynaptic to LG (Fig. 1). The temperature of the preparation
I
GMS Lateral giant
MoG
Record MoG post (21) Record LG pre (11)
(20)
(25) (37)
(50) 200µm Stimulus (1)
LG (Pre)
MoG (Post)
G1/G2
Distal N3 and fast flexor muscle Proximal third nerve Stimulus
G5/G6
GMS (G2) A
[image:2.609.316.551.235.555.2]B
was measured either by a calibrated thermistor or by a mercury thermometer placed immediately adjacent to the preparation. The preparation dish itself was secured on top of narrow pillars within a larger water bath, so that the sides and most of the bottom surface of the dish were exposed to the bath. The temperature of the preparation was adjusted by changing the temperature of the surrounding water bath. The preparation was allowed 1 min to equilibrate following a change in temperature, and then tested.
Isolated abdomen preparations
The abdomen was removed from the animal, and the cuticular ribs, soft cuticle and superficial (slow) flexor muscle were cut away ventrally to reveal the nerve cord and fast flexor (FF) muscles. The preparation was pinned out in a Petri dish lined with Sylgard and immersed in crayfish saline. A bipolar stimulating electrode was placed on the cord adjacent to one LG axon in the connective between G5 and G6 (Fig. 1A). Bipolar recording electrodes were placed adjacent to LG in the ipsilateral connective between G1 and G2, on the proximal portion of the ipsilateral N3 of G3, and more distally on the lateral and medial branches of that nerve. The distal third nerve electrodes were also in contact with the FF muscle innervated by N3.
Computer modelling
Procedure for creating multicompartment models
A multicompartment model of a length of the LG axon, the GMS and the postsynaptic region of the MoG was created from a series of linked short cable segments, each of which represented a corresponding section of neurite. The model contained three parts: a series of identical short cable segments that represented a portion of the LG axon, a branching cable structure that represented the postsynaptic and proximal axonal portions of MoG, and a rectifying electrical connection between the middle portion of the LG cable and the MoG model that represented the giant motor synapse (GMS) (Fig. 1B). The 19 short LG cable segments together represented a section of axon that was 4000µm long and 100µm in diameter (Fig. 1B). The 19 short cable segments became 20 compartments in the multicompartment model,
where each compartment represents an intersegmental node and half of each segment adjoining that node. Thirty compartments represented the MoG, including the postsynaptic region, and the initial segment of the axon including the first major branch (Fig. 1B). The electrical load of the multiple distal axon branches on the proximal portion of the MoG axon is represented in the model by a gradual increase in the lengths and diameters of the distal short cable segments of both major branches.
Passive properties of the model
The (leakage) resistance and capacitance were calculated for each compartment as the ratio and product, respectively, of the specific membrane resistance (Rm) and specific membrane capacitance (Cm) to the membrane area of the neuronal segment represented by the compartment. Cmwas assumed to equal 1µF cm−2. R
m=τm/Cm, where τm is the measured membrane time constant (Edwards, 1990a). Resistances for the LG and MoG compartments are given in Table 1.
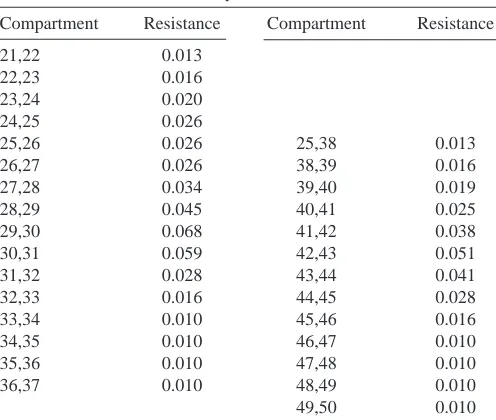
The coupling resistance that links adjacent compartments is given by the product of the cytoplasmic resistivity and the segment length, divided by the cross-sectional area. Coupling resistances for both models are given in Table 2 for 10 °C.
Spiking compartments
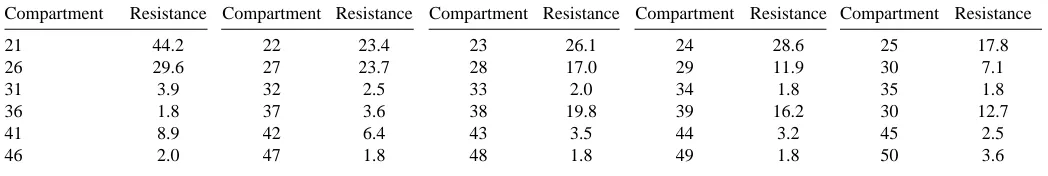
[image:3.609.46.570.87.175.2]Because published descriptions of active membrane currents in the crayfish giant fibres and MoG are quite similar to those of squid (Shrager, 1974; Bean, 1981; Wallin, 1966), the Hodgkin–Huxley equations were used to describe the active membrane properties of both LG and MoG compartmental models (Hodgkin and Huxley, 1952). The ionic equilibrium potentials in the Hodgkin–Huxley equations were modified to cause the action potentials of both models to have a depolarising afterpotential and to cause the resting potential of the LG model to be approximately 10–15 mV more negative than that of the MoG model (Heitler et al. 1991). All other aspects of the Hodgkin–Huxley equations were unchanged. The equilibrium potentials were all set to values relative to an initial condition of zero resting potential for all model compartments. For the LG model, the equilibrium potentials (E) were ENa=115 mV, EK=−14 mV and EL=−16 mV; for Table 1. Compartmental resistances of MoG compartments
Compartment Resistance Compartment Resistance Compartment Resistance Compartment Resistance Compartment Resistance
21 44.2 22 23.4 23 26.1 24 28.6 25 17.8
26 29.6 27 23.7 28 17.0 29 11.9 30 7.1
31 3.9 32 2.5 33 2.0 34 1.8 35 1.8
36 1.8 37 3.6 38 19.8 39 16.2 30 12.7
41 8.9 42 6.4 43 3.5 44 3.2 45 2.5
46 2.0 47 1.8 48 1.8 49 1.8 50 3.6
Each compartment of the model corresponds to one of the numbered nodes of Fig. 1B.
The compartmental resistances (in MΩ) of the LG compartments are: Compartments 1 and 20: 66.8 MΩ; compartments 2–19: 33.4 MΩ. The table should be read left-to-right in row sequence.
MoG, they were ENa=115 mV, EK=−2 mV and EL=−4 mV, where EL is the effective equilibrium potential for the combined leakage channels.
The ionic conductances of each compartment vary according to the membrane area that the compartment represents. The maximal ionic conductances were equal to the product of the membrane areas and the maximal ionic conductance densities (in µS cm−2) specified in the Hodgkin–Huxley equations.
The giant motor synapse
The trans-synaptic conductance, Gj, of the GMS is represented by the equation:
Gj= Gmin+ (Gmax−Gmin)/{1 + exp[−A(Vpre−Vpost−Vo)]} , (1)
(Giaume et al. 1987), where A is 0.15 mV−1, V
ois 5 mV, Gmax is 6.67µS and Gmin is 0.67µS. Gminis the minimum (shut) synaptic conductance, Gmax is the maximum (fully open) synaptic conductance, and Vo is the trans-synaptic potential (Vpre−Vpost) at which the trans-synaptic conductance is half-way between Gmax and Gmin. These values enable the model to replicate the current/voltage (I/V) characteristics of the GMS measured at 18 °C by Jaslove and Brink (1986).
Temperature sensitivity of model parameters
The equilibrium potentials vary with temperature according to the Nernst equation. The chosen values (above) were assumed to occur at a temperature of 10 °C. Values at other temperatures were calculated from these values by first
calculating the concentration ratio that corresponds to each of these equilibrium potentials at 10 °C. These concentration ratios were assumed to be independent of temperature, so that they could be used to calculate equilibrium potentials at other temperatures according to the Nernst equation for each ion. The temperature-dependence of the equilibrium potentials in simulation produced similar small changes in resting potential in the two neurones. We did not note any obvious experimental divergence from this outcome, although we did not examine this issue in detail.
The temperature-dependence of the ionic membrane conductances is assumed to be similar to that of squid. The maximum conductances are governed by a Q10of 1.4 (Moore, 1958), and the rate constants of those conductances are assumed to have a Q10of 3 (Hodgkin and Huxley, 1952). The specific membrane conductance (=1/Rm) is also governed by a Q10of 1.4, whereas the membrane capacitance has a Q10of 1.1 (Palti and Adelman, 1969) and the cytoplasmic conductivity has a Q10of 1.3 (Guttman, 1970).
The rectification properties of the GMS are enhanced at elevated temperatures and reduced at cold temperatures (Jaslove and Brink, 1986). This temperature sensitivity can be simulated by equation 1 if Gmaxis given a Q10of 1.1 and Gmin is given a Q10 of 1.2. The temperature-dependence of the kinetics of the GMS have also been described by Jaslove and Brink (1986), who found that the junctional conductance changed with a time constant equal to 7.5 ms at 9.4 °C and had a Q10 of approximately 11 between 9 and 20 °C. The time constant was too short to measure at temperatures greater than 20 °C. Consequently, changes in Gjare described in the model as following first-order kinetics with a time constant, τrect(in ms), that is described by the equation:
τrect = 7.5/{11[(T−9.4)/10]} , (2) where T is temperature (in °C) over the temperature range from 5 to 34 °C. We assume that the Q10 is constant over this temperature range, although it has only been measured explicitly over the range 9–20 °C.
Numerical method
The coupled differential equations that describe compartmental voltage and current flow in the model were solved numerically using a fifth-order Runge–Kutta integration procedure with variable time steps (Forsythe et al. 1977).
Initiation of a presynaptic spike
[image:4.609.42.290.94.304.2]The first 15 ms of each simulation established a calculated resting potential for all compartments. At that time, a 1500 nA, 0.15 ms current pulse was injected into an end-compartment of the LG axon (Fig. 1). The spike triggered by the pulse then spread along the chain of LG compartments to the presynaptic LG compartment, which was linked to the postsynaptic compartment of MoG by the model GMS. If sufficient current was driven into MoG, the spike excited there would conduct distally along the MoG axon. The LG spike continued beyond the presynaptic compartment to the terminal LG compartment. Table 2. Coupling resistances between MoG model
compartments
Compartment Resistance Compartment Resistance
21,22 0.013
22,23 0.016
23,24 0.020
24,25 0.026
25,26 0.026 25,38 0.013
26,27 0.026 38,39 0.016
27,28 0.034 39,40 0.019
28,29 0.045 40,41 0.025
29,30 0.068 41,42 0.038
30,31 0.059 42,43 0.051
31,32 0.028 43,44 0.041
32,33 0.016 44,45 0.028
33,34 0.010 45,46 0.016
34,35 0.010 46,47 0.010
35,36 0.010 47,48 0.010
36,37 0.010 48,49 0.010
49,50 0.010
Each compartment of the model corresponds to one of the numbered nodes of Fig. 1B.
The coupling resistances (in MΩ) between LG model compartments (compartments 1,2 to compartments 19,20) are 0.025 MΩ.
Results
Temperature sensitivity of GMS transmission
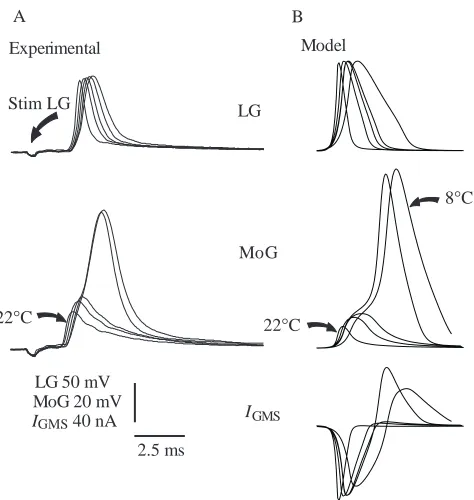
Our initial experiments were performed on isolated nerve cord preparations, where it was possible to record intracellular responses on either side of the GMS. Unexpectedly, we found that GMS transmission was reliable at low temperatures (>5 °C), but failed at temperatures above a threshold value that varied with the preparation between 12 °C and 25 °C. Results from a preparation in which transmission failed at a low value, 13 °C, are shown in Fig. 2A. LG was stimulated caudal to the GMS and its spike was recorded intracellularly rostral to the GMS (Fig. 1A). Effective transmission occurred at 8 °C as a 98 mV LG spike with a half-width of 1.3 ms evoked a spike in MoG with a half-width of 1.8 ms. At 12 °C, the LG spike
amplitude was unchanged but the half-width fell to 1.05 ms, and the half-width of the MoG spike dropped to 1.5 ms. At 13.5 °C, the half-width of the LG spike was reduced to 0.95 ms, and the excitatory postsynaptic potential (EPSP) evoked in MoG failed to excite a spike. The LG spike half-width continued to fall along with the EPSP amplitude in MoG as the temperature was increased. At 22 °C, the LG spike was reduced to 90.8 mV and the half-width was 0.55 ms, while the MoG EPSP was only 19.6 mV.
[image:5.609.54.291.258.508.2]The model of the GMS connection between LG and MoG displayed the same behaviour as the preparation shown in Fig. 2A over the same temperature range if the maximal GMS conductance (Gmax, equation 1) was reduced from 6.67 to 0.8µS. When the model parameters were set for 8 °C, the LG spike was 120 mV in amplitude and lasted 1.6 ms at half-maximum amplitude (Fig. 2B, top panel). The spike evoked in the postsynaptic MoG compartment was 100 mV in amplitude and lasted 1.5 ms (Fig. 2B, middle panel). The current through the synapse flowed orthodromically until the potential across the synapse reversed itself, when it flowed antidromically (Fig. 2B, bottom panel; the significance of this is discussed below). Effective transmission persisted at 10 and 12 °C, but failed at 13.5 °C as the LG spike duration shortened to 0.95 ms and evoked a 20 mV EPSP in MoG. As in the experimental preparations, an increase in temperature to 22 °C caused a further reduction in both the LG spike duration and the MoG EPSP amplitude.
Failure of effective LG-to-MoG transmission at high temperature could be reversed by depolarising current injected into MoG. This is apparent in Fig. 3, which shows another preparation in which LG successfully initiated a spike in MoG at 14 °C, but failed to initiate a spike in MoG at 20 °C. However, when MoG was depolarised by 3 nA of injected current at 20 °C, MoG fired in response to an LG spike. The model behaved similarly when Gmaxwas set equal to 1.9µS, the model temperature was set to 14 °C, and an LG spike was excited and evoked a superthreshold response in MoG. The LG spike failed to evoke a spike in MoG when the model temperature was increased to 20 °C, but succeeded when 3 nA was injected into the postsynaptic MoG compartment during the response to LG (Fig. 3B).
GMS transmission was reliable at low temperatures and failed at higher temperatures varying between 12 and 25 °C in seven isolated nerve cord preparations. In three preparations, no MoG spike could be elicited, although the subthreshold EPSP showed the same temperature response as that described above. No preparations were found in which GMS transmission was successful at high temperature but failed at low temperature. The model of the GMS connection displayed the same qualitative behaviour, i.e. reliability at low temperatures and propensity to failure at higher temperatures, but in order to replicate the quantitative behaviour it was consistently necessary to reduce the value of Gmaxin equation 1 below that previously reported (Jaslove and Brink, 1986).
Gmaxcorresponds to the combined effects of all rectifying gap junctions, so that variations in the effective value of Gmaxmay
Stim LG LG
MoG
8°C
22°C
2.5 ms MoG 20 mV LG 50 mV
IGMS 40 nA
22°C
Experimental Model
IGMS
A B
reflect a corresponding variation in the number of available gap junctions in the GMS. The dissection, removal of the nerve cord and ganglionic desheathing necessary for the intracellular procedures all subject the preparation to mechanical strain which may reduce this number. We therefore performed similar experiments using isolated abdomen preparations in which the nerve cord and motor nerves were left in place, and the LG axon, MoG axon and GMS were undisturbed. In five such preparations, extracellular recordings again revealed that GMS transmission was robust at low temperatures while liable to failure at high temperatures, but in these cases failure never occurred at temperatures below 28 °C and sometimes transmission persisted at temperatures as high as 34–35 °C (Fig. 4).
Factors affecting GMS transmission and MoG excitability from 5 to 30 °C
The experiments on both the isolated nerve cords and the semi-intact preparations revealed that, contrary to our initial expectation, effective transmission at the GMS becomes more difficult at higher temperatures and easier at lower
temperatures. Possible reasons for this include the effect of temperature on charge transfer through the GMS and on the input resistance and excitability of MoG.
14°C
20°C
20°C Stim LG
+3 nA
40 mV 5 ms
MoG
dIPSP
+3 nA 20°C
20°C 14°C
[image:6.609.315.540.369.739.2]A B Experimental Model Fig. 3. Depolarising current injected into
MoG can restore transmission from the LG at warm temperature in experiment and simulation. (A) MoG responses to an LG spike recorded from an isolated nerve cord at 14 °C (upper trace), when transmission was successful, and at 20 °C, when it failed, revealing a subthreshold EPSP (lower trace). Transmission was restored at 20 °C when +3 nA was injected into MoG postsynaptically during the response to LG (bottom trace). A depolarising inhibitory postsynaptic potential (dIPSP) in MoG follows the LG activation in each trace. (B) Simulation of the experiment in A, in which Gmax was set to 1.9µS, and MoG compartment responses were calculated at 14 and 20 °C. As in the experiment, transmission was restored by 3 nA of
current injected into the postsynaptic MoG compartment. The depolarising IPSPs were omitted from the simulation. The abbreviations are explained in the legend to Fig. 1.
4
10.6
15
20
25
28.7
29.5
32
33
35
Stimulate proximal N3 35
31
25 Temperature
(°C)
Distal N3, FF muscle G1/G2
10 ms
LG MoG
FF EMG
Charge transfer through the GMS
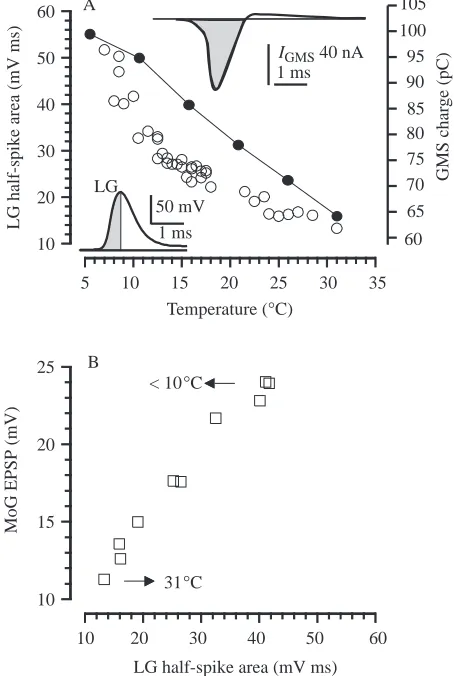
Although we could not measure charge transfer through the GMS experimentally, we could measure the area under the rising phase of the presynaptic (LG) spike, which provides an approximate measure of charge transfer. The driving force for synaptic current is proportional to the difference in membrane potential between pre-and postsynaptic neurones, and this is greatest during the rising phase of the presynaptic spike. The synaptic charge injected into the MoG is roughly proportional to the area under the rising phase of the LG spike (lower left inset, Fig. 5A). Increased temperature reduced both the amplitude and the duration of the presynaptic spike and, consequently, the area under the rising phase of the spike as well. The presynaptic spike amplitude decreased by less than 20 % between 6 and 30 °C, and the area under the rising phase of the spike decreased by nearly 80 % over the same temperature range (Fig. 5A, open circles and left ordinate).
Simulations with the model make it possible to calculate the total charge transferred into the MoG model by a presynaptic spike as a function of temperature (Fig. 5A, filled circles and right ordinate). The depolarising charge transfer was calculated from the time integral of the negative-going wave of the GMS current (upper right inset, Fig. 5A) in a series of simulations in which Gmax in equation 1 was maintained at its published value of 6.67µS. These calculations indicate that the total charge transferred in the model decreased by 35 % as the temperature was increased from 5 to 30 °C. The current into the MoG compartment only ceases (and reverses) when the postsynaptic and presynaptic potentials are equal, which occurs on the falling phase of the LG spike. Accordingly, the rising phase of the LG spike is likely to underestimate the period during which charge flows from LG to MoG, but may also be overly sensitive to temperature.
Despite these differences, these results make clear that reductions in both the synaptic charge and the EPSP amplitude, which should reflect the accumulation of postsynaptic charge, should follow an increase in temperature. This prediction is supported by the nearly linear relationship between MoG EPSP amplitude and the area under the rising phase of the presynaptic spike waveform (Fig. 5B). The EPSP amplitude fell by nearly 60 % between 10 and 31 °C as the half-area of the LG spike fell by more than two-thirds. This decline in the EPSP amplitude with increasing temperatures should account in part for the failure to excite the MoG at higher temperatures.
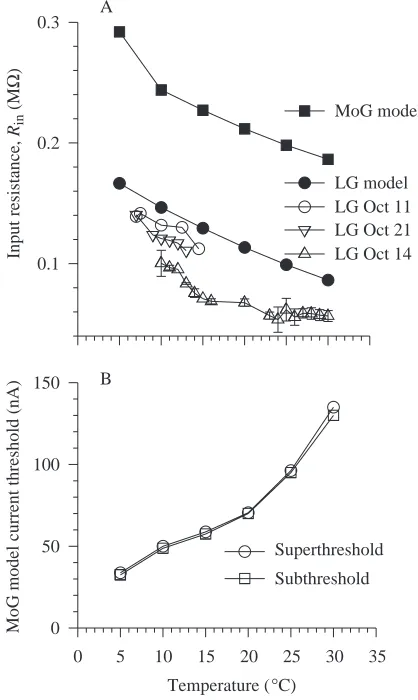
Factors affecting the temperature sensitivity of MoG excitability: input resistance
Another factor that could contribute to the reduction in effective transmission at higher temperatures is a reduction in the input resistance of MoG with increased temperature. Such a reduction is expected because both the specific membrane resistance and the cytoplasmic resistivity have been found in other neurones to decrease with increasing temperature (Guttman, 1970). We were unable to obtain input resistance measurements from MoG over the experimental temperature range owing to difficulty in maintaining dual microelectrode
impalements while changing temperature. However, we were able to measure input resistances and voltage responses to injected current steps in LG. Two-electrode measurements of input resistance over the temperature range 5–30 °C showed that the input resistance of the LG neurone was higher at low temperatures and lower at high temperatures (Fig. 6A). This temperature-dependence of LG was replicated in the model, which also showed the input resistance of MoG to have a similar dependence (Fig. 6A). The temperature-dependence of the input resistances of both model neurones results from the factors cited above (see Materials and methods), which have been incorporated into the model. The
1 ms 50 mV LG
5 10 15 20 25 30 35 Temperature (°C)
10 20 30 40 50 60
LG half-spike area
(mV ms)
10 20 30 40 50 60
LG half-spike area (mV ms) 10
15 20 25
MoG
EPSP
(mV)
< 10°C
31°C A
B
60 65 70 75 80 85 90 100 95 105
GMS char
ge
(pC)
1 ms
[image:7.609.332.559.76.414.2]IGMS 40 nA
model cytoplasmic conductivity, which governs the coupling conductance between model compartments, was given a Q10 of 1.3 and the specific membrane conductance, which governs the compartmental (leakage) conductance, was given a Q10of 1.4 to reflect experimentally measured values (Guttman, 1970).
Factors affecting the temperature sensitivity of MoG excitability: current threshold
Another factor that governs successful transmission through the GMS is the current threshold of the MoG. Although it was not possible to measure this over the temperature range, simulations with the model indicate that the current threshold of MoG should increase more than fourfold between 5 and 30 °C (Fig. 6B).
Significance of the Q10of the GMS to synaptic function
Successful transmission depends on Gmax and on
temperature: for a given value of Gmax, transmission failed above a certain temperature and was successful below that temperature (Figs 2, 3). These results suggested that the minimal value of Gmaxneeded for successful transmission in the model could be found at each temperature through repeated simulations; a plot of these values would help determine how changes in temperature would affect transmission at a synapse with a fixed Gmax. One such plot is shown in Fig. 7, where the Q10of the synaptic time constant was set to the published value of 11 (open symbols), and another is shown where it was set to 3 (filled symbols). From these plots, it is apparent that, when
Gmaxequals the published value of 6.67µS (Jaslove and Brink, 1986), the high Q10provides a considerable safety factor for transmission at all temperatures between 13 and 30 °C, whereas the low Q10allows transmission to fail above 25 °C.
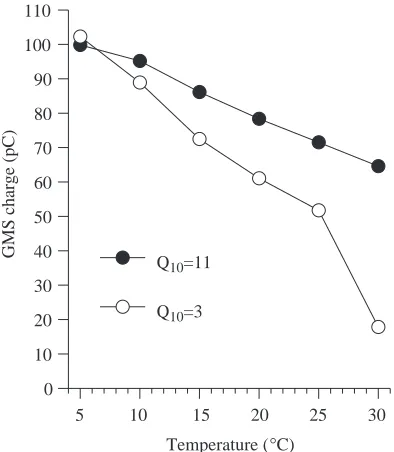
Part of the reason why the higher Q10 promotes more effective transmission at high temperatures is that it enables a presynaptic spike to drive more charge through the GMS than it would if the GMS conductance had a lower Q10. This is apparent in Fig. 8, which shows plots of the GMS charge
versus temperature for both high and low values of Q10. At all temperatures above approximately 10 °C, more charge is driven through the synapse in the high-Q10model than in the low-Q10 model. At temperatures below 10 °C, the reverse is true but, as shown in Fig. 7, at temperatures below approximately 13 °C, the threshold value of Gmaxfalls below the value of Gmin, 0.67µS. This means that at low temperatures the time constant of the voltage-dependency of the GMS becomes irrelevant; the synapse can transmit effectively even in its low-conductance (nominal ‘off’) state.
0.1 0.2 0.3
Temperature (°C)
0 5 10 15 20 25 30 35
0 50 100 150
A
B
Subthreshold Superthreshold
MoG model
LG model LG Oct 11
LG Oct 14 LG Oct 21
MoG model current threshold (nA)
Input resistance,
Rin
(M
Ω
[image:8.609.58.267.74.424.2])
Fig. 6. The effect of temperature on the input resistance and current threshold of MoG. (A) The input resistance of the MoG model, the LG model and three different LG neurones measured over temperatures from 5 to 30 °C. (B) Plot of the current threshold of the MoG model against temperature, as indicated by the lowest levels of injected current that excited MoG (circles) and the highest levels of injected current that failed to excite MoG (squares). The abbreviations are explained in the legend to Fig. 1.
Temperature (°C)
12 14 16 18 20 22 24 26 28 30 32 0
2 4 6 8 10
Superthreshold, Q10=11 Subthreshold, Q10=11 Superthreshold, Q10=3
Subthreshold, Q10=3
GMS threshold conductance
(
µ
S)
[image:8.609.325.531.446.646.2]Effect of temperature on LG-to-SG transmission
A secondary disynaptic pathway for fast flexor motorneurone (FFMN) activation by the LG is mediated via the segmental giant (SG) neurone (Kramer et al. 1981; Roberts et al. 1982). The SG receives input from the LG through rectifying electrical synapses with properties very similar to those mediating the LG-to-MoG connection (Heitler et al. 1991) and makes output to the FFMNs, again through rectifying electrical synapses, although these synapses are less powerful than the LG-to-MoG and LG-to-SG synapses (Miller et al. 1985; Heitler and Darrig, 1986). The LG-to-SG-to-FFMN pathway provides a slower alternative to the LG-to-MoG pathway for exciting the FF muscle. The LG-to-SG synapse displayed a sensitivity to temperature similar to that of the GMS (Fig. 9). The latency of the SG spike recorded extracellularly following stimulation of the LG shortened as the temperature was increased from 21 °C, until the spike itself failed at 29 °C. It continued to fail as the temperature was raised to 31 °C and lowered back to 26 °C, at which temperature it reappeared.
Discussion
The primary question of this research was why the activation time constant for the voltage-sensitive synapse had such a high Q10, especially relative to that of the Q10 values for action potential generation in the pre- and postsynaptic neurones. The initial idea was that the extreme slowing of the synapse at low temperature consequent on the high Q10might lead to failure of transmission and, hence, be in part responsible for the
perceived sluggishness of the animals at low temperature. However, contrary to our initial expectation, transmission at the crayfish voltage-sensitive electrical synapses is reliable at low temperature, but prone to failure at high temperature. Clearly, the explanation for the behavioural response to temperature lies elsewhere, perhaps with the chemical component of the primary afferent input to the system.
Intracellular recordings showed stable transmission down to approximately 6 °C (which was the lowest temperature we were able to achieve with our apparatus while recording intracellularly), whereas extracellular recording showed reliable 1:1 transmission at less than 3 °C. In contrast, spike transmission across the synapse failed at high temperatures, at lower values for isolated nerve cord preparations and at higher
Temperature (°C)
5 10 15 20 25 30
GMS charge
(pC)
0 10 20 30 40 50 60 70 80 90 100 110
Q10=11
[image:9.609.72.269.74.300.2]Q10=3
Fig. 8. The effect of differences in the GMS Q10on transmission in the model. The amount of charge injected by a presynaptic LG spike into the postsynaptic MoG compartment was calculated between 5 and 30 °C when the GMS time constant was characterised by a Q10 equal to 11 (filled circles) and equal to 3 (open circles). The abbreviations are explained in the legend to Fig. 1.
3 ms Stim LG
N1 SG
21°C
31°C
[image:9.609.329.557.78.452.2]21°C
values for more intact preparations. This was true for both the LG-to-MoG and the LG-to-SG synapses. The LG-to-MoG synapse is the classic ‘type specimen’ of rectifying electrical synapses (Furshpan and Potter, 1959), and the more recently discovered LG-to-SG rectifying electrical synapse (Kramer et
al. 1981; Roberts et al. 1982) has similar voltage-dependency
(Heitler et al. 1991). This unexpected result provokes two further questions: first, why is transmission less effective at high temperatures and more effective at low temperatures and, second, what role does the elevated Q10 play in this rather counter-intuitive temperature sensitivity?
The pattern of temperature sensitivity of the GMS
Part of the reason for the temperature sensitivity of the GMS appears to be the major effect that changes in temperature have upon the duration of the LG spike and, hence, on the ability of the LG to inject positive charge into the postsynaptic MoG. The model indicates that charge transfer through the GMS increases nearly linearly with decreasing temperatures. Our results show that at low temperatures sufficient charge is injected to elicit a postsynaptic spike, despite the relatively slow increase in junctional conductance that occurs at these temperatures. Indeed, the model suggests that at low temperature there is almost no increase in junctional conductance during a spike (i.e. the synapse ceases to act like a rectifier and remains in a low-conductance state throughout), but that the increased duration of the LG spike is sufficient to maintain a high driving force for long enough to overcome the high synaptic resistance. Conversely, at high temperatures, the shortened duration of the presynaptic spike reduces the charge transfer through the synapse despite the rapid increase in synaptic conductance.
A second factor that contributes to the greater effectiveness of transmission at low temperatures is the higher input resistance of the postsynaptic cell. The model shows that, at 5 °C, synaptic current encounters a postsynaptic input resistance that is 50 % greater than that at 30 °C. Together with the increased transfer of charge, the higher input resistance accounts for the larger EPSPs recorded at lower temperatures. The higher input resistance helps reduce the current threshold of the model MoG, so that the model cell fires readily in response to the larger EPSPs. In contrast, at high temperatures, the input resistance of the model MoG is reduced and the input capacitance is increased; both of these changes will reduce the voltage response of the cell to the synaptic current. Finally, the current threshold of the model MoG is also increased at higher temperatures, so that more synaptic current is required to excite the cell.
The exact temperature at which GMS transmission failed varied between preparations, but it was invariably higher in preparations in which the degree of dissection was minimised. When the nerve cord was exposed in situ in the isolated abdomen, complete failure at the LG-to-MoG synapse was not observed at temperatures below 28 °C. However, when the nerve cord was dissected free from the animal for intracellular recording, failure could occur at room temperature. It appears
likely that manipulations associated with freeing the nerve cord from the crayfish abdomen may disturb the GMS, so that the gap junctions are no longer able to achieve the high level of synaptic conductance that normally occurs during transmission in the intact abdomen. The simulations demonstrate that a lowered maximal junctional conductance can cause transmission failure to occur at lower than normal temperatures. In the model system using the published value of Gmax, transmission never failed even at elevated temperatures; there is a safety factor of approximately 2 at 30 °C. This may mean that even our minimally dissected preparations had suffered some loss of gap junction function. However, a more likely explanation is the existence of in vivo variation in key model parameters such as
Gmax. Furthermore, in the model, the kinetic parameters of the spikes are based on standard Hodgkin–Huxley formulations, rather than the (unknown) values appropriate for the LG and MoG. This means that, while the model reliably reflects the overall response of the real system to temperature, it would be unwise to draw precise quantitative conclusions from the model about factors such as threshold.
The synaptic Q10of 11
Our use of equation 2, with its Q10 of 11, to describe the temperature kinetics of the GMS over the range from 5 to 34 °C, is an extrapolation from measurements made between 9 and 20 °C (Jaslove and Brink, 1986). The extrapolation appears justified by the ability of the model to sustain effective transmission over the full temperature range at which we found the GMS could operate in minimally disturbed preparations.
The value of 11 for the GMS Q10is much higher than values of Q10for synapses and active membrane conductances, which vary between 2 and 5 (Adams, 1989; Burrows, 1989; Byerly
et al. 1984; Hodgkin and Katz, 1949; Katz and Miledi, 1965;
This work was supported in part by grants from the BBSRC (UK) to W.J.H. and the NIH (US; RO1 NS26457) to D.H.E.
References
ADAMS, B. A. (1989). Temperature and synaptic efficacy in frog skeletal muscle. J. Physiol., Lond. 408, 443–455.
BEAN, B. P. (1981). Sodium channel inactivation in the crayfish giant axon: Must channels open before inactivating? Biophys. J. 35, 595–614.
BURROWS, M. (1989). Effects of temperature on a central synapse between identified motor neurons in the locust. J. comp. Physiol. A 165, 687–695.
BYERLY, L., CHASE, P. B. ANDSTIMERS, J. R. (1984). Calcium current activation kinetics in neurones of the snail Lymnaea stagnalis. J. Physiol., Lond. 348, 187–207.
EDWARDS, D. H. (1990a). Mechanisms of depolarizing inhibition at the crayfish giant motor synapse. I. Electrophysiology. J. Neurophysiol. 64, 532–540.
EDWARDS, D. H. (1990b). Mechanisms of depolarising inhibition at the crayfish giant motor synapse. II. Quantitative reconstruction. J. Neurophysiol. 64, 541–550.
FORSYTHE, G. E., MALCOLM, M. A. AND MOLER, C. B. (1977). Computer Methods for Mathematical Computations. Englewood Cliffs, NJ: Prentice-Hall. 259pp.
FURSHPAN, E. J. ANDPOTTER, D. D. (1959). Transmission at the giant motor synapses of the crayfish. J. Physiol., Lond. 145, 289–325. GIAUME, C., KADO, R. T. AND KORN, H. (1987). Voltage-clamp
analysis of a crayfish rectifying synapse. J. Physiol., Lond. 386, 91–112.
GUTTMAN, R. (1970). The effect of temperature on the function of excitable membranes. In Biophysics and Physiology of Excitable Membranes (ed. W. J. Adelman, Jr), pp. 320–336. New York: Van Nostrand Reinhold, Co.
HEITLER, W. J. ANDDARRIG, S. (1986). The segmental giant neurone of the signal crayfish and its interactions with abdominal fast flexor and swimmeret motor neurones. J. exp. Biol. 121, 55–75. HEITLER, W. J., FRASER, K. ANDEDWARDS, D. H. (1991). Different
types of rectification at electrical synapses made by a single
crayfish neurone investigated experimentally and by computer simulation J. comp. Physiol. A 169, 707–718.
HODGKIN, A. L. ANDHUXLEY, A. F. (1952). A quantitative description of membrane current and its application to conduction and excitation in nerves. J. Physiol., Lond. 117, 500–544.
HODGKIN, A. L. ANDKATZ, B. (1949). The effect of temperature on the electrical activity of the giant axon of squid. J. Physiol., Lond.
109, 240–249.
JASLOVE, S. W. AND BRINK, P. R. (1986). The mechanism of rectification at the electrotonic motor giant synapse of the crayfish. Nature 323, 63–65.
KATZ, B. ANDMILEDI, R. (1965). The effect of temperature on the synaptic delay at the neuromuscular junction. J. Physiol., Lond.
131, 656–670.
KIMURA, J. E. ANDMEVES, H. (1979). The effect of temperature on the asymmetrical charge movement in squid giant axons. J. Physiol., Lond. 289, 479–500.
KRAMER, A. P., KRASNE, F. B. ANDWINE, J. J. (1981). Interneurons between giant axons and motoneurons in crayfish escape circuitry. J. Neurophysiol. 45, 550–573.
MILLER, L. A., HAGIWARA, G. AND WINE, J. J. (1985). Segmental differences in pathways between crayfish giant axons and fast flexor motoneurons. J. Neurophysiol. 53, 252–265.
MOORE, J. M. (1958). Temperature and drug effects on squid axon membrane ion conductances. Fedn Proc. Fedn Am. Socs exp. Biol.
17, 113.
PALTI, Y. AND ADELMAN, W. J. (1969). Measurement of axonal membrane conductances and capacity by means of a varying potential control voltage clamp. J. Membr. Biol. 1, 431–458. ROBERTS, A., KRASNE, F. B., HAGIWARA, G., WINE, J. J. ANDKRAMER,
A. P. (1982). Segmental giant: evidence for a driver neuron interposed between command and motor neurons in the crayfish escape system. J. Neurophysiol. 47, 761–781.
SHRAGER, P. (1974). Ionic conductance changes in voltage clamped crayfish axons at low pH. J. gen. Physiol. 64, 666–690.
VANHARREVELD, A. (1936). A physiological solution for fresh water crustaceans. Proc. Soc. exp. Biol. Med. 34, 428–432.