The ability to sustain power output is of fundamental importance to the locomotor performance of many animals. Muscle fatigue is the primary limitation on this endurance, but serves as a protective measure to prevent metabolic crisis and injury (Grassino and Clanton, 1993; Sargeant, 1994). During prolonged, fatiguing locomotion in humans, muscular fatigue results in a reduction in stride frequency and stride length and, inherently, horizontal velocity decreases (Mero et al. 1988; Nummela et al. 1992).
Most in vitro studies of fatigue have been carried out under isometric conditions (Cady et al. 1989a,b; Lännergren and Westerblad, 1991), leading to the widely used definition of fatigue: ‘the reduction in force generating capacity that results from prolonged activity’ (Fitts, 1994). Following such contraction protocols, a number of mechanical effects have been observed to occur as fatigue develops. These are as follows: a depression of the force-generating capacity of the muscle (Cady et al. 1989b; Lännergren and Westerblad, 1991); a prolongation of relaxation (Cady et al. 1989a; Westerblad and Lännergren, 1991); a change in the force–velocity properties, i.e. reduced maximum velocity of shortening and flattening of the force–velocity curve (Edman and Mattiazzi, 1981; de Haan et al. 1989; Curtin and Edman, 1994; Barclay, 1996); a reduced initial mechanical efficiency (Barclay, 1996); and a reduction in the maximum instantaneous power output, estimated from the force–velocity relationship (de Haan et al. 1989; Curtin and Edman, 1994; Barclay, 1996). Diminished mechanical performance has been correlated with substrate
depletion and end product accumulation in many studies (for a review, see Fitts, 1994). Another distinguishing feature of fatigue is its reversibility following a period of recovery (Stevens and Syme, 1989).
Many muscles function to maintain cyclic contractions and to generate power (Josephson, 1985). From in vitro studies of fatigue, it can be hypothesized that impaired force generation, changes in force–velocity characteristics and slowing of relaxation will reduce muscle power output during repeated cyclical contractions. However, the precise effects of fatigue during cyclical contractions are difficult to model because of the interaction between the different mechanical components of fatigue. Fatigue under conditions where muscle performs work during cyclical contractions has been investigated using toad sartorius muscle (Stevens and Syme, 1989) and rat diaphragm (Stevens and Syme, 1993). The importance of such studies has been clearly demonstrated: for example, net work was found to be negative, even though the fatigued toad sartorius muscle was still able to generate 35 % of peak isometric force (Stevens and Syme, 1989). The effects of cycle frequency on the decline in power output revealed that, for rat diaphragm, the rate of decline in net power output was greater at higher cycle frequencies (Stevens and Syme, 1993). However, this latter study was limited to a small range of cycle frequencies (1–4 Hz) compared with the range over which power can be generated by this muscle (over 8 Hz; Syme and Stevens, 1989). No study to date has investigated the effects of cycle frequency on the development of fatigue over a range JEB1162
The function of many muscles requires that they perform work. Fatigue of mouse soleus muscle was studied in vitro by subjecting it to repeated work loop cycles. Fatigue resulted in a reduction in force, a slowing of relaxation and in changes in the force–velocity properties of the muscle (indicated by changes in work loop shape). These effects interacted to reduce the positive work and to increase the negative work performed by the muscle, producing a decline in net work. Power output was sustained for longer and more cumulative work was performed with decreasing
cycle frequency. However, absolute power output was highest at 5 Hz (the cycle frequency for maximum power output) until power fell below 20 % of peak power. As cycle frequency increased, slowing of relaxation had greater effects in reducing the positive work and increasing the negative work performed by the muscle, compared with lower cycle frequencies.
Key words: muscle mechanics, power output, fatigue, mouse.
Summary
Introduction
FATIGUE OF MOUSE SOLEUS MUSCLE, USING THE WORK LOOP TECHNIQUE
GRAHAM N. ASKEW*, IAIN S. YOUNG ANDJOHN D. ALTRINGHAM
Department of Biology, University of Leeds, Leeds LS2 9JT, UK
Accepted 21 August 1997
of cycle frequencies both above and below that at which power output is maximal.
In the present study, we subjected mouse soleus muscles in
vitro to repeated work loop cycles to induce fatigue. This
regime was chosen to simulate the conditions under which many muscles are believed to operate. The aims were to investigate the effects of cycle frequency on the development of fatigue during sustained activity. A range of cycle frequencies (1–10 Hz) was studied to cover the range of stride frequencies found to occur during locomotion (2–8 Hz; James
et al. 1995) and to include frequencies both below and above
that yielding the maximum power output. At each cycle frequency, conditions were standardized by optimizing for maximum power output. The effects of fatigue on net power output and work loop shape were examined.
Materials and methods
Female LACA white mice (mass 26.2±0.4 g, mean ±S.E.M.,
N=30) were killed by cervical dislocation. The soleus muscle
was dissected out from each of the hind limbs as quickly as possible in frequently changed, oxygenated Ringer’s solution at room temperature (19–22 °C) (Ringer composition in mmol l−1: NaCl, 144; sodium pyruvate, 10; KCl, 6; MgCl
2, 1;
NaH2PO4, 1; MgSO4, 1; Hepes, 10; CaCl2, 2; pH 7.4 at room
temperature buffered by the addition of Trizma base: after Daut and Elzinga, 1989). Small pieces of bone were left attached to the tendons to facilitate clamping to the apparatus. Small aluminium foil clips were used to clamp each of the tendons as close to the muscle as possible without damaging the fibres. Following dissection, one of the muscles was transferred to a flow-through experimental chamber and attached to a force transducer (AME 801, SensoNor, Horten, Norway) at one end and to a servomotor at the other. Ringer’s solution, saturated with 100 % oxygen, was heated via a water bath and circulated using a peristaltic pump to maintain a temperature of 37±0.5 °C in the experimental chamber. The muscle was allowed 30 min to thermoequilibrate and to recover from the dissection. The remaining muscle was pinned out, at approximately resting length, in oxygenated Ringer’s solution. In cases where both soleus muscles from a single animal were used, data from only one muscle were included in the calculation of the mean isometric stress for all the animals.
Supramaximal stimuli of 1 ms duration were delivered via parallel platinum electrodes which ran along the full length of the muscle to ensure uniform activation. With the muscle held isometrically, a series of twitches was used to determine the muscle length that yielded the greatest twitch force: this length was defined as L0. A train of stimuli was delivered to elicit a
tetanic contraction, and the frequency that yielded the maximum tetanic force was used in the subsequent experiment (typically 130 Hz).
The muscle was then subjected to cycles of oscillatory work using the work loop technique (Josephson, 1985). Sinusoidal strains, symmetrical about L0, were used. Prior to a fatigue run,
the maximum power output of the muscle was determined as
a control to monitor any decline in muscle performance. A cycle frequency of 5 Hz was used for the control loops, this frequency having been found in a previous study to yield the maximum power output for mouse soleus muscle (James et al. 1995). The strain imposed on the muscle, the number of stimuli and the timing of stimulation were adjusted to give the maximum power output.
Fatigue runs were carried out over a range of cycle frequencies from 1 to 10 Hz. Only one run was carried out per preparation in an attempt to ensure that metabolite levels were the same at the start of each fatigue run. The strain, number of stimuli and phase of stimulation were determined that gave the maximum power output at the cycle frequency selected for the fatigue run. A fatigue run consisted of subjecting the muscle to repeated cycles of oscillatory work until the net power output fell below zero (up to a maximum of 300 loops). Following this treatment, the muscle was allowed to recover for 30 min before the power output was measured over a series of four control loops. Muscle power output was monitored as a function of time and cumulative work (the sum of the net work performed in each cycle). At the end of the experiment, the tendons were removed, and excess Ringer’s solution was removed by blotting the muscle with filter paper. The wet mass of the muscle was then determined using an electronic balance. This mass was used in the calculation of the muscle’s isometric stress and in normalizing muscle power output.
All results are expressed as means ± standard error about the mean (S.E.M.). The number of replicates (N) is shown in parentheses.
Results
Mechanical properties
The mean isometric stress for mouse soleus was 212±5.1 kN m−2 (N=30). A peak power output of
33.2±2.68 W kg−1(N=5) was obtained at a cycle frequency of
5 Hz. The relationship between maximum power output and cycle frequency is shown in Fig. 1. Thirty minutes following a fatigue run, power output under the control conditions recovered to 81.4±2.1 % (N=6) of the prefatigue value.
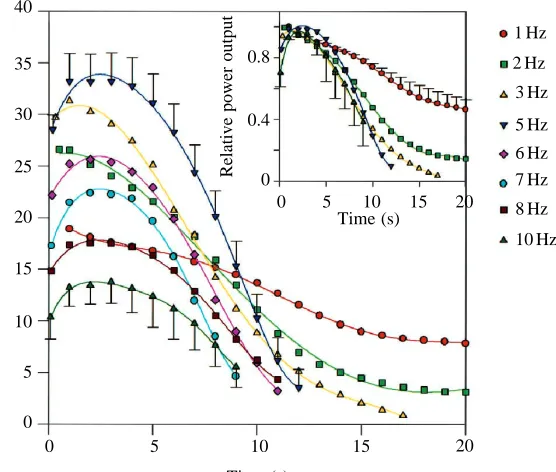
Fatigue induced by repeated work loop cycles Peak power output was achieved in the first 3 s of cycling (Fig. 2). At low cycle frequencies (1 and 2 Hz), peak power output was achieved in the first or second loop, but at higher cycle frequencies, many more loops were performed before peak power output was achieved, e.g. approximately 30 loops at 10 Hz. At all cycle frequencies studied, power output decreased monotonically from the peak over the remaining cycles (Figs 2, 3).
The time taken for power output to decline to a given level (e.g. to 50 % of peak power) was dependent on cycle frequency (Fig. 2). At lower cycle frequencies, net positive power could be sustained for much longer than at higher frequencies.
(Fig. 3). However, a higher absolute power output was maintained at 5 Hz (the cycle frequency for maximum power output) until power fell below 20 % of peak power (Fig. 3).
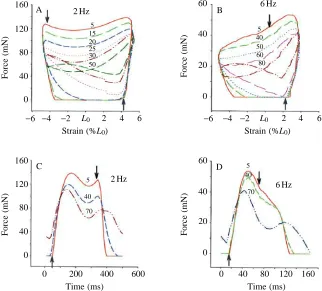
In an unfatigued work loop (loop 5 in Fig. 4A,B), force starts to rise towards the end of lengthening, reaching a peak around maximum muscle length. Assuming that the muscle remains active throughout shortening, the force declines to a minimum when the muscle passes through L0 (shortening
velocity is maximal), but then increases as the muscle approaches its minimum length (shortening velocity decreases
to zero). Whether or not the muscle remains active throughout shortening is dependent on cycle frequency. At high cycle frequencies, stimulation ends whilst the muscle is still at lengths greater than L0 and, as a result, force continues to
decline throughout shortening (compare work loop shapes at different cycle frequencies in Fig. 4 and see James et al. 1995). Force is negligible throughout most of the lengthening period.
The changes in work loop shapes brought about by fatigue are shown in representative loops at 2 and 6 Hz in Fig. 4A,B. The same features were observed at other cycle frequencies. As the muscle fatigued, the force that could be generated throughout shortening was lower than on preceding work loops. As fatigue developed, force declined more rapidly over the first part of shortening. The muscle failed to relax completely during shortening, resulting in force being produced during lengthening and a subsequent increase in the work required to re-lengthen the muscle. This incomplete relaxation resulted in a rise in the base-line force (2 Hz, loops 25 onwards; 6 Hz, loops 60 onwards; Fig. 4A,B). These changes are also reflected in the changing shapes of the force–time plots (Fig. 4C,D).
Discussion
Prefatigue mechanical properties of mouse soleus muscle
The mean isometric stress produced in these experiments (212±5.1 kN m−2; N=30) was similar to stresses obtained in
other studies at a similar temperature (35 °C) (e.g. Luff, 1981; James et al. 1995). Soleus muscle produced a maximum power output of 33.2±2.68 W kg−1(N=5) at a cycle frequency of 5 Hz,
which is very close to the maximum mean power output of 34 W kg−1at 5 Hz obtained by James et al. (1995) at 35 °C.
30
20
10
0 40
Power output (W
kg
−
1)
2
0 4 6 8 10
[image:3.609.75.283.71.277.2]Cycle frequency (Hz)
Fig. 1. Power–cycle frequency relationship for mouse soleus muscle at 37 °C prior to fatigue. The maximum power output was 33.2±2.68 W kg−1(N=5) at a cycle frequency of 5 Hz. Data represent means ±S.E.M. (N=5).
40
35
0 5 10 15 20 25 30
Power output (W
kg
−
1)
0.8
0 0.4
Relative power output
5 10 15 20
0
Time (s)
0 5 10 15 20
Time (s)
1 Hz
2 Hz
3 Hz
5 Hz
6 Hz 7 Hz
8 Hz
10 Hz
[image:3.609.282.560.490.726.2]Fatigue under work loop conditions
All the changes induced by the fatigue runs were reversible, and the muscle could recover almost to the original, prefatigue conditions.
The rate of decline of power output as the muscle fatigued increased with increasing cycle frequency, i.e. power is maintained for longer, and more cumulative work is performed at lower cycle frequencies. Stevens and Syme (1993) also
found that, with fatigue of rat diaphragm, the rate of decline of net power was greatest at the highest cycle frequency studied. Power output is the rate of performing work, work being the product of force and distance moved. Cycle frequency and the strain imposed on the muscle were kept constant throughout the experiment, so any change in power output must be related to a change in force.
The decline in the muscle’s ability to generate force during
40
10
0 20 30
Power output (W
kg
−
1)
0.8
0 0.4
Relative power output
50 100 150 200 250 300 350 400 450 0
Cumulative work (J kg−1)
0 100 200 300 400 Cumulative work (J kg−1)
[image:4.609.262.560.71.317.2]1 Hz 2 Hz 3 Hz 5 Hz 6 Hz 7 Hz 8 Hz 10 Hz
Fig. 3. Change in power output of mouse soleus muscle with cumulative work performed. Values are means (N=4). Lines are third-order polynomials fitted using least-squares regressions. Standard error bars have only been shown for 1 and 10 Hz for clarity (5 and 10 Hz in the inset). The inset shows the same data normalized to the maximum power output at each cycle frequency. Note that, for clarity, not all of the data have been plotted.
C D
A
120
0 40 80 160
Force (mN)
120
0 40 80 160
Force (mN)
40
20
0 60
Force (mN)
0 200 400 600
Time (ms)
0 40 80 120 160 Time (ms)
6 Hz 2 Hz
−6 −4 −2 L0 2 4 6
Strain (%L0) 2 Hz
5 15 20 25 30 50
70
70 40
5 40
5 Fig. 4. Typical changes in work loop shapes at
cycle frequencies of (A) 2 Hz and (B) 6 Hz during fatigue. Numerals represent work loop numbers. Force–time plots for mouse soleus muscle during fatigue at cycle frequencies of (C) 2 Hz and (D) 6 Hz are also shown. Numerals represent work loop numbers. Upward-pointing arrows represent the onset of stimulation and downward-pointing arrows represent the end of stimulation. Muscle mass 7.61 mg; mean fibre length 9.10 mm; isometric stress 208.2 kN m−2. L0, muscle length yielding the greatest twitch force.
B 60
0 20 40
Force (mN)
−6 −4 −2 L0 2 4 6
Strain (%L0) 6 Hz
[image:4.609.231.553.447.738.2]shortening can be seen from the changing shape of the work loops (Fig. 4A,B) and the force–time records (Fig. 4C,D) as the muscle fatigues. Both the magnitude and the ability to sustain force during shortening decrease. In successive work loop and force–time plots, force declines more steeply in the early stages of shortening with the onset of fatigue (Fig. 4A–D). This progressive change in shape of the plots suggests changes in the muscle’s force–velocity properties as it fatigues. Previous studies have measured a reduction in the maximum velocity of shortening (Edman and Mattiazzi, 1981; de Haan et al. 1989; Curtin and Edman, 1994; Barclay, 1996) and reduced curvature of the force–velocity relationship (Curtin and Edman, 1994; Barclay, 1996) following fatigue under isometric conditions.
Muscle power output is also reduced by prolongation of relaxation which increases the work required to re-extend the muscle. This has been observed in other studies in which many cycles of oscillatory work have been performed (Stevens and Syme, 1989, 1993; Moon et al. 1991). Relaxation is also prolonged under isometric conditions (Allen et al. 1989; Cady
et al. 1989a; Westerblad and Lännergren, 1991).
Power output declined most rapidly at the highest cycle frequencies (Figs 2, 3; Stevens and Syme, 1993). This occurs because prolongation of relaxation increases the negative work performed by the muscle and, as relaxation represents a greater proportion of the cycling time at high frequencies, power output will be reduced more rapidly as the muscle fatigues.
Muscle efficiency is important during fatiguing contractions; it determines how much work can be sustained before substrates are depleted and end products accumulate. However, the trend of increasing fatigue resistance with decreasing cycle frequency (Figs 2, 3) differs from the variation in efficiency with cycle frequency (where peak efficiency occurs at the cycle frequency that yields maximum power output; Barclay, 1994). Thus, the factors that result in a more rapid decline of power output at high cycle frequencies are more significant than the differences in muscle efficiency at different cycle frequencies.
Fatigue during cyclical contractions in relation to in vivo function
On the basis of our in vitro measurements, a number of predictions can be made about the kinematic changes that might occur during fatiguing locomotion in vivo to limit the decline in power output. As the force–velocity properties change with the onset of fatigue, reductions in stride frequency and strain amplitude (stride length) could allow the muscle to maintain an optimal shortening velocity. Both of these effects are observed, with a consequent reduction in forward velocity (Mero et al. 1988; Nummela et al. 1992). Prolonged relaxation increases the negative work performed by the muscle. These effects could be limited if the stimulation duration were reduced, preventing force production extending into the lengthening phase of the cycle. In vitro experiments on locust Schistocerca americana flight muscle have shown
that a reduction in the number of stimuli decreases the initial power output but allows power output to be sustained for longer (Josephson and Stevenson, 1991). Therefore, operation of muscles at submaximal levels will delay the onset of fatigue.
The cycle frequency at which resistance to fatigue is maximal depends on what is required of the muscle. Muscle power output can be sustained for longer and more cumulative work can be performed at low cycle frequencies (Figs 2, 3); however, a higher absolute power output can be maintained at the cycle frequency for maximum power output (5 Hz) provided that the power does not fall below 20 % of peak power (Fig. 3).
We used the mouse soleus muscle as a convenient model system to study the effects of fatigue during cyclical contractions. However, the specific applicability of these results to locomotion in the mouse is not known.
We would like to thank Chris I. Smith and John Oughton for technical assistance. We also thank Rich Marsh and two anonymous referees for comments which improved the manuscript. G.N.A. was supported by a Wellcome Prize Studentship from the Wellcome Trust, I.S.Y. by the British Heart Foundation.
References
ALLEN, D. G., LEE, J. A. ANDWESTERBLAD, H. (1989). Intracellular calcium and force in isolated single muscle fibres from Xenopus. J. Physiol., Lond. 415, 433–458.
BARCLAY, C. J. (1994). Efficiency of fast- and slow-twitch muscles of
the mouse performing cyclical contractions. J. exp. Biol. 193, 65–78.
BARCLAY, C. J. (1996). Mechanical efficiency and fatigue of fast and
slow muscles of the mouse. J. Physiol., Lond. 497, 781–794. CADY, E. B., ELSHOVE, H., JONES, D. A. ANDMOLL, A. (1989a). The
metabolic causes of slow relaxation in fatigued human skeletal muscle. J. Physiol., Lond. 418, 327–337.
CADY, E. B., JONES, D. A., LYNN, J. AND ANDNEWHAM, D. J. (1989b). Changes in force and intracellular metabolites during fatigue of human skeletal muscle. J. Physiol., Lond. 418, 311–325.
CURTIN, N. A. ANDEDMAN, K. A. P. (1994). Force–velocity relation
for frog muscle fibres: effects of moderate fatigue and of intracellular acidification. J. Physiol., Lond. 475, 483–494. DAUT, J. ANDELZINGA, G. (1989). Substrate dependence of energy
metabolism in isolated guinea-pig cardiac muscle: a microcalorimetric study. J. Physiol., Lond. 413, 379–397. DEHAAN, A., JONES, D. A. ANDSARGEANT, A. J. (1989). Changes in
velocity of shortening, power output and relaxation rate during fatigue of rat medial gastrocnemius muscle. Pflügers Arch. 413, 422–428.
EDMAN, K. A. P. ANDMATTIAZZI, A. R. (1981). Effects of fatigue and altered pH on isometric force and velocity of shortening at zero load in frog muscle fibres. J. Muscle Res. Cell Motil. 2, 321–334. FITTS, R. H. (1994). Cellular mechanisms of fatigue. Physiol. Rev. 74,
49–94.
GRASSINO, A. E. ANDCLANTON, T. (1993). Mechanisms of muscle
fatigue. Monaldi Arch. Chest Dis. 48, 94–98.
mouse in relation to their locomotory function. J. exp. Biol. 198, 491–502.
JOSEPHSON, R. K. (1985). Mechanical power output from striated
muscle during cyclical contractions. J. exp. Biol. 114, 493–512.
JOSEPHSON, R. K. ANDSTEVENSON, R. D. (1991). The efficiency of
flight muscle from the locust Schistocerca americana. J. Physiol., Lond. 442, 413–429.
LÄNNERGREN, J. ANDWESTERBLAD, H. (1991). Force decline due to
fatigue and intracellular acidification in isolated fibres from mouse skeletal muscle. J. Physiol., Lond. 434, 307–322.
LUFF, A. R. (1981). Dynamic properties of the inferior rectus, extensor digitorum longus, diaphragm and soleus muscles of the mouse. J. Physiol., Lond. 313, 161–171.
MERO, A., LUHTANAN, P., KOMI, P. V. AND ANDSUSANKA, P. (1988). Kinetics of top sprint (400 m) running in fatigued conditions. Track and Field Q. Rev. 88, 42–45.
MOON, T. W., ALTRINGHAM, J. D. AND ANDJOHNSTON, I. A. (1991). Energetics and power output of isolated fish fast muscle fibres performing oscillatory work. J. exp. Biol. 158, 261–273.
NUMMELA, A., VUORIMAA, T. ANDRUSKO, H. (1992). Changes in force
production, blood lactate and EMG activity in the 400-m sprint. J. Sports Sci. 10, 217–228.
SARGEANT, A. J. (1994). Human power output and muscle fatigue. Int.
J. Sports Med. 15, 116–121.
STEVENS, E. D. AND SYME, D. A. (1989). The relative changes in
isometric force and work during fatigue and recovery in isolated toad sartorius muscle. Can. J. Physiol. Pharmac. 67, 1544–1548.
STEVENS, E. D. ANDSYME, D. A. (1993). Effect of stimulus duty cycle
and cycle frequency on power output during fatigue in rat diaphragm muscle doing oscillatory work. Can. J. Physiol. Pharmac. 71, 910–916.
SYME, D. A. ANDSTEVENS, E. D. (1989). Effect of cycle frequency and excursion amplitude on work done by rat diaphragm muscle. Can. J. Physiol. Pharmac. 67, 1294–1299.
WESTERBLAD, H. ANDLÄNNERGREN, J. (1991). Slowing of relaxation