Whisker texture classification with uncertain contact pose geometry
Mathew H. Evans, Martin J. Pearson, Tony J. Prescott and Charles W. Fox
Abstract— Tactile sensing can be an important source of information for robots, and texture discrimination in partic-ular is useful in object recognition and terrain identification. Whisker based tactile sensing has recently been shown to be a promising approach for mobile robots, using simple sensors and many classification approaches. However these approaches have often been tested in limited environments, and have not been compared against one another in a controlled way. A wide range of whisker-object contact poses are possible on a mobile robot, and the effect such contact variability has on sensing has not been properly investigated. We present a novel, carefully controlled study of simple surface texture classifiers on a large set of varied pose conditions that mimic those encountered by mobile robots. Namely, single brief whisker contacts with textured surfaces at a range of surface orientations and contact speeds. Results show that different classifiers are appropriate for different settings, which was not obvious from the original presentations of the classifiers. The results may be used to inform selection of classifiers in tasks such as tactile SLAM [12].
I. INTRODUCTION
Tactile information can provide an agent with reports of object location and identity. Whisker sensors have some unique advantages over more complex sensors such as fingertips, including mechanical simplicity, and cost [21], and rodents provide proof that excellent tactile sensing is possible using only whiskers [3]. Simple shape recognition from whiskers is possible with simple features [5], [11] or static beam equations [18]. Tactile surface identification remains an active research topic, broadly focussing on the two tasks of terrain identification – where the surface is continuous [15],[19], and object discrimination – where each contact with the surface is discrete (such as in whisking robots [23]). Texture identification for object discrimination would be useful in robot tasks such as tactile SLAM [4], [12]. Many machine learning approaches have been used to establish some benchmarks for texture discrimination in constrained, idealised poses, with both artificial fingertips [2] and whisker-like sensors [15]. However these have been performed in isolation in unique whisker-object contact set-tings, and have not been compared against one another in an independent controlled study for more realistic poses.
We define a pose as the angle with which a whisker makes contact with a textured surface, and the speed that whisker
[image:1.595.330.540.151.310.2]M.H. Evans, T.J. Prescott and C.W.Fox are with the Sheffield Centre for Robotics (SCentRo), University of Sheffield, Sheffield, S10 2TN, U.K. (e-mail: mat.evans@shef.ac.uk; t.j.prescott@shef.ac.uk; charles.fox@gmail.com). M. J. Pearson is with the Bristol Robotics Lab-oratory, Bristol, BS16 1QD, U.K. (e-mail: martin.pearson@brl.ac.uk). The authors would like to thank Nathan Lepora for insightful comments on the manuscript, and the EPSRC Doctoral Training Scheme and EU FP-7 grants BIOTACT (ICT-215910) and EFAA (ICT-270490) for funding the work.
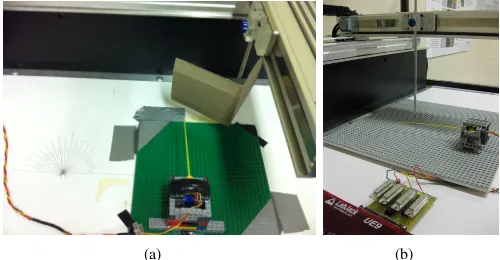
Fig. 1. Whisker pose geometry. A textured surface (blue) is presented to the whiskered agent (grey). Contact speed V and surface angleθare unknown, but affect texture discrimination.
is moving as contact it made. The way a whisker contacts a surface affects the deflection signals. It has been shown previously that texture discrimination is more difficult when whisker pose is unknown or variable [9] as is the case for contacts made by mobile robots in unknown environments. Surface angle is known to broadly affect texture discrim-ination [13], but has not been investigated systematically or classified from single whisker contacts (though multi-whisker template classifiers have successfully discriminated surface angles on a mobile robot [12]).
Contact speed is uncertain in many cases, including un-certain robot body velocity from odometry noise; unun-certain angular whisker velocity during active whisking (the os-cillatory whisker movements generated by rats to explore environments, and control the duration and force of contacts [3]); and the possibility of contact with moving objects in the environment. While other studies [5],[22] have considered contact distance along the whisker shaft as a further variable, we have found in practice [12] that almost all real-world contacts for mobile robots occur at the tip of the whisker, and the few that do not can be used to reposition the robot to obtain a tip contact [11].
(a) (b)
Fig. 2. The XY positioning robot (a) from above, to show the range of movement available. Textured surfaces were fixed to the angled corner stimulus and presented to the whisker at different angles and speeds. (b) The robot from the side.
texture classification methods: template based classification [6], spectral template based classification [7] and spectral feature based classification [16], [13]. These methods were chosen for their recent track record in classifying whisker data, and in particular their deterministic nature and accuracy when only a small training set is available. The remainder of this paper describes the XY positioning robot data collection procedure, then specifies the classifiers. Results for each classifier are detailed before being discussed with a view to interpretation and mobile robot applications.
II. METHODS
A. Artificial whisker and XY positioning robot
A tapered, flexible plastic whisker [20],[7]∼5 times scale models of a rat whisker, was mounted into an inflexible rubber-filled ‘follicle’ case. A tri-axis hall effect sensor mounted in the follicle case measures the deflection of a magnet fixed to the base of the whisker shaft. The hall effect sensor IC was programmed to generate two voltages, corresponding to the magnitude of the whisker base de-flection in two directions, x and y.An XY-table (Yamaha-PXYX, Yamaha Robotics) was used (Figure 2), having a movement range of 350×650mm, and able to move up to 720mm/s. Repeatability of the robot is ±0.01mm, and the maximum load it can carry is 1.5kg. Objects are carried by the robot into the artificial whisker, which is fixed to the table as this allows us to control the contact as carefully as possible. Moving the whisker into an object would cause the whisker to oscillate unpredictably during movement between contacts, and as a result each contact would be slightly different. A controller (Yamaha RCX 222, 2-axis robot con-troller) takes instructions from a PC through an RS232 cable, and the controller interprets the instructions, completes path integration, and drives the motors. Instructions for the robot are generated inside a MATLAB (www.mathworks.com) loop, and can be easily updated during robot operation, depending on the whisker input.
B. Data collection for angle, speed and texture estimation
A right angled corner stimulus was designed for presenting textures to the whisker on the XY positioning robot. This textured object is shown in Figure 2 (a). The stimulus consists of an angled strip of aluminium suspended from the XY positioning robot on an pole. Textured sandpapers were affixed to the aluminium surface using double sided adhesive tape. A range of contact speeds was chosen to limit any damage that could occur to the whisker from the large stimulus during high velocity impacts. 6mm/s was the lower bound on speed, with an upper bound of≈106mm/s, with an interval of≈7mm/s, providing 11 different speeds. Surface angle ranged from 10◦–80◦, in increments of 10◦. When the stimulus was angled at 0◦ or 90◦ the contact was equivalent to a point contact along the shaft so was not considered a tip–surface contact for this experiment. Four textures were chosen, three grades of sandpaper (P80, P180, and P600) and a smooth aluminium surface. Eleven speeds, eight angles and four textures results in 352 different combinations. Contact combinations were randomly interleaved during data acquisition to limit any affects of changing whisker prop-erties during the trial. For each contact combination the whisker was deflected by the robot in both a clockwise and anticlockwise directions (-ve and +ve inx), ensuring that the whisker did not bend over time through repeated unilateral deflections. The experiment was performed twice to generate sufficient data for classification.
A simple biomimetic robot control algorithm was im-plemented to restrict whisker object contacts to brief, light touches. The robot was programmed to move an object into the whisker at a given speed until a deflection threshold was crossed, at which point the robot retracted the object as fast as possible (720mm/s). Temporal latency for the loop is ≈300ms from initial contact due to the controller duty cycle. Whisker deflections were processed at 4kHz. Data from each trial was stored separately. Deflections from the clockwise robot movement trials (-ve in x) were converted so all data samples were equivalent. Trials were ordered into arrays by robot movement direction, contact speed, surface angle and texture. Each trial was aligned to peak deflection, and shortened to only the 6000 samples either side of peak deflection (1.5s).
C. Classifier specification
Data was separated into training and test sets that were each complete data sets of 8 angles, 11 speeds, and 4 textures. Signals were placed in the training or test sets at random from the original data. In each case classifiers were developed on the training sets, and performance was determined on the test set.
e(I, Ti) = n X
t=1
(I(t)−Ti(t))2. (1)
wherenis the length of the template in samples. The tem-plate with the lowest sum of squared error was determined the winner, and a recording was made in an output array of the estimated speed and radial distance to contact of the input trial.
2) Spectral template based classification for angle, speed and texture discrimination: A fast Fourier transform (FFT) was performed on the filtered data in MATLAB, The MAT-LAB FFT function returns the discrete Fourier transform (DFT) of the input signal (x) of lengthN, computed with a fast Fourier transform (FFT) algorithm,
X(k) =
N X
j=1
x(j)ωN(j−1)(k−1), (2)
whereωN =e(−2πi)/N is an Nth root of unity.
The absolute of the DFT is then stored as a template for comparison with DFTs of incoming test data as in the template classifier described above.
3) Feature based classification for angle, speed and tex-ture discrimination: Inspection of the data showed that peak deflection magnitude could be used as a feature for speed discrimination under conditions of varying contact angle and texture. Deflection magnitude was taken as the Hall effect sensor output voltage at peak deflection, which is proportional to the bending moment M. Feature f1 can be defined as,
f1= maxtM(t), (3)
whereM(t) is the deflection magnitude varying with time, measured by the Hall effect sensor in volts. Note thatt(f1) = t(maxtM(t))
In previous preliminary work [8] it was shown that the latency to peak or slope of the initial whisker deflection could be used as a measure of surface angle. To test this idea comprehensively we implemented the same classifier here. Taking the amplitude of deflectionf1, and the time of peak deflection t(f1), we can find feature f2 the slope of deflection,
f2=
f1 t(f1)
. (4)
To perform a feature based classification for texture dis-crimination, centroid energy features such as those described in [16] and [13] were extracted from the signal. After the data had been IIR notch filtered to remove the resonant frequency the modulation centroid,f3, was taken as the frequency with most energy in the DFT (X, see equation eq:FFT) of the signal x afterX1−5Hz is set to zero,
f3= arg max abs(X[6Hz−1KHz]). (5)
The modulation energy, f4, was defined as the energy of the DFT at the modulation centroid (the magnitude of energy atf3),
f4= max abs(X[6Hz−1KHz]). (6)
Finally a total power feature, f5, was defined as the total energy in the FFT below 1KHz,
f5=
1KHz X
6Hz
|X|, (7)
where FFT(1:5Hz) were set to 0.
In both the contact pose geometry and frequency case a model was generated of the relationship between each feature and the corresponding contact property with regression, (using the polyfit toolbox in MATLAB http://bit.ly/polyfitn). Using simple linear least squares a model is generated that can be used to classify new data. Only three arguments are required for generating the model, a vector of independent variable values, a vector of dependent variable values, and a model specification, namely the degree of the polynomial. A second degree polynomial was chosen as preliminary studies showed it provided good results. The independent variables for contact pose geometry were featuresf1 for contact speed, f2 for surface angle,f3, f4 andf5 for surface texture.
An additional combined feature classifier was built to see if combining the texture featuresf3,f4 andf5 into a single model could improve classification. Polynomial regression was used to develop a model comprising all three texture features, as above. A fourth degree polynomial was chosen as preliminary studies showed it provided good results. After the angle, speed and texture of a test data file is estimated with the model the output is rounded to the nearest integer to make a classification.
4) A note on the analysis: Result are presented for each classifier in turn for surface angle, speed and texture estimation. The performance is compared by calculating the accuracy and precision of angle, speed and texture classification by the reporting of mean and standard errors for classification. Confusion matrices are given for each classifier, as imaged arrays only to give a visual indication of classifier performance.
Cohen’s Kappa κ [1] is given as a summary statistic, providing a measure of classification accuracy that is scaled for the number of classes involved.
Formallyκis defined in terms of total accuracy (hit rate or PO, O for observed value), and chance performancePE (E for expected value) by,
κ= PO−PE
1−PE
. (8)
In this way performance can be compared for each of the contact parameters even though they are over different classification ranges [10]. The value will fall between 0 and 1, with 1 indicating perfect classification and 0 indicating chance performance. Scores below 0.2 are deemed poor classification. In a 2 choice discrimination, aκof 0.5 would be equivalent to a hit rate of 75% (50% = chance).
III. RESULTS FOR SURFACE ANGLE AND TEXTURE ESTIMATION UNDER VARYING CONTACT SPEEDS
0 1000 2000 3000 0
0.5 1 1.5 2
time(ms)
Hall output
Texture: P80, Angle:10 °
0 1000 2000 3000 0
0.5 1 1.5 2
time(ms)
Hall output
Texture: P180, Angle:10 °
0 1000 2000 3000 0
0.5 1 1.5 2
time(ms)
Hall output
Texture: P600, Angle:10 °
0 1000 2000 3000 0
0.5 1 1.5 2
time(ms)
Hall output
Texture: Smooth, Angle:10 °
0 1000 2000 3000 0
0.5 1 1.5 2
time(ms)
Hall output
Texture: P80, Angle:30 °
0 1000 2000 3000 0
0.5 1 1.5 2
time(ms)
Hall output
Texture: P180, Angle:30 °
0 1000 2000 3000 0
0.5 1 1.5 2
time(ms)
Hall output
Texture: P600, Angle:30 °
0 1000 2000 3000 0
0.5 1 1.5 2
time(ms)
Hall output
Texture: Smooth, Angle:30 °
0 1000 2000 3000 0
0.5 1 1.5 2
time(ms)
Hall output
Texture: P80, Angle:50 °
0 1000 2000 3000 0
0.5 1 1.5 2
time(ms)
Hall output
Texture: P180, Angle:50 °
0 1000 2000 3000 0
0.5 1 1.5 2
time(ms)
Hall output
Texture: P600, Angle:50 °
0 1000 2000 3000 0
0.5 1 1.5 2
time(ms)
Hall output
Texture: Smooth, Angle:50 °
0 1000 2000 3000 0
0.5 1 1.5 2
time(ms)
Hall output
Texture: P80, Angle:70 °
0 1000 2000 3000 0
0.5 1 1.5 2
time(ms)
Hall output
Texture: P180, Angle:70 °
0 1000 2000 3000 0
0.5 1 1.5 2
time(ms)
Hall output
Texture: P600, Angle:70 °
0 1000 2000 3000 0
0.5 1 1.5 2
time(ms)
Hall output
[image:4.595.59.556.59.462.2]Texture: Smooth, Angle:70 °
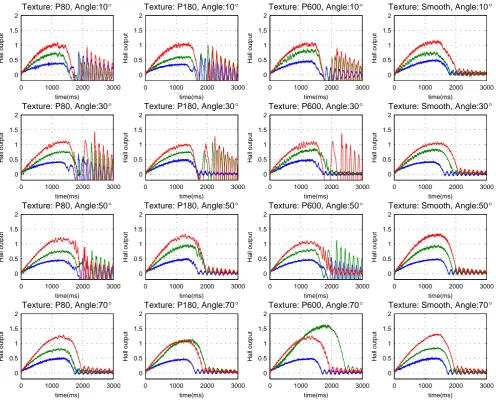
Fig. 3. Typical whisker deflections from the artificial whisker, for different angles, speeds and textures. Texture varies by column, angle varies by row. Colour indicates contact speed, blue = 36mm/s, green = 72mm/s, red = 108mm/s. Note large differences in the amount of oscillatory ringing in some trials.
A. Template based classification of angle, speed and texture
Figure 4 shows the confusion matrices for simultaneous angle, speed and texture classification using a template classifier on raw data. Cohen’sκfor each parameter: Angle = 0.27, Speed = 0.25, Texture = 0.24. Cohen’sκfor texture independent of contact pose = 0.24. Mean and standard errors for classification, when classified simultaneously: Angle, mean (µ) = 0.71◦, standard error (σ) = 15.6◦; Speed, µ = -2.7mm/s,σ= 14.22mm/s; Texture,µ= -0.02,σ = 1.23.
B. Spectral template based classifier results for angle, speed and texture discrimination
Figure 5 shows the confusion matrices for simultane-ous angle, speed and texture classification using a spectral template classifier. Cohen’s κfor each parameter: Angle = 0.44, Speed = 0.14, Texture = 0.46. Cohen’s κ for texture independent of contact pose = 0.42. Mean and standard errors for classification, when classified simultaneously: Angle,
mean (µ) = -1.08◦, standard error (σ) = 13.8◦; Speed, µ
= -2.78mm/s,σ= 22.4mm/s; Texture, µ= 0.14,σ= 1.00.
C. Feature based classification of angle, speed and texture
Figure 6 shows the confusion matrices for feature based speed and angle classification using featuresf1 (magnitude of deflection), f2 (slope of deflection), and texture classifi-cation using featuresf3 (modulation centroid), f4 (centroid energy) andf5(total energy). Cohen’sκfor each parameter; angle = 0.11, speed = 0.43, texture (f3) = 0.06, texture (f4) = 0.03, texture (f5) = 0.15. Cohen’s κ for each parameter independent of each other; angle = 0.3, speed = 0.25, texture (f3) = 0.08, texture (f4) = 0.21, texture (f5) = 0.27. Cohen’s κ for texture discrimination by combining features with multinomial regression was 0.12.
Predicted angle
Actual angle
Confusion matrix for angle estimation
10 20 30 40 50 60 70 80 10
20
30
40
50
60
70
80
0 5 10 15 20 25
(a)
Predicted speed
Actual speed
Confusion matrix for speed estimation
36.0 43.2 50.4 57.6 64.8 72.0 79.2 86.4 93.6100.8108.0 36.0
43.2
50.4
57.6
64.8
72.0
79.2
86.4
93.6
100.8
108.0
0 5 10 15 20
(b)
Predicted texture
Actual texture
Confusion matrix for texture estimation
P80 P180 P600 Smooth P80
P180
P600
Smooth
10 15 20 25 30 35 40 45 50
[image:5.595.62.558.63.224.2](c)
Fig. 4. Confusion matrices for classification of angle (a), speed (b), and texture (c) with the raw signal template classifier over all contacts. Brightness indicates larger numbers, and better classification
Predicted angle
Actual angle
Confusion matrix for angle estimation
10 20 30 40 50 60 70 80 10
20
30
40
50
60
70
80
0 5 10 15 20 25 30 35
(a)
Predicted speed
Actual speed
Confusion matrix for speed estimation
36.0 43.2 50.4 57.6 64.8 72.0 79.2 86.4 93.6100.8108.0 36.0
43.2
50.4
57.6
64.8
72.0
79.2
86.4
93.6
100.8
108.0
0 2 4 6 8 10 12 14 16
(b)
Predicted texture
Actual texture
Confusion matrix for texture estimation
P80 P180 P600 Smooth P80
P180
P600
Smooth 10
20 30 40 50 60 70
[image:5.595.61.558.272.433.2](c)
Fig. 5. Confusion matrix for classification of texture with a spectral template based classification. Brightness indicates larger numbers, and better classification.
TABLE I
MEAN AND STANDARD DEVIATIONS OF CLASSIFICATION ERROR FOR
FEATURE BASED CLASSIFICATION,FOR ALL FIVE FEATURES WHEN
CLASSIFIED SIMULTANEOUSLY.
f1 f2 f3 f4 f5 Combined
Mean 1.80mm/s 0.17◦ 0.43 -0.07 0.05 -0.09
Std Err 12.12mm/s 18.6◦ 1.10 1.22 1.09 0.97
[image:5.595.53.296.530.559.2]D. Comparing the classifiers
Figure 7 compares Cohen’sκfor the best version of each method, namely the low pass filtered template, the frequency template, a ‘best case’ feature classifier (f1for speed,f2for angle andf5 for texture). Mean and standard errors for each method are compared in Figure 8.
IV. DISCUSSION
We have presented the first results for texture classifi-cation in a controlled classifier comparison study, under varying contact pose (varying surface angle and speed). These variations occur in real mobile robot settings, where the classifications would be useful for tasks such as object
Predicted angle
Actual angle
Confusion matrix for angle estimation
10 20 30 40 50 60 70 10
20
30
40
50
60
70
0 2 4 6 8 10 12 14 16
(a)
Predicted speed
Actual speed
Confusion matrix for angle estimation
36.0 43.2 50.4 57.6 64.8 72.0 79.2 86.4 93.6100.8 108.0
36.0
43.2
50.4
57.6
64.8
72.0
79.2
86.4
93.6
100.8
108.0
0 5 10 15 20 25 30
(b)
Predicted texture
Actual texture
Confusion matrix for texture estimation
P80 P180 P600 Smooth P80
P180
P600
Smooth
0 10 20 30 40 50 60
(c)
Predicted texture
Actual texture
Confusion matrix for texture estimation
P80 P180 P600 Smooth P80
P180
P600
Smooth
0 10 20 30 40 50 60 70 80
(d)
Predicted texture
Actual texture
Confusion matrix for texture estimation
P80 P180 P600 Smooth P80
P180
P600
Smooth
0 10 20 30 40 50 60 70 80
(e)
Predicted texture
Actual texture
Confusion matrix for texture estimation
P80 P180 P600 Smooth P80
P180
P600
Smooth
0 10 20 30 40 50 60 70
[image:6.595.59.559.60.389.2](f)
Fig. 6. Confusion matrices for classification with the feature based classifier; of angle withf2 (a), speed withf1 (b), and texture withf3 (d),f4 (e)
andf5(f). (c) Confusion matrix for classification of texture with the multinomial feature based classifier, using featuresf3,f4andf5over all contacts.
Brightness indicates larger numbers, and better classification
Template FFT Temp Feature −25
−20 −15 −10 −5 0 5 10 15 20 25
Mean angle error for all methods
Method
Error (
°
)
(a)
Template FFT Temp Feature −30
−20 −10 0 10 20 30
Mean speed error for all methods
Method
Error (mm/s)
(b)
Template FFT Temp Feature −1.5
−1 −0.5 0 0.5 1 1.5
Mean texture error for all methods
Method
Error (texture)
(c)
Fig. 8. Mean and standard error of classification for the best version of each method for angle (a), speed (b) and texture (c). Template: raw data template; FFT Temp: spectral template; Feat: a ‘best case’ feature classifier (f1 for speed,f2 for angle andf5 for texture)
needs to be done to develop a clearer understanding of the way surface angles and textures, and contact speeds affect whisker deflections and how these effects interact. The XY positioning robot system will be central to these efforts.
There appeared to be no advantage to classifying
[image:6.595.63.557.443.624.2]Template FFT Temp Feature 0
0.05 0.1 0.15 0.2 0.25 0.3 0.35 0.4 0.45 0.5
Method
Cohen‘s
κ
Cohen‘s κ for all methods
[image:7.595.58.299.56.256.2]Angle Speed Texture
Fig. 7. Cohen’s κ for each method for classification of surface angle (blue), object speed (red) and surface texture (yellow). Template: raw data template; FFT Temp: spectral template; Feat: a ‘best case’ feature classifier (f1 for speed,f2for angle andf5 for texture). Note contrasting classifier
performance across parameters.
it has been shown that information about the whisker–object contact pose geometry can improve whisker sensing [9],[13]. It is difficult to determine why this has not been the case here. It may be that better classifiers could be built, or more successful features could be extracted. In previous studies a Gaussian classifier was used for feature based texture discrimination [13]. This kind of classifier may be more effective at combining information from a number of features, or for discriminating properties that interact. In addition, larger data sets may be useful for training classifiers to be robust to small within–trial variations. Inspection of the raw signals in Figure 3 shows oscillatory ringing after contact on some trials but not others. This ringing does not seem to be associated with a particular contact parameter, but may be due to the whisker tip interacting with a surface uniquely on different trials. It may be that trying to classify so many parameters effectively and at the same time may to too difficult a task for one whisker making a single brief contact. This may be the limit of single whisker sensing, and improvements would no doubt be gained through pooling of information across whiskers. Developing classifiers that can use information from more than one trial, or multiple whiskers as developed previously for surface angle discrimi-nation on a mobile robot [12], could alleviate these problems. It may be possible to combine classifiers such as those presented here in a mixture of experts [17]. Probabilistic methods, some of which have been successfully applied to whisker sensing such as Bayesian blackboards [14] and sequential analysis [19], are ideally suited to optimally combining information from a number of sources. In this way many low-resolution reports of touch events can be combined across whiskers and over time to make high-level inferences about objects and surfaces in the environment.
REFERENCES
[1] J. Cohen et al. A coefficient of agreement for nominal scales.
Educational and psychological measurement, 20(1):37–46, 1960.
[2] S. Decherchi, P. Gastaldo, R.S. Dahiya, M. Valle, and R. Zunino. Tactile-data classification of contact materials using computational intelligence.IEEE Transactions on Robotics, 27(3):635–639, 2011. [3] M.E. Diamond, M. von Heimendahl, P.M. Knutsen, D. Kleinfeld, and
E. Ahissar. ’where’ and ’what’ in the whisker sensorimotor system.
Nat Rev Neurosci, 9(8):601–612, 2008 (a).
[4] M.W.M.G. Dissanayake, P. Newman, S. Clark, H.F. Durrant-Whyte, and M. Csorba. A solution to the simultaneous localization and map building (SLAM) problem. Robotics and Automation, IEEE
Transactions on, 17(3):229–241, 2001.
[5] M. H. Evans, C. W. Fox, N.F. Lepora, M. J. Pearson, and T. J. Prescott. Whisker-object contact speed affects radial distance estimation. In
Proceedings IEEE ROBIO, 2010.
[6] M. H. Evans, C. W. Fox, M. J. Pearson, and T. J Prescott. Tactile discrimination using template classifiers: Towards a model of feature extraction in mammalian vibrissal systems. InProceedings of the 11th International Conference on Simulation of Adaptive Behaviour. (SAB
2010) From Animals to Animats., 2010.
[7] M. H. Evans, C. W. Fox, and T. J. Pearson, M. J.and Prescott. Spectral template based classification of robotic whisker sensor signals in a floor texture discrimination task. In T Kyriacou, U. Nehmzow, C. Melhuish, and M. Witkowski, editors, Proceedings of Towards
Autonomous Robotic Systems (TAROS 2009), pages 19–24, 2009.
[8] M. H. Evans, C.W. Fox, M. J. Pearson, and T. J. Prescott. Object location, orientation, and velocity extraction from artificial vibrissal signals. In Society for Neuroscience Abstracts. Society for
Neuro-science (Program No. 174.8/ Z12), 2009.
[9] M. Fend. Whisker-based texture discrimination on a mobile robot.
Advances in Artificial Life, pages 302–311, 2005.
[10] A.D. Forbes. Classification-algorithm evaluation: Five performance measures based onconfusion matrices.Journal of Clinical Monitoring
and Computing, 11(3):189–206, 1995.
[11] C. W. Fox, M. H. Evans, N. F. Lepora, M. J. Pearson, A. Ham, and T. J. Prescott. Crunchbot: a mobile whiskered robot platform. In
Proceedings of Towards Autonomous Robots, Springer., 2011.
[12] C. W. Fox, M. H. Evans, M. J. Pearson, and T. J. Prescott. Tactile SLAM with a whiskered robot. Proceedings ICRA 2012, 2012. [13] C. W. Fox, B. Mitchinson, M. J. Pearson, A. G. Pipe, and T. J. Prescott.
Contact type dependency of texture classification in a whiskered mobile robot.Autonomous Robots, 2009.
[14] C. W. Fox and T. J. Prescott. Mapping with sparse local sensors and strong hierarchical priors. In Proceedings of Towards Autonomous
Robotic Systems (Springer), 2011. Submitted to TAROS 2011.
[15] P. Giguere and G. Dudek. A simple tactile probe for surface identification by mobile robots. Robotics, IEEE Transactions on, 27(3):534–544, 2011.
[16] J. Hipp, E. Arabzadeh, E. Zorzin, J. Conradt, C. Kayser, M. E. Diamond, and P. Konig. Texture signals in whisker vibrations. J
Neurophysiol, 95(3):1792–1799, 2006.
[17] R.A. Jacobs, M.I. Jordan, S.J. Nowlan, and G.E. Hinton. Adaptive mixtures of local experts. Neural computation, 3(1):79–87, 1991. [18] Makoto Kaneko. Active antenna. Robotics and Automation, IEEE
Transactions on, pages 2665–2671, 1994.
[19] N.F. Lepora, C.W. Fox, M.H. Evans, M.E. Diamond, K. Gurney, and T.J. Prescott. Optimal decision-making in mammals: insights from a robot study of rodent texture discrimination. Journal of The Royal
Society Interface, 2012.
[20] M. J. Pearson, B. Mitchinson, J. Welsby, A. G. Pipe, and T. J. Prescott. Scratchbot: Active tactile sensing in a whiskered mobile robot. From
Animals to Animats SAB2010., 2010.
[21] T.J. Prescott, M.J. Pearson, B. Mitchinson, J.C.W. Sullivan, and A.G. Pipe. Whisking with robots from rat vibrissae to biomimetic technology for active touch.IEEE Robotics and Automation Magazine, 16(3):42–50, 2009.
[22] J.H. Solomon and M.J.Z. Hartmann. Radial distance determination in the rat vibrissal system and the effects of weber’s law.
Philo-sophical Transactions of the Royal Society B: Biological Sciences,
366(1581):3049–3057, 2011.