1 2 3 4 5 6 7 8 9 10 11 12 13 14 15 16 17 18 19 20 21 22 23 24 25 26 27 28 29 30 31 32 33 34 35 36 37 38 39 40 41 42 43 44 45 46 47 48 49 50 51 52 53 54 55 56 57 58 59
A new approach to predicting environmental transfer of radionuclides to wildlife: a demonstration for freshwater fish and caesium
Beresford N.A1., Yankovich T.L.2, Wood, M.D.3, Fesenko, S.4, Andersson, P.5, Muikku, M.6, Willey, N.J.7
1
NERCCentre for Ecology & Hydrology, Lancaster Environment Centre, Library Av. Bailrigg, Lancaster, LA1 4AP, United Kingdom
2
Saskatchewan Research Council, Environment and Forestry, #125, 15 Innovation Blvd., Saskatoon, SK S7N 2X8, Canada
3
School of Environment and Life Sciences, Room 323, Peel Building, University of Salford, Manchester, M5 4WT, United Kingdom
4
International Atomic Energy Agency, 1400 Vienna, Austria
5
Strålsäkerhetsnymdigheten, Swedish Radiation Safety Authority, SE-171 16 Stockholm, Sweden
6
STUK, PO Box 14, 00881 Helsinki, Finland
7
Centre for Research in Biosciences, University of the West of England, Coldharbour Lane, Frenchay, Bristol, BS16 1QY, United Kingdom
+
Corresponding author. Email: nab@ceh.ac.uk Tel.: [44] 01524 595856 Fax: [44] 01524 61536
Abstract
The application of the concentration ratio (CR) to predict radionuclide activity concentrations in wildlife from those in soil or water has become the widely accepted approach for
environmental assessments. Recently both the ICRP and IAEA have produced compilations of CR values for application in environmental assessment. However, the CR approach has many limitations most notably that transfer of most radionuclides is largely determined by site-specific factors (e.g. water or soil chemistry). Furthermore, there are few, if any, values for many radionuclide-organism combinations. In this paper we propose an alternative approach and, as an example, demonstrate and test this for caesium and freshwater fish. Using a Residual Maximum Likelihood (REML) mixed-model regression we analysed a dataset comprising 597 entries for 53 freshwater fish species from 67 sites. The REML analysis generated a mean value for each species on a common scale after REML adjustment taking account of the effect of the inter-site variation. Using an independent dataset, we subsequently test the hypothesis that the REML model outputs can be used to predict
radionuclide, in this case radiocaesium, activity concentrations in unknown species from the results of a species which has been sampled at a specific site. The outputs of the REML analysis accurately predicted 137Cs activity concentrations in different species of fish from 27 Finnish lakes; these data had not been used in our initial analyses. We recommend that this alternative approach be further investigated for other radionuclides and ecosystems.
Keywords
Concentration ratio, residual maximum likelihood model, caesium, freshwater fish *Manuscript
1 2 3 4 5 6 7 8 9 10 11 12 13 14 15 16 17 18 19 20 21 22 23 24 25 26 27 28 29 30 31 32 33 34 35 36 37 38 39 40 41 42 43 44 45 46 47 48 49 50 51 52 53 54 55 56 57 58 59 60
1. Introduction
Over recent years a number of approaches and associated tools have been developed to assess
the exposure of wildlife to ionising radiation (e.g. Copplestone et al., 2001; USDOE, 2002;
Brown et al., 2008; ICRP, 2008; ICRP, 2009; Beresford et al., 2008a). These tools use
models to predict radionuclide activity concentrations in wildlife to enable internal absorbed
dose rates to be estimated. Most commonly this is achieved by using a simple concentration
ratio (CRwo-media) which relates the whole organism activity concentration to the activity
concentration in the appropriate medium for a given environment (e.g. soil or air for the
terrestrial environment, water for aquatic environments) (Beresford et al., 2008a).
Given the large number of organisms and radionuclides that may need to be considered to
allow assessment of the many source terms and different environments, it is perhaps not
surprising that there are many cases where empirical data to derive CRwo-media are lacking.
Where this is the case a variety of extrapolation approaches have been used to enable the
estimation of whole organism activity concentrations (Copplestone et al., 2003; Beresford et
al., 2008b; Higley et al., 2003; ICRP, 2009). Although recent attempts to collate CR values
for wildlife have led to improved databases, there are still many gaps in our knowledge
(Howard et al., 2013; Copplestone et al., in-press; ICRP 2009). Consequently, there is still a
need to develop robust extrapolation approaches most especially: (i) to enable initial
screening tier assessments for which site-specific data are not available (Brown et al.,
in-press); (ii) for protected species for which it may be impossible to acquire sufficient data
(e.g. Copplestone et al., 2003); and (iii) for the International Commission on Radiological
Protection‟s Reference Animals and Plants (RAPs) which are defined specifically at the
taxonomic family level but for which there are relatively few specific data (ICRP, 2009;
Copplestone et al., in-press).
Soil-to-plant transfer of elements of radiological interest has been related to plant
evolutionary history, or phylogeny, for Cs (Broadley et al., 1999; Willey et al., 2005), Sr
(Willey and Fawcett, 2005a), Ru (Willey and Fawcett, 2006), Cl (Willey and Fawcett,
2005b), Co (Willey and Wilkins, 2008) and U (Willey, 2010). Such phylogenetic
relationships present a potential approach to enable predictions of transfer, with some
scientific justification, for taxonomic groups for which there are no data either at the generic
1 2 3 4 5 6 7 8 9 10 11 12 13 14 15 16 17 18 19 20 21 22 23 24 25 26 27 28 29 30 31 32 33 34 35 36 37 38 39 40 41 42 43 44 45 46 47 48 49 50 51 52 53 54 55 56 57 58 59
organisms other than plants has also been demonstrated by Jeffree et al. (2010; in-press) who
suggested that the transfer of a number of radionuclides to marine teleost and chondrichthyan
fishes and the amphioxus (fish like chordate) species Branchiostoma lanceolatumis is influenced by phylogeny. However, the work of Jeffree et al. was based upon the results of
laboratory studies. Whilst this usefully removes the influences of many confounding factors it
is not directly applicable to environmental conditions as foodchain transfer was excluded.
The objective of the work described in this paper was to explore if phylogeny could be used
to explain variation in the transfer of radiocaesium to freshwater fish species based on field
observations analysed using Residual Maximum Likelihood (REML) mixed-model
regression (Willey, 2010) (see section 2.2).
2. Materials and Methods
2.1 Data sources
The primary source of data for the analyses was the database on radionuclide transfer to
freshwater organisms as described by Yankovich et al., (in-press) (see also Copplestone et al.,
in-press). This contains concentration ratios relating the fresh weight (FW) whole organism
activity concentration to the activity concentration in water. Where:
) l (Bq water (filtered) in ion concentrat Activity FW) kg (Bq organism in whole ion concentrat Activity
CR -1
-1
water
-wo
This database contains 535 CRwo-water entries describing the transfer of caesium to freshwater
fish; some entries are mean values and other single data points. The data set includes CR
wo-water based onboth radiocaesium and stable caesium values. The CRwo-water valuesare
categorised by species, feeding strategy (benthic, predatory or forage) and freshwater
ecosystems type („lake‟ or „flowing water‟). Some of these data were excluded from this
analysis as no species information was recorded (e.g. the source reference specified
„freshwater fish‟ only). For each study site, the REML analysis (see section 2.2) requires that
data are available for more than one species and that at least one of these species must occur
at other sites. Excluding data which did not meet these criteria left a total of 248 entries. As
we were using the REML model it was possible to supplement the CRwo-water values with data
from studies reporting Cs concentrations in fish; these additional data had not been used by
Yankovich et al. (in press) as corresponding water concentrations were not available and
hence CRwo-water values could not be calculated. Concentration data had to adhere to the same
1 2 3 4 5 6 7 8 9 10 11 12 13 14 15 16 17 18 19 20 21 22 23 24 25 26 27 28 29 30 31 32 33 34 35 36 37 38 39 40 41 42 43 44 45 46 47 48 49 50 51 52 53 54 55 56 57 58 59 60
entries reporting activity concentrations which met these criteria were identified (Copeland
and Ayers 1972; Copeland et al., 1973; Smith et al., 2003 Andersson pers. comm.1). In total 597 entries were available for 53 freshwater fish species from 67 sites; note whilst in most
instances sites were identified in the source references, in a few cases it was necessary to
assume that all the data in a given reference came from one site (these represented <10 % of
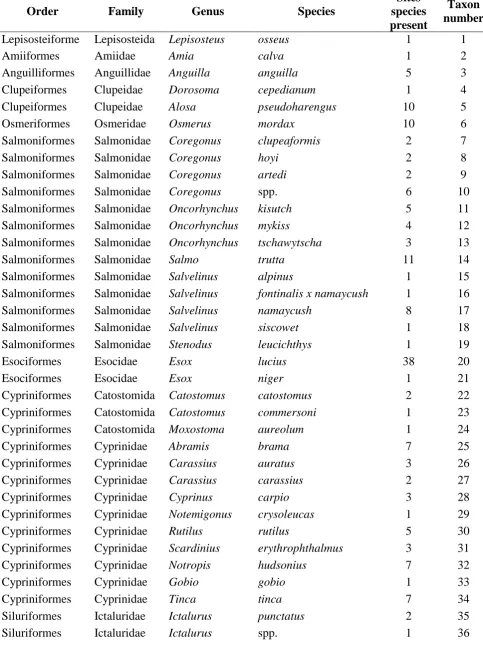
the total dataset). Table 1 presents a summary of the available data; data were also available
for one species in the order Cyprinodontiformes but could not be used as this species
occurred at only one site within the database and data for other species were not available for
this site.
The taxonomy of each species for which data were available was determined with reference
to Nelson (2006) and Froese and Pauly (2012). The 53 species for which there were data all
belonged to the class Actinopterygii (ray-finned fishes) with 10 orders, 14 families and 33
genera being represented in the dataset (Table 1). Prior to analyses, orders, families and
genera were numerically coded based on the phylogenetic tree presented by Nelson (2006)
(Figure 1) with approximate timescales for the evolutionary divergence for each order being
identified from http://www.timetree.net. The „oldest‟ order was defined as „1‟ and the most
recent as „10‟ (data being available for a total of ten orders) (Figure 1). In some cases groups
of orders diverged at the same time (e.g. Osmeriformes, Salmoniformes and Esociformes) in
which case the order numbering was simply from left to right on Figure 1 and does not reflect
differences in evolutionary age. To put some context to the order numbers, the clade
containing Lepisosteiformes and Amiiformes diverged from the other orders considered here
>300 million years ago whereas the clade containing Perciformes diverged from that
containing Cyprinodontiformes around 100 millon years ago (see Figure 1). Each species was
given a „taxon number‟ starting with species in the oldest orders, so for the available dataset
Lepisosteus osseus was defined as taxon 1 (see Table 1).
2.2 Data analyses
The Residual Maximum Likelihood (REML) fitting of a mixed-model regression as
described by Willey (2010) and originally developed by Broadley et al. (1999;, 2001) was
used to analyse the data for any phylogenetic influence on Cs transfer. This technique enables
the collation of data from different sources and the prediction of values that might be gained
1 Swedish Radiation Safety Authority see
http://www.stralsakerhetsmyndigheten.se/Yrkesverksam/Miljoovervakning/Sokbara-miljodata/ for
1 2 3 4 5 6 7 8 9 10 11 12 13 14 15 16 17 18 19 20 21 22 23 24 25 26 27 28 29 30 31 32 33 34 35 36 37 38 39 40 41 42 43 44 45 46 47 48 49 50 51 52 53 54 55 56 57 58 59
if they were all generated under an average set of conditions. The output consists of a mean
value for each species on a common scale after REML adjustment (the fixed factor) taking
account of the effect of the random factor (i.e. inter-site variation). This provides a method
for statistically accounting for as much of the effect of site as possible within the collated
data. The mean value output for each species provides a relative scaling value which can
subsequently be used to infer CRwo-water values, or concentrations, from a known value for a
given species or a group mean (Willey, 2010) (or indeed site specific activity concentrations
if data are available for one species (see section 3.3 below)).
The REML procedure fits the model such that values for each species are made as nearly
identical as possible across the studies. Consequently, we were able to include both CRwo-water
values from Yankovich et al. (in-press) and concentration data where the crietia specified
within section 2.1 were met. Here we are making the assumption that the relative difference
between Cs concentrations between species at a site will be the same as the relative
difference between Cs CRwo-water values at a site. The REML procedure minimises, as far as
possible, variation due to factors such as water chemistry or study methodology (e.g. CR
wo-water values may in some references be related to unfiltered water) by treating the „site‟ as a
random factor.
The REML analysis and associated analysis of variance was conducted on log-transformed
data by adapting the Genstat (http://www.vsni.co.uk)code as presented in Willey (2010) (see
Appendix 1 which presents the Genstat code for the overall REML analysis and hierarchical
ANOVA). In addition to outputting REML-adjusted means by species (i.e. using the Genstat
routine as presented in Appendix 1), REML-adjusted means were also estimated at the level
of order, family and genus. To determine significant differences between specific taxonomic
groupings the standard error of difference was estimated in a pair wise manner for all
REML-adjusted means. The t-statistic was then calculated as the ratio of the difference between mean pairs and the associated standard error of difference. All other analyses were conducted
using the General Linear Model option from the Minitab statistical package
(http://www.minitab.com) or linear regression from Microsoft Excel.
3. Results and discussion
1 2 3 4 5 6 7 8 9 10 11 12 13 14 15 16 17 18 19 20 21 22 23 24 25 26 27 28 29 30 31 32 33 34 35 36 37 38 39 40 41 42 43 44 45 46 47 48 49 50 51 52 53 54 55 56 57 58 59 60
When all data were considered at the species level, the REML variance component analysis
gave a significant (p<0.001) Wald statistic of 116 with significant variation in REML
estimated mean values being explained by hierarchical ANOVA at the order level (ANOVA;
p<0.001) but little additional variation explained by the effects of family within order or
genus within family.
The Wald statistic for the analysis at the levels of order, family and genus were 51 (p<0.001),
54 (p<0.001) and 107 (p<0.001) respectively, also indicating significant data fits (Thompson
and Welham 2001. Significant variation in REML estimated mean values was, however,
explained by hierarchical ANOVA at the order level (ANOVA; p<0.001) with little
additional variation explained by the effects of family within order or genus within family.
REML-adjusted mean values are presented in Table 2 for the four different taxonomic levels
considered. For each taxonomic level these values should be regarded as relative numbers
and not actual estimates of CRwo-water (see 3.3 for examples of application).
From the estimated t-statistics Perciformes had a significantly higher REML-adjusted mean value than Anguilliformes, Clupeiformes, Osmeriformes, Salmoniformes and Cypriniformes
(p<0.05). Esociformes also had a significantly higher adjusted mean value than
Anguilliformes, Clupeiformes, Salmoniformes and Cypriniformes (p<0.05). Anguilliformes
had a significantly lower (p<0.05) adjusted mean than all other orders for which comparisons
were justified. Lepisosteiformes, Arniiformes and Siluriformes were not considered in
statistical tests as they were present at three or fewer sites only. Significant differences, when
tested at more refined taxonomic levels, were generally in agreement with those observed at
the order level. For instance at the level of family Anguillidae had a significantly lower
REML-adjusted mean than Osmeridae, Salmonidae, Esocidae, Centrarchidae, Moronidae,
Clupeidae, Cypinidae and Percidae (p<0.05). Similarly, both Escocidae and Percidae had a
significantly higher REML-adjusted means than Salmonidae, Clupeidae and Cypinidae
(p<0.05). Comparatively few of the potential comparison at genus and species level could be
shown to be significant due to low data availability for some species. Where significant
differences were observed (p<0.05), these generally involved comparisons which included
Anguilla, Esox, Perca or Sander species.
The results of these analyses, therefore, demonstrate differences in Cs transfer to freshwater
fish based upon phylogenetically derived taxonomic groupings. Does this then mean that we
have demonstrated an evolutionary, or phylogenetic, relationship for the Cs transfer to
1 2 3 4 5 6 7 8 9 10 11 12 13 14 15 16 17 18 19 20 21 22 23 24 25 26 27 28 29 30 31 32 33 34 35 36 37 38 39 40 41 42 43 44 45 46 47 48 49 50 51 52 53 54 55 56 57 58 59
we cannot establish this. For instance, evolutionarily Lepisosteiformes are most closely
related to Amiiformes yet the REML-adjusted means for the two orders differ by a factor of
>2 which is more than the difference between Lepisosteiformes and Perciformes, the most
distantly related orders (REML-adjusted means being within c. 20% of each other). Similarly, whilst the REML-adjusted means for Salmoniformes (560) and Osmeriformes (550) are
similar they are considerably lower than that for the order Esociformes (810) which is in the
same clade. Our inability to conclude a „phylogenetic effect‟ on Cs transfer to freshwater fish
is likely due, in part, to the relatively few species and taxonomic groups for which we had
data. Whilst we had a relatively large dataset to consider, data were only available for 53 of
the total 11952 freshwater species (Nelson, 2006), representing only 10 orders and one class.
Fish within a given taxa are likely to share many characteristics such as feeding strategy. The
CRwo-water data presented by Yankovich et al. (in-press) are categorised by feeding type:
piscivorous (feeding primarily on smaller fish but also amphibians, mammals and birds),
forage (feeding on primary producers and invertebrates and zooplankton) feeding, or benthic
(feeding on benthic-dwelling organisms) feeding. When analysed by feeding group the Cs
CRwo-water value for piscivorous fish is significantly higher (p<0.05) than those for both
benthic and forage feeding fish (Figure 2). This is in agreement with the findings of a number
of previous authors who have reported higher Cs concentrations in piscivorous, or predatory,
fish compared to fish feeding on benthos, invertebrates and primary producers (e.g. Kryshev
1995, Kryshev et al., 1993; Rowan et al., 1998; Rowan and Rasmussen, 1994; Saxén and Ilus,
2008; Smith et al., 2000). We should acknowledge that the data from some of these papers
were included within our analyses, although they comprise a relatively small proportion of
the total data available to us via the database described by Yankovich et al. (in-press).
3.2 Effect of other variables on CRwo-water
This paper represents the first analysis, for any radionuclide, of the CRwo-water dataset
presented by Yankovich et al. (in-press). In addition to categorising data by species and
feeding group, data in the underlying database are also categorised as coming from either
„flowing‟ (i.e. rivers and streams) or „lake‟ (i.e. lakes, reservoirs and ponds) freshwater
ecosystems. There is a significant difference between the mean CRwo-water values estimated
for the two ecosystem types with values from lakes being higher than those for flowing
1 2 3 4 5 6 7 8 9 10 11 12 13 14 15 16 17 18 19 20 21 22 23 24 25 26 27 28 29 30 31 32 33 34 35 36 37 38 39 40 41 42 43 44 45 46 47 48 49 50 51 52 53 54 55 56 57 58 59 60
fish derived from measurements of 137Cs (n=506) compared to those derived from stable Cs measurements (n=214). The mean stable Cs CRwo-water value is significantly higher than that
derived from 137Cs data (p<0.05). Although this may initially be interpreted as a need to question the increasing usage of stable element data to provide CR values for radiological
assessments (Beresford 2010, Howard et al., 2013, Copplestone et al., in-press, ICRP, 2009)
further consideration of the underlying database is required. All of the stable Cs data are
derived from North America (Yankovich, 2010; Rowan and Rasmussen, 1994; Vanderploeg
et al., 1975), with the majority being from Canada (n=197). Whereas the majority of 137Cs data originated from studies in Europe with observations from Russian language publications
(see Fesenko et al., 2010) contributing c. 45% of the 137Cs CRwo-water values. Furthermore, and
likely of more importance than data source, piscivorous species (171 of 214 values)
dominated the stable Cs data, which tend to have comparatively high CRwo-water values
(Figure 2); c. 50% of the CRwo-water values for 137Cs were for forage and benthic feeding
species. Rowan (2013), observed that 137Cs CRwo-water values in piscivorous fish exposed to
repeated short releases into a river were higher than those for 133Cs determined in the same fish. Further consideration of the application of stable element data to predict radioisotope
transfer in wildlife assessment models can be found in Wood et al. (submitted).
We should also acknowledge that although CRwo-water is defined on the basis of filtered water
activity concentrations, in some instances, source references are unclear as to if water has
been filtered or not. This could contribute to the observed uncertainty in CRwo-water values,
however, as noted above the effect of methodological differences on CRwo-water should be
minimised by the application of REML analyses.
Typically CRwo-water values for freshwater fish and other aquatic organisms vary over orders
of magnitude, as do CRwo-media values for organisms in other ecosystem types. This is
demonstrated for freshwater fish in Table 3 which presents a summary of Cs CRwo-water values
from the compilation of Yankovich et al. (in-press) as will be used in a forthcoming IAEA
handbook of transfer parameters for wildlife (see Howard et al., 2013). In large part this
variability is due to site specific factors which influence radionuclide transfer. In the case of
Cs and freshwater fish a key site specific factor is the K concentration in water (e.g. Smith et
al. (2000) demonstrate approximately two-orders of magnitude variation in CRwo-water
explained by water Kconcentration) with water pH and Ca concentration also being
suggested to influence Cs transfer (Smith et al., 2002). Consequently, there is often large
1 2 3 4 5 6 7 8 9 10 11 12 13 14 15 16 17 18 19 20 21 22 23 24 25 26 27 28 29 30 31 32 33 34 35 36 37 38 39 40 41 42 43 44 45 46 47 48 49 50 51 52 53 54 55 56 57 58 59
in wildlife (Beresford et al., 2008c; Yankovich et al., 2010; Johansen et al., 2012) and the
approach is open to criticism as being too simplistic (ICRP 2009). However, pragmatically
the CRwo approach is easy to apply and has the most comprehensive datasets available, and
hence it continues to be recommended in international compilations (Howard et al., 2013;
ICRP, 2009). The REML-adjusted means presented in Table 2 potentially provide a more
refined approach. By taking into account inter-site variation, they in effect provide a
mechanism of accounting for site specific variables such as, the K concentrations in water in
the case of Cs transfer to fish being considered here. Comparison of Tables 2 and 3 suggests
that the variation in the transfer of Cs to fishes between studies/sites (two to three orders of
magnitude) is considerably greater than the likely variation between taxonomic groups at a
given site (circa one order of magnitude or less). This further demonstrates the crude nature of generic CR values if trying to make site specific predictions.
3.3Testing the REML outputs
We propose the hypothesis that the REML model outputs can be used to predict the
radionuclide, in this case radiocaesium, activity concentrations in unknown species from the
results of a species which has been sampled at a specific site. To test this hypothesis we
require data which had not been included in the already comprehensive compilation needed
to conduct the analysis described above. A large monitoring programme of fish from 590
Finnish lakes has been conducted since deposition from the 1986 Chernobyl accident and
data from this programme have recently been made available on request via the EURATOM
network of excellence in radioecology(www.star-radioecology.org). These data were not
used within the analysis we have conducted above and so provide an opportunity to
independently test our hypothesis. The monitoring programme is in part described by Saxén
and Koskelainen (2005), Saxén (2007), Saxén and Ilus (2008), Vetikko and Saxén (2010),
with a meta data record available on-line (STUK, 2012).
We have selected data from 1988, which were collected from 27 Finnish lakes for which
137
Cs activity concentrations were available for four or more fish species. In total data were
1 2 3 4 5 6 7 8 9 10 11 12 13 14 15 16 17 18 19 20 21 22 23 24 25 26 27 28 29 30 31 32 33 34 35 36 37 38 39 40 41 42 43 44 45 46 47 48 49 50 51 52 53 54 55 56 57 58 59 60
from which to calculate activity concentrations for the other species which were treated as
unknowns. To calculate the 137Cs activity concentrations, the ratios of the REML-adjusted mean (Table 2) for each unknown species to that of P. fluviatilis was estimated (e.g. for R. rutilus the ratio was 0.48). For each lake the 137Cs activity concentration in different species were then estimated as the product of this ratio and the geometric mean 137Cs activity
concentration in P. fluviatilis at that site. This approach was possible for A. brama, E. lucius, R. rutilus, S. trutta and S. lucioperca all of which were in the dataset used for the REML analysis. Although other Coregonus spp. were present within our initial dataset, the two species sampled in Finnish lakes were not. Therefore, the ratio of the REML-adjusted mean
for the genus Coregonus to that for Perca was used to estimate 137Cs activity concentrations in both species; a similar genus based approach was used for A. ballerus. No data for the genus Blicca or Leuciscus were available for our REML analysis. Therefore, as both species are Cypinidaethe ratio of the REML-adjusted mean for this family to that of Percidaewas
estimated and used to predict 137Cs activity concentrations in both B. bjoerkna and L. idus. No predictions could be made for L. lota as it is a Gadiforme and no representatives of this order were present in the database used to populate the REML analysis (values for L. lota are within the CRwo-water dataset described by Yankovich et al. (in-press) but they did not meet the
selection criteria required for the REML analysis). In total this allowed predictions in 100
fish samples across the 27 lakes.
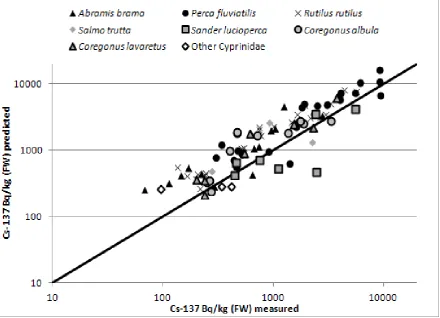
A comparison of predicted 137Cs activity concentrations with measured values is presented in Figure 3. There was relatively good agreement between predicted and measured values with a
linear regression fit to all 100 data points yielding an R2 of 0.83 (p<0.001) and a slope (±standard error) of 0.98±0.04 (p<0.001). The intercept was not significantly different to
zero for this or any of the subsequent regressions discussed and hence a zero intercept was
used. Linear regressions were also fitted individually for A. brama, E. lucius, and R. rutilus, withthese three Salmonidae being considered together given there were few observations for
them. All regressions yielded R2 values close to 0.8 (0.76 – 0.84) (p<0.001). Slopes
(±standard error) were: A. brama (0.96±0.12), E. lucius (0.81±0.06), R. rutilus (1.32±0.12), S. lucioperca (0.69±0.07) and Salmonidae species (0.87±0.08) thus suggesting a tendency to under-predict for some species (notably E. lucius and S. lucioperca) and over-predict for R. rutilus.
The results of this comparison therefore look promising. There is obviously some scope for
1 2 3 4 5 6 7 8 9 10 11 12 13 14 15 16 17 18 19 20 21 22 23 24 25 26 27 28 29 30 31 32 33 34 35 36 37 38 39 40 41 42 43 44 45 46 47 48 49 50 51 52 53 54 55 56 57 58 59
For instance, E. lucius was present in the sample from 26 of the lakes if we select this as our known species for comparison with the results using P. fluviatilis then we can make
predictions for 96 fish samples. Whilst all predicted values were within a factor of c. 5 of the measured data there was a tendency towards over prediction (Figure 4).
For comparison with our results, if the appropriate feeding group geometric mean CRwo-water
values from Yankovich et al. (in-press) are used to predict the 137Cs activity concentrations in fish from the Finnish lakes there is a general under-prediction with a regression of predicted
to measured activity concentrations yielding a slope of only 0.31.
The approach tested here should account for site specific factors, and as demonstrated
appears to work relatively well. However, we should acknowledge some limitations in the
available data which may influence the resultant REML adjusted means. As noted above,
there is geographical bias in available data and, therefore, site-specific variability may not be
adequately compensated for in some species. For instance, whilst A. anguilla data are available from 5 sites (Table 1) these were all within Sweden and hence the sites may be
relatively similar. Similarly, limitations in sample size for the Finnish lakes dataset, which
ranged from 1 to >400 fish, may have impacted upon some comparisons of predicted and
observed activity concentrations.
Given the variation in biological half-lives across different organisms, the REML approach is
unlikely to be applicable in situations where activity concentrations in the environment are
rapidly changing. By 1988 water activity concentrations in Finnish lakes as a consequence of
deposition from the Chernobyl accident were not changing rapidly; Saxén (2007) reports
ecological half-lives for 137Cs in Finnish lake waters of circa 1 to 5 years at this time.
However, we acknowledge that a lack of equilibrium may have influenced the comparison of
our predicted activity concentrations in fish with measured values. For example, increases in
137
Cs activity concentrations have been observed with increasing body mass for some species
of predatory fish, potentially as a consequence of changing diets as fish age (Smith and
Beresford, 2005).
4. Conclusions
Whilst we have demonstrated differences between the Cs transfer to different taxa of
freshwater fish, based upon the data available to us (all species originating from just 10
orders in one class) we cannot describe detailed phylogenetic relationships. Earlier analyses
1 2 3 4 5 6 7 8 9 10 11 12 13 14 15 16 17 18 19 20 21 22 23 24 25 26 27 28 29 30 31 32 33 34 35 36 37 38 39 40 41 42 43 44 45 46 47 48 49 50 51 52 53 54 55 56 57 58 59 60
Willey, 2010) and marine fish (Jeffree et al., 2010; in-press) have included species
encompassing much wider evolutionary time scales (e.g. >500 million years in the case of
marine fish (Jeffree et al., 2010; in-press)).
The commonly used CR approach to estimating the radionuclide activity concentrations in
wildlife is open to criticism, as CR values can be highly variable, largely due to site-specific
factors. The analyses of available data using the REML analysis, as demonstrated here,
should compensate for inter-site variation, assuming sufficient data are available for the
analysis. For freshwater fish the outputs of the REML analysis predicted 137Cs activity
concentrations in an independent dataset well. Caesium was selected for this paper as an
example and because there was a relatively large amount of data available. We recommend
that this approach of producing relative values be further investigated and developed for other
radionuclides and across a wider range of organisms. A disadvantage of the approach is that it
requires relatively large datasets which much meet specific criteria. However, recent data
compilations (Howard et al., 2013; Yankovich et al., in-press; Copplestone et al., in-press)
should enable similar analysis to be conducted for a number of elements for terrestrial,
marine and freshwater species. The ICRP (2009) suggested identifying a series of terrestrial,
freshwater and marine sites from which samples of their Reference Animals and Plants
(RAPs) could be sampled and analysed to serve as „points of reference‟. Such studies have
been initiated and results are starting to be published (Barnett et al., 2013). However, such
data are highly site specific, potentially limiting their wider value. However, applying the
approach as conducted in this paper to data such as that presented by Barnett et al. (2013) to
derive relative values for different organisms should provide a more generic set of „reference
data‟. In taking the REML approach forward if will be beneficial to target studies to provide
data that will fill gaps in the input data reducing uncertainties and biases in the REML
outputs.
Acknowledgements
The authors would like to thanks all of those who contributed data to the database initiated by
the IAEA under their EMRAS II programme in collaboration with the IUR and ICRP (see
Yankovich et al., in-press; Copplestone et al., in-press; Howard et al., 2013; ICRP 2009). The
inputs of N.A. Beresford and M. Muikku to this work were funded under the EURATOM
1 2 3 4 5 6 7 8 9 10 11 12 13 14 15 16 17 18 19 20 21 22 23 24 25 26 27 28 29 30 31 32 33 34 35 36 37 38 39 40 41 42 43 44 45 46 47 48 49 50 51 52 53 54 55 56 57 58 59
References
Barnett CL, Beresford NA, Walker LA, Baxter M, Wells C, Copplestone D. Element and radionuclide concentrations in representative species of the ICRP's Reference Animals and Plants and associated soils from a forest in north-west England. NERC-Environmental Information Data Centre; 2013. doi:10.5285/e40b53d4-6699-4557-bd55-10d196ece9ea.
Beresford NA, Balonov M, Beaugelin-Seiller K, Brown J, Copplestone D, Hingston JL, Horyna J, Hosseini A, Howard BJ, Kamboj S, Nedveckaite T, Olyslaegers G, Sazykina T, Vives i Batlle J, Yankovich TL, Yu, C. An international comparison of models and approaches for the estimation of the radiological exposure of non-human biota. Applied Radiation and Isotopes 2008a; 66:1745-1749.
Beresford, NA, Barnett, CL, Howard, BJ, Scott, WA, Brown, JE, Copplestone D. Derivation of transfer parameters for use within the ERICA Tool and the default concentration ratios for terrestrial biota. J Environ Radioact 2008b; 99: 1393-1407.
Beresford, NA, Barnett, CL, Brown, J, Cheng, J-J Copplestone, D, Filistovic, V, Hosseini, A, Howard, BJ, Jones, SR, Kamboj, S, Kryshev, A, Nedveckaite, T, Olyslaegers, G, Saxén, R, Sazykina, T, Vives i Batlle, J, Vives-Lynch, S, Yankovich, T and Yu, C. Inter-comparison of models to estimate radionuclide activity concentrations in non-human biota. Radiat
Environ Biophys 2008c; 47:491–514.
Beresford NA. 2010 The transfer of radionuclides to wildlife (Editorial). Radiation Environ Biophys 2010; 49:505-508.
Broadley MR, Willey NJ, Meade A. The effect of taxonomic position on radiocaesium uptake by flowering plants. Environ Pollut 1999; 106:341–349.
Broadley MR, Willey NJ, Wilkins J, Baker AJM, Mead A, White P. Phylogenetic variation in heavy metal accumulation in angiosperms. New Phytol 2001; 152:9–27.
Brown JE, Alfonso B, Avila R, Beresford NA, Copplestone D, Pröhl G, Ulanovsky A. The ERICA Tool. J Environ Radioact 2008; 99:1371-1383.
Brown JE, Beresford NA, Hosseini A. Approaches to providing missing transfer parameter values in the ERICA Tool - How well do they work? J Environ Radioact in-press;
http://dxdoiorg/101016/jjenvrad201205005
Copeland RA, Ayers JC. Trace element distributions in water, sediment, phytoplankton, zooplankton and benthos of Lake Michigan: A baseline study with calculations of
1 2 3 4 5 6 7 8 9 10 11 12 13 14 15 16 17 18 19 20 21 22 23 24 25 26 27 28 29 30 31 32 33 34 35 36 37 38 39 40 41 42 43 44 45 46 47 48 49 50 51 52 53 54 55 56 57 58 59 60
Copeland RA, Beethe RH, Prater WW. Trace element distributions in Lake Michigan fish: a baseline study with calculations of concentration factors and equilibrium radioisotope
distributions. Ann Arbor: Environmental Research Group, Inc.; 1973.
Copplestone D, Bielby S, Jones SR, Patton D, Daniel P, Gize I. Impact assessment of ionising radiation on wildlife. R&D Publication 128. Bristol: Environment Agency; 2001.
Copplestone D, Wood M D, Bielby S, Jones S R, Vives J, Beresford NA. Habitat regulations for Stage 3 assessments: radioactive substances authorisations. Technical Report
P3-101/SP1a. Bristol: Environment Agency; 2003.
Copplestone D, Beresford NA, Brown JE, Yankovich T. An international database of radionuclide Concentration Ratios for wildlife: development and uses. J Environ Radioact (in-press).
Fesenko, S, Fesenko, J, Sanzharova, N, Karpenko, E, Titov, I. Radionuclide transfer to freshwater biota species: review of Russian language studies. J Environ Radioact 2011; 102: 8-25.
Froese R, Pauly D (Editors). FishBase World Wide Web electronic publication
fishbaseorg, version (12/2012) http:www.fishbase.org. 2012. Last accessed 17/12/2012.
Higley KA, Domotor SL, Antonio EJ. A kinetic-allometric approach to predicting tissue radionuclide concentrations for biota. J Environ Radioact 2003; 66: 61–74.
Howard BJ, Beresford NA, Copplestone D, Telleria D, Proehl G, Fesenko S, Jeffree R, Yankovich T, Brown J, Higley K, Johansen M, Mulye H, Vandenhove H, Gashchak S, Wood MD, Takata H, Andersson P, Dale P, Ryan J, Bollhöfer A, Doering C, Barnett CL, Wells W. The IAEA Handbook on Radionuclide Transfer to Wildlife. J Environ Radioact 2013;
121:55-74. http://dxdoiorg/101016/jjenvrad201201027
International Commission on Radiation Protection (ICRP). Environmental Protection: the concept and use of Reference Animals and Plants. ICRP Publication 108. Ann ICRP 2008; 38(4-6).
International Commission on Radiological Protection, (ICRP). Environmental Protection: Transfer Parameters for Reference Animals and Plants.ICRP Publication 114. Ann ICRP 2009; 39(6).
Jeffree RA, Oberhansli F, Teyssie J-L. Phylogenetic consistencies among chondrichthyan and teleost fishes in their bioaccumulation of multiple trance elements from seawater. Sci Tot Environ 2010; 408:3200–3210.
Jeffree RA, Oberhansli F, Teyssie J-L. Marine radionuclide transfer factors in chordates and a phylogenetic hypothesis. J Environ Radioact in-press;
http://dxdoiorg/101016/jjenvrad201206002
1 2 3 4 5 6 7 8 9 10 11 12 13 14 15 16 17 18 19 20 21 22 23 24 25 26 27 28 29 30 31 32 33 34 35 36 37 38 39 40 41 42 43 44 45 46 47 48 49 50 51 52 53 54 55 56 57 58 59
2012 Assessing doses to terrestrial wildlife at a radioactive waste disposal site: inter-comparison of modelling approaches. Sci Tot Environ 2012; 427/428:238-246.
Kryshev II. Radioactive contamination of aquatic ecosystems following the Chernobyl accident. J Environ Radioact 1995; 27:207-219.
Kryshev II, Ryabov IN, Sazykina TG. Using a bank of predatory fish samples for
bioindication of radioactive contamination of aquatic food chains in the area affected by the Chernobyl accident. Sci Tot Environ 1993; 139/140:279-285.
Nelson JS. Fishes of the World (4th Edition). Hoboken, New Jersey: John Wiley & Sons, Inc.; 2006.
Rowan DJ, Rasmussen JB. Bioaccumulation of radiocesium by fish: the influence of physicochemical factors and trophic structure. Canadian Journal of Fisheries and Aquatic Sciences 1994; 51: 2388-2410.
Rowan DJ, Chant LA, Rasmussen JB. The fate of radiocesium in freshwater communities – why is biomagnifications variable both within and between species? J Environ Radioact 1998; 40:15-36.
Rowan DJ. Bioaccumulation factors and the steady state assumption for cesium isotopes in aquatic foodwebs near nuclear facilities. J Environ Radioact 2013; 121:2-11.
http://dx.doi.org/10.1016/j.jenvrad.2012.03.008.
Saxén R.137Cs in freshwater fish and lake water in Finland after the Chernobyl deposition. Boreal Environmental Research 2007; 12:17-22.
Saxén R, Koskelainen U. 137Cs in fishes and water in Finnish lakes - considerations for radiological risk assessment. Radioprotection 2005; 40:S649–54.
Saxén R, Ilus E. Transfer and behaviour of 137Cs in two Finnish lakes and their catchments. Sci Tot Environ 2008; 394:349-360.
Smith JT, Kudelsky AV, Ryabov IN, Hadderingh RH. Radiocaesium concentration factors of Chernobyl-contaminated fish: a study of the influence of potassium, and „blind‟ testing of a previously developed model. J Environ Radioact 2000; 48:359-369.
Smith JT, Kudelsky AV, Ryabov IN, Daire, SE, Boyer, L, Blust, RJ, Fernandez, JA,
Hadderingh RH, Voitsekhovitch, OV. Uptake and elimination of radiocaesium in fish and the “size effect”. J Environ Radioact 2002; 62:145-164.
Smith JT, Kudelsky AV, Ryabov IN, Hadderingh RH, Bulgavov, AA. Application of potassium chloride to a Chernobyl -contaminated lake: modelling the dynamics of
radiocaesium in an aquatic ecosystem and decontamination of fish. Sci Tot Environ 2003; 305:217-227.
1 2 3 4 5 6 7 8 9 10 11 12 13 14 15 16 17 18 19 20 21 22 23 24 25 26 27 28 29 30 31 32 33 34 35 36 37 38 39 40 41 42 43 44 45 46 47 48 49 50 51 52 53 54 55 56 57 58 59 60
STUK (Radiation and Nuclear Safety Authority). Cs-137 in freshwater fish in Finland after Chernobyl accident Metadata record: http://datacehacuk/metadata/c806d247-bb4e-47d3-b34f-acfd24af0bfb. 2012. Last accessed 24/09/2012.
Thompson R, SJ Welham. REML analysis of mixed models. In Payne RW, editor. The guide to Genstat - Part 2: statistics. Oxford: VSN Int.; 2001. p. 413–503.
Vanderploeg HA, Parzcyk DC, Wilcox WH, Kerchner JR, Jaye SV. Bioaccumulation factors for radionuclides in freshwater biota. ORNL-5002. Tennessee: Oak Ridge National
Laboratory; 1975.
Vetikko V, Saxén R. Application of the ERICA Assessment Tool to freshwater biota in Finland. J Environ Radioact 2010; 101:82-87.
USDOE (United States Department of the Energy). A graded approach for evaluating radiation doses to aquatic and terrestrial biota. Technical Standard DOE-STD-1153-2002. Washington DC: United States Department of the Energy; 2002.
Willey NJ, Fawcett K. A phylogenetic effect on strontium concentrations in angiosperms. Environ Exp Bot 2005a; 57:258–269.
Willey NJ, Fawcett K. Species selection for phytoremediation of 36Cl/35Cl using angiosperm phylogeny and inter-taxa differences in uptake. Int J Phytorem 2005b; 7:295–306.
Willey NJ, Fawcett K. Inter-taxa differences in root uptake of 103/106Ru by plants. J Environ Radioact 2006; 86:227–240.
Willey NJ, Tang S, Watt N. Predicting inter-taxa differences in plant uptake of 134/137Cs. J Environ Qual 2005; 34:1478–1489.
Willey NJ, Wilkins J. Phylogeny and growth strategy as predictors of differences in cobalt concentrations between plant species. Environ Sci Technol 2008; 42:2162–2167.
Willey NJ. Phylogeny can be used to make useful predictions of soil-to-plant transfer factors for radionuclides. Radiat Environ Biophys 2010; 49:613–623.
Wood MD, Beresford NA, Howard BJ, Copplestone, D. Evaluating summarised radionuclide concentration ratio datasets for wildlife. J Environ Radioact submitted.
Yankovich TL. Compilation of concentration ratios for aquatic non-human biota collected by the Canadian power reactors sector. CANDU Owners Group Inc.; 2010.
Yankovich TL, Vives i Batlle J, Vives-Lynch S, Beresford NA, Barnett CL, Beaugelin-Seiller K, Brown, JE, Cheng J-J, Copplestone D, Heling R, Hosseini A, Howard BJ, Kamboj S, Kryshev AI, Nedveckaite T, Smith JT, Wood MD. An International model validation exercise on radionuclide transfer and doses to freshwater biota. J Radiol Prot 2010; 30:299-340.
1 2 3 4 5 6 7 8 9 10 11 12 13 14 15 16 17 18 19 20 21 22 23 24 25 26 27 28 29 30 31 32 33 34 35 36 37 38 39 40 41 42 43 44 45 46 47 48 49 50 51 52 53 54 55 56 57 58 59
Table 1. Summary of data available for REML analysis to investigate any phylogentic influence on the transfer of Cs to freshwater fish.
Order Family Genus Species
Sites species present
Taxon number Lepisosteiforme
s
Lepisosteida e
Lepisosteus osseus 1 1
Amiiformes Amiidae Amia calva 1 2
Anguilliformes Anguillidae Anguilla anguilla 5 3
Clupeiformes Clupeidae Dorosoma cepedianum 1 4
Clupeiformes Clupeidae Alosa pseudoharengus 10 5
Osmeriformes Osmeridae Osmerus mordax 10 6
Salmoniformes Salmonidae Coregonus clupeaformis 2 7
Salmoniformes Salmonidae Coregonus hoyi 2 8
Salmoniformes Salmonidae Coregonus artedi 2 9
Salmoniformes Salmonidae Coregonus spp. 6 10
Salmoniformes Salmonidae Oncorhynchus kisutch 5 11
Salmoniformes Salmonidae Oncorhynchus mykiss 4 12
Salmoniformes Salmonidae Oncorhynchus tschawytscha 3 13
Salmoniformes Salmonidae Salmo trutta 11 14
Salmoniformes Salmonidae Salvelinus alpinus 1 15
Salmoniformes Salmonidae Salvelinus fontinalis x namaycush 1 16
Salmoniformes Salmonidae Salvelinus namaycush 8 17
Salmoniformes Salmonidae Salvelinus siscowet 1 18
Salmoniformes Salmonidae Stenodus leucichthys 1 19
Esociformes Esocidae Esox lucius 38 20
Esociformes Esocidae Esox niger 1 21
Cypriniformes Catostomida e
Catostomus catostomus 2 22
Cypriniformes Catostomida e
Catostomus commersoni 1 23
Cypriniformes Catostomida e
Moxostoma aureolum 1 24
Cypriniformes Cyprinidae Abramis brama 7 25
Cypriniformes Cyprinidae Carassius auratus 3 26
Cypriniformes Cyprinidae Carassius carassius 2 27
Cypriniformes Cyprinidae Cyprinus carpio 3 28
Cypriniformes Cyprinidae Notemigonus crysoleucas 1 29
Cypriniformes Cyprinidae Rutilus rutilus 5 30
Cypriniformes Cyprinidae Scardinius erythrophthalmus 3 31
Cypriniformes Cyprinidae Notropis hudsonius 7 32
Cypriniformes Cyprinidae Gobio gobio 1 33
Cypriniformes Cyprinidae Tinca tinca 7 34
Siluriformes Ictaluridae Ictalurus punctatus 2 35
Siluriformes Ictaluridae Ictalurus spp. 1 36
Table
Perciformes Centrarchida e
Ambloplites rupestris 2 37
Perciformes Centrarchida e
Lepomis gulosus 1 38
Perciformes Centrarchida e
Lepomis macrochirus 3 39
Perciformes Centrarchida e
Lepomis gibbosus 1 40
Perciformes Centrarchida e
Lepomis microlophus 1 41
Perciformes Centrarchida e
Micropterus dolomieu 6 42
Perciformes Centrarchida e
Micropterus salmoides 5 43
Perciformes Centrarchida e
Pomoxis annularis 1 44
Perciformes Centrarchida e
Pomoxis nigromaculatus 1 45
Perciformes Moronidae Morone chrysops 4 46
Perciformes Percidae Perca flavescens 8 47
Perciformes Percidae Perca fluviatilis 28 48
Perciformes Percidae Sander lucioperca 3 49
Perciformes Percidae Sander canadensis 1 50
Perciformes Percidae Sander vitreus 9 51
Perciformes Percidae Gymnocephalus cernuus 1 52
Table 2. REML-adjusted means for different taxonomic groups. Note these are relative values and not absolute values of CRwo-water.
Order Family Genus Species
Lepisosteiformes 6.8 Lepisosteidae 6.9 Lepisosteus 7.6 osseus 7.4
Amiiformes 3.2 Amiidae 2.9 Amia 3.6 calva 3.0
Anguilliformes 1.8 Anguillidae 1.9 Anguilla 1.9 anguilla 2.1
Clupeiformes 5.0 Clupeidae 4.9 Dorosoma 4.7 cepedianum 4.3
Alosa 4.0 pseudoharengus 3.7
Osmeriformes 5.6 Osmeridae 5.5 Osmerus 4.5 mordax 4.2
Salmoniformes 5.5 Salmonidae* 5.5
Coregonus 3.8
clupeaformis 3.9
hoyi 5.0
artedi 3.5
spp. 3.2
Oncorhynchus 8.1
kisutch 9.3
mykiss 6.5
tschawytscha 8.9
Salmo 6.0 trutta 5.8
Salvelinus 7.8
alpinus 7.9
fontinalis x
namaycush 5.6 namaycush 8.0
siscowet 10.8
Stenodus 5.4 leucichthys 5.6
Esociformes 8.1 Esocidae 8.3 Esox 8.5 lucius 8.8
niger 3.0
Cypriniformes 4.6
Catostomidae 5.3 Catostomus 5.0
catostomus 4.5
commersoni 4.4
Moxostoma 4.7 aureolum 4.2
Cyprinidae 4.5
Abramis 4.5 brama 4.8
Carassius 4.4 auratus 4.3
carassius 4.9
Cyprinus 1.2 carpio 1.2
6.2 crysoleucas 5.7
Rutilus 4.8 rutilus 5.0
Scardinius 4.4 erythrophthaimus 4.7
Notropis 3.9 hudsonius 3.6
Gobio 6.2 gobio 6.5
Tinca 3.1 tinca 3.2
Siluriformes 7.6 Ictaluridae 7.6 Ictalurus 6.2 punctatus 5.7
spp. 5.1
Perciformes 8.6 Centrarchidae 7.0 Ambloplites 14.2 rupestris 13.8
Order Family Genus Species
macrochirus 3.7
gibbosus 3.7
microlophus 2.9
Micropterus 9.6 dolomieui 8.7
salmoides 8.5
Pomoxis 8.3 annularis 7.3
nigromaculatus 9.3
Moronidae 7.5 Morone 9.1 chrysops 8.8
Percidae 9.0
Perca 9.4 flavescens 7.3
fluviatilis 10.5
Sander 10.0
lucioperca 7.8
canadensis 12.3
vitreus 11.8
Gymnocephalus 1.9 cernuus 2.0
Sciaenidae 15.9 Aplodinotus 11.2 grunniens 10.3
Table 3. Summary of Cs CRwo-water values for fish from Yankovich et al. (in-press).
Feeding group
Arithmetic mean ±SD
Geometric mean(GSD)
Minimum Maximum N
Benthic feeding
(1.0±2.0)E+3 4.6E+2(3.5) 1.8E+1 2.0E+4 156
Forage feeding
(9.2±16)E+2 4.7E+2(3.2) 1.7E+1 8.6E+3 125
Figure 1. Sequence of orders within the class Actinopterygii (ray-finned fishes) adapted from Nelson (2006). Orders for which data are available are identified in bold; the number in parenthesis denotes that given to the order based upon evolutionary time for statistical analyses.
Figure
Figure 2. Comparisons of caesium CRwo-water values for freshwater fish summarised by
feeding strategy (top), Cs isotope (middle) and broad habitat type (bottom). Values are geometric mean CRwo-water values; on each chart mean values with different letters are
significantly different (p<0.05); statistical tests were performed on log-transformed data. Note: (i) these figues summarise CRwo-water values from Yanovich et al., in-press and not
Beresford et al Code appendix.docx