Accepted Manuscript
Title: DES study of blade trailing edge cutback cooling performance with various lip-thicknesses
Author: M. Effendy, Y.F. Yao, J. Yao, D.R. Marchant
PII: S1359-4311(15)01351-4
DOI: http://dx.doi.org/doi: 10.1016/j.applthermaleng.2015.11.103 Reference: ATE 7385
To appear in: Applied Thermal Engineering
Received date: 14-8-2015 Accepted date: 23-11-2015
Please cite this article as: M. Effendy, Y.F. Yao, J. Yao, D.R. Marchant, DES study of blade trailing edge cutback cooling performance with various lip-thicknesses, Applied Thermal Engineering (2016), http://dx.doi.org/doi: 10.1016/j.applthermaleng.2015.11.103.
DES STUDY OF BLADE TRAILING EDGE CUTBACK COOLING
PERFORMANCE WITH VARIOUS LIP-THICKNESSES
M. Effendy1, Y.F. Yao2, J. Yao3, D.R. Marchant4
1
Department of Mechanical Engineering, Universitas Muhammadiyah Surakarta, Jln. Ahmad Yani, Tromol Pos I, Pabelan, Kartasura, Surakarta 57102, Indonesia
2
Department of Engineering Design and Mathematics, University of the West of England, Coldharbour Lane, Bristol BS16 1QY, United Kingdom
3
School of Engineering, University of Lincoln, Brayford Pool, Lincoln LN6 7TS, United Kingdom
4
Faculty of Science, Engineering and Computing, Kingston University London, Penrhyn Road, Kingston upon Thames KT1 2EE, United Kingdom
Highlights
Detached-eddy simulation of the mixing process between mainstream flow and coolant;
Effects of various t/H ratios on blade trailing-edge cutback cooling performance;
Vortex shedding behind the lip plays an important role in near wall cooling efficiency;
Discharge coefficient and adiabatic film-cooling effectiveness agree with experiment;
Thermal mixing has been greatly intensified with the increase of the t/H ratio.
ABSTRACT
Three-dimensional detached-eddy simulation (DES) study has been carried out to evaluate the cooling performance of a trailing-edge cutback turbine blade with various lip thickness to slot
height ratios (t/H). By adopting the shear-stress transport (SST) k-ω turbulence model, the
numerical investigations were performed at two successive steps: first, to validate simulation results from an existing cutback turbine blade model with staggered circular pin-fins arrays inside the cooling passage against experimental measurements and other available numerical predictions; second, to understand the effects of the lip thickness to the slot height ratio on the blade trailing-edge cooling performance. It was found from the model validations that at two moderate blowing ratios of 0.5 and 1.1, DES predicted film cooling effectiveness are in very
good agreement with experimental data. Further comparisons of four various t/H ratios (t/H =
0.25, 0.5, 1.0, 1.5) have revealed that the thermal mixing process between the ‘cold’ coolant gas and the ‘hot’ mainstream flow in the near wake region of the exit slot has been greatly intensified
with the increase of the t/H ratio. As a result, it causes a rapid decay of the adiabatic film cooling
effectiveness downstream of the blade trailing-edge. The observed vortex shedding and its characteristics in the near wake region are found to play an important role in determining the dynamic process of the ‘cold’ and the ‘warm’ airflow mixing, which in turn have significant
influences on the prediction accuracy of the near-wall heat transfer performance. As the four t/H
ratio increases from 0.25 to 1.5, DES predicts the decrease of main shedding frequencies as fs =
3.69, 3.2, 2.21, and 1.49 kHz, corresponding to Strouhal numbers St = 0.15, 0.20, 0.23, and 0.22,
respectively. These results are in good agreement with available experimental measurements.
Keywords: detached-eddy simulation; effects of lip thickness to slot height ratio; thermal mixing process; blade trailing-edge cutback cooling.
1. Introduction
Gas turbines and its variants are widely used for aircraft and marine propulsion, power of
locomotives, land-based power generation, and other industrial applications. One of the main
driving forces behind the gas turbine design and development is to achieve the highest possible
overall engine performance in terms of power output and thermal efficiency. Due to this reason,
modern gas turbines often operate at high blade inlet temperatures up to 1,200 – 1,500°C
[1][2][3]. Recent developments in gas turbine engines for aero-propulsion applications require
much higher turbine inlet temperatures in excess of 1,727°C [4][5][6], and an overall compressor
pressure ratio of greater than 50 [6]. These extreme conditions and requirements will however
cause serious aero-thermodynamic problems for key engine components such as liners, vanes
and blades as the engine operation temperature is far beyond the critical working temperature of
the materials used [3]. Furthermore, the higher turbine inlet temperatures could lead to some
adverse effects, such as blade melting, oxidation, corrosion, erosion [7] and degradation of local
or global structural strengths [8]. For example, an extremely high convective heat flux around a
blade trailing-edge can cause cracks [7], thermal-fatigue [7][9][10], and buckling [10] thus
risking turbine blade failure.
In the gas turbine cooling design, blade trailing-edge (TE) cooling with various lip thickness to
slot height ratios (t/H) has attracted research interest in recent years. A number of experiments
have been carried out [11][12][13][14][15][16] and the t/H ratio was found to have significant
influences on the blade trailing-edge cooling performance. Among these studies, Kacker et al.
[11][12] evaluated the film-cooling effectiveness of the impervious-wall of a two-dimensional
wall jet with various t/H ratios, whilst keeping the lip thickness (t) constant. Taslim et al.
[13][14] investigated the influence of different slot geometries on the film-cooling effectiveness
in the surroundings of the breakout-slot region at various blowing ratios. It was recognised that
the increase of the t/H ratio from 0.5 to 1.0 would decrease the overall film-cooling effectiveness
by about 10%. Similar findings were noted and confirmed by Cuhna et al. [15] and further
discussed by Goldstein [16]. Sivasegaram et al. [17] and Burns et al. [18] reported that the
be concluded that the effectiveness of film-cooling has great dependency on the t/H ratio and the correlation between these two parameters needs to be quantified more accurately.
In recent experiments of Horbach et al. [6][19] on a blade trailing-edge cutback cooling
configuration, four different t/H ratios ranging from 0.2 to 1.5 have been carefully examined. It
was found that the decrease of the t/H ratio has the potential to improve the adiabatic
film-cooling effectiveness to unity, while an increase of the t/H ratio will cause the fast decay of the
film-cooling effectiveness in the vicinity of the trailing-edge cutback region. By using a thicker
lip (i.e. larger t/H ratio for a fixed slot height), unsteady vortex shedding from the blunt lip end
will become more intensive, and thus further enhances the thermal mixing of coolant gas and
warm mainstream flow, in agreement with other researchers, e.g. Holloway et al. [20] and
Martini et al. [21] [22]. For the cooling passage study, the discharge coefficient was found to be
increased with the increase of the t/H ratio, possibly due to the local pressure decrease in the lip
wake region. The discharge coefficient variation was pronounced up to a maximum of 50% for
different t/H ratios tested at a given blowing ratio of 0.2. These studies have laid a solid
foundation for numerical investigations to be performed in this paper.
With the advancement of computer power and numerical techniques, numerical simulation
applying modern computational fluid dynamics (CFD) has been widely used for both
fundamental research and industry applications. So far, the majority of industry CFD studies are
still based on steady and/or unsteady Reynolds-averaged Navier-Stokes (RANS) solutions. It is
widely accepted that the steady RANS model cannot accurately simulate the turbulent flow
mixing process. For example, it will largely over-predict the film-cooling effectiveness while
applied to the blade cooling problem, as previously reported by Holloway et al. [23], Martini et
al. [24], Egorov et al. [25] and Effendy et al. [26].
Most recently, a numerical study using a blade trailing-edge cutback cooling configuration with
two rows of long ribs inside the cooling passage was carried out by Effendy et al. [27], who
applied the SST k-ω turbulence model in steady RANS, unsteady RANS and detached–eddy
simulations (DES). It was recognised that DES with the SST k-ω model is more capable of
capturing the turbulent flow structures in the mixing region that result in significant
improvements on the prediction of the adiabatic film-cooling effectiveness, particularly from a
lower blowing ratio of M = 0.5, whereas both RANS and URANS models largely over-predict
the film-cooling effectiveness in the near and the far wake regions. At a moderate blowing ratio
non-dimensional stream wise location x/H > 8 (hereafter H denotes the slot height), whereas at a
high blowing ratio M = 1.1 it under-predicts after x/H > 5. The same configuration has also been
studied computationally by Martini et al. [28] [29] who used DES with the Spalart-Allmaras
(SA) turbulence model. It was found that DES-SA results significantly under-predicted
film-cooling performance at all three test blowing ratios of 0.5 < M < 1.1, with a maximum
discrepancy of approximately 10% between the predictions and the measurements.
In order to improve the accuracy of numerical prediction, it is necessary to apply more advanced
techniques such as detached-eddy simulation, using more suitable and well-validated turbulence
models together with carefully refined near wall grid resolutions. In this study, the capabilities of
the DES with the SST k-ω turbulence model will be performed to predict the blade trailing-edge
cooling performance at various t/H ratios. There are various numerical investigations of the
blade TE cutback cooling available in open literature, but to the authors’ knowledge, there is no
specific published work detailing the effects of the lip thickness to slot height (t/H) ratio. In
addition, little information is available to illustrate the dynamic flow interaction process between
the internal coolant fluid and the external warm mainstream fluid in a comprehensive manner.
Thus, the present study intends to fill the gap in this field.
2. Problem Description and Definition
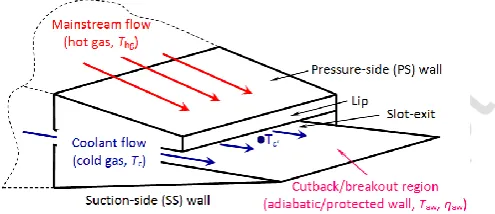
A ‘cutback’ of the trailing-edge is obtained by cutting off a corner of the upper lip plate (i.e.
pressure-side part of the blade) to create a lip thickness. The ‘breakout’ slot is then formed in
parallel with the ejection slot. This design is expected to have a mixing region between the
mainstream flow over the pressure-side region and the coolant gas issuing from the ejection slot.
As highlighted by various researchers, the lip thickness and the ejection slot height are two key
parameters to influence a blade trailing-edge cooling performance. The lip thickness to slot
height ratio (t/H) is defined by the ratio of the lip thickness (t) to the ejection slot height (H), as
illustrated in Figure 1.
2.1Film-cooling effectiveness
The performance of a blade trailing-edge cutback cooling configuration is commonly expressed
by the film-cooling effectiveness along the protected wall surface between the slot-exit and
downstream of the trailing-edge. If the exposed TE cutback surface is with the adiabatic wall
temperature difference between the hot gas and the adiabatic wall surface temperature to the
temperature difference between the hot gas and the coolant gas temperature, as given in equation
(1) below ' c hg aw hg aw T T T T (1)
where Taw is the adiabatic temperature of wall surfaces, Thg is the hot gas temperature of the
mainstream flow at the inflow region and Tc’ is the coolant gas temperature measured at the
centre of the slot-exit between two neighbouring pin-fins (see Figure 2).
2.2Discharge coefficient
The discharge coefficient CD represents the global pressure losses inside the cooling passage,
which is defined by the measured coolant mass flow over the ideal mass flow. It is thus a ratio of
an isentropic expansion from the total pressure measured upstream of the first row of rib
elements in the L1 region of the coolant passage against the static pressure of the mainstream
flow as formulated in equation (2) below
1 ) 1 ( 2 1 2 , 1 , 1 2 1 , 1 2 , 1 , , , p p T R A p p p m m m C t t slot t t real c ideal c real c D (2)
where p1,t and T1,t are the total pressure and the total temperature at the coolant inlet,
respectively, p2 is the static pressure at the slot exit, Aslot is the area of the slot exit, κ is the
specific heat capacity and R is the gas constant.
2.3Blowing ratio
The non-dimensional blowing ratio (M) is defined as a factor of slot-averaged mean density and
velocity product over the density and velocity product at the mainstream hot gas inlet plane. The
equation can be further transformed using the mass flow rate at the slot exit, which is equal to
that of the cooling inlet (via the mass conservation) as
2.4Strouhal number
The Strouhal number (St) is a non-dimensional parameter that represents the shedding of vortices
in the wake region of the mixing flow. It is corresponding to frequency of vortex shedding as
u D f
St s (4)
where fs is the shedding frequency, D is diameter of the bluff body and u is velocity magnitude
(or stream wise velocity component). In case of the blade TE cutback cooling design, the
diameter D is replaced by the blockage distance of the bluff body that is equal to the lip
thickness (t). The displacement thickness of the boundary layer on both sides of the coolant wall
(c) and the mainstream wall (hg ) are also considered as the correction of the lip thickness.
Therefore, equation (4) can be expressed as follows:
u t f
St s c hg
(5)
3. Governing Equations of DES Model
The adopted detached-eddy simulation (DES) is a hybrid large-eddy simulation (LES) and
Reynolds-Averaged Navier-Stokes (RANS) method that was first used for predicting turbulent
flow phenomenon at high Reynolds numbers, including separated flows [30]. The basic concept
of DES is to apply a sub-grid-scale (SGS) model in those regions away from the wall where the
grid density is fine enough for LES, while using a RANS turbulence model in the near wall
regions. Hence, the unsteady flow motions can be captured both in the near-wall region and
away from it [30]. The DES method has been successfully applied for turbulent flow over a
circular cylinder [31], and other complex engineering problems such as aerofoils, hydrofoils,
civil aircraft, and fighter aircraft [32].
The present DES formulation is based on the SST k-ω model proposed by Menter et al. [32]. The
model describes the transport equation of turbulence kinetic energy (k) and the specific
turbulence dissipation rate (ω) as follows:
k k k
j k j i i S Y G x k x ku x k t (6)
G Y D S
x x
u x
t i i j j
where ρ is density, ui are velocity components, Gk represents the generation of turbulence
kinetic energy due to the mean velocity gradients, G is the generation of turbulence dissipation
ω, kand denotes the effective diffusivity of k and ω, respectively, Yk and Ycharacterizes
the dissipation of k and ω, D indicates the cross-diffusion term, and Sk and S are source
terms.
The turbulence dissipation term of the turbulence kinetic energy (k) is modified as described by
Menter et al. [32]. It can be written as follow:
DES
k k F
Y * (8)
where * is a constant (for incompressible, * i* and for high Reynolds number,
09 . 0 * *
i ). The equation of i* and other terms can be found in the reference papers by
Menter et al. [32] and the theory guide of ANSYS Fluent [33].
The function FDES is calculated by
max ,1
DES t DES
C L
F (9)
where CDES = 0.61 is a calibration constant used in the DES model, and ∆ is the maximum local
grid spacing (= max(∆x, ∆y, ∆z)) in the case of a Cartesian grid.
The turbulence length scale is defined as,
*
k
Lt (10)
For delayed DES options, FDES is modified as follows
max 1 SST ,1
DES t DES F C L F (11)
where FSST = 0, F1, and F2 are the blending functions of the SST model. Details of the equation
DES
F can be found in theory guide of ANSYS Fluent [33].
4. Computational Details
This computation considers the configuration of a blade with a TE cutback on the pressure-side
equilaterally staggered array of circular pin-fins within the internal cooling passage, as
predominantly used in high-pressure turbine (HPT) design.
4.1Computational domain and boundary conditions
After some precursor studies on the domain size effect between one-pitch and two-pitch in width
and referencing to other published works, a computational domain with two-pitch (S) distance of
the pin-fin arrays in the span wise z-direction is chosen. Figure 3 illustrates the computational
domain for the blade TE cutback cooling with the pin-fin arrays in the internal passage. Due to
the geometrical feature of the mainstream hot gas domain (i.e. a plain channel test wind tunnel),
only half a domain height (Hhg = 52.5 mm) of the wind tunnel is considered in the vertical y
-direction [21] [22] large enough for the flow mixing and its development after the ejection
location. A symmetric boundary condition is applied at the upper surface, as applied in the
previous computational studies [28] [29].
The same flow and boundary conditions as used by the previous researchers (see, e.g. Martini et
al. [28] [29] [21] [22]) are adopted here to evaluate the heat transfer coefficient at the pin-fin
surfaces inside the cooling passage, the discharge coefficient, the film-cooling effectiveness
along the protected wall surfaces, the shedding frequency of the wake flow and the dynamic
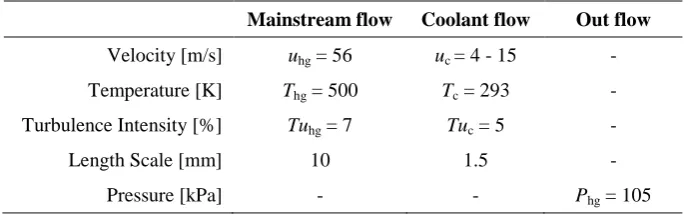
thermal mixing between the mainstream hot gas flow and the cold coolant gas, etc. Table 1 gives
the summary of numerical test conditions applied in the present studies.
4.2Mesh generation
A block-structured mesh with hexahedron elements is generated by the Gambit meshing tool,
resulting in three types of mesh for the grid refinement studies. Figure 4 exemplifies the local
2-D structured meshes around the pin-fin arrays from the top view. The mesh A, mesh B and mesh
C have 48, 72 and 96 elements, respectively, encircling the circumference of the pin-fin. The
isometric view is illustrated by the finest mesh C as shown in Figure 5. The grid dependence will
be verified later at the validation stage. As a comparison, Martini et al. [28] [29] used 2.2 million
hybrid structured/unstructured cells with a near wall grid resolution of y1+ ≈ 1.37, and Egorov
et al. [25] utilised 0.7 million structured cells with y1+ ≈ 1.
Table 2 gives a comparison of mesh C grid resolution for four various t/H ratios. All meshes
have very fine grid resolution, which ensures sufficient spatial near-wall resolution of y1+ < 1.
meshes, typically a near-wall resolution of Δy+ < 0.5, as addressed by Nishino et al. [34] in an effort to assure a sufficiently fine spatial resolution for unsteady flow phenomenon at the mixing
region. As suggested by Spalart et al. [35][36] and Joo et al. [37], the grid should be refined in
the x, y and z directions in order to keep the consistency of local grid spacing in the 3-D domain,
which is important to control the FDES factor in the SST model (see the equation (9)).
4.3Algorithm and time step
A finite-volume method is utilised to solve the governing equations for the incompressible flow
of the present problem. The Semi-Implicit Method for Pressure-Linked Equations Consistent
(SIMPLEC) algorithm [38] is chosen with the second-order numerical scheme applied for all
equations (i.e. pressure, momentum, energy) of the DES calculations. Similar to the grid
resolution, the time-step must also be small enough to guarantee a sufficiently fine temporal
resolution for the unsteady flow effects. With respect to these requirements, a small time-step
size of 1.25 × 10⁻⁵ seconds is applied in these computations when considering the shedding
frequency obtained by Martini et al. [28] [29] for the same flow problem.
5. Grid refinement and validation studies
The grid refinement studies consider the computational domain with three successive meshes
from coarse to fine, as described above (see Figure 4 and Figure 5). After the verification of the
modelling procedures and boundary conditions, the SST k-ω turbulence model based DES is
employed for the simulations and the experimental measurements of Martini et al. [21] [22] [28]
[29] and Horbach et al. [6] are used for validation. Two blowing ratios (M = 0.5, 1.1) are
considered for this purpose.
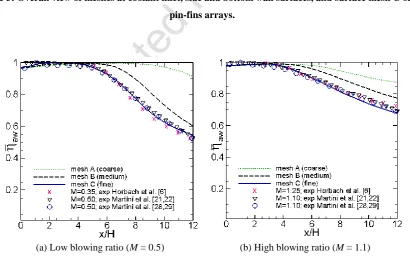
Figure 6 shows the DES predicted adiabatic film-cooling effectiveness (aw ), in comparison
with available experimental data. The results indicate that the present DES modelling requires a
fine grid resolution, i.e. mesh C, to properly resolve the flow and heat transfer characteristics in
the near-wall region. Whilst results from the coarse mesh A and the medium mesh B are largely
over-predicting the film-cooling effectiveness after the position x/H > 4. The use of the fine
mesh C produces results that are in a very good agreement with the experimental data along the
protected/adiabatic wall surface from the slot-exit (x/H = 0) along the way to the downstream
successfully. Based on the effect of grid resolution shown in Figure 6, it was decided to adopt the
fine mesh C for further computations.
6. Results and Discussion
Further investigation of the blade TE cutback cooling performance with four various t/H ratios
has been carried out by steady RANS and DES calculations. The simulation started with steady
RANS mode, and once initial convergence was achieved it then switched to DES mode at a fixed
time step of 1.25×10⁻⁵ seconds to continue the simulation up to the point that a statistically
converged solution was achieved. Finally, samples were accumulated over a total of 2,000 time
steps to obtain time-averaged results for comparison. Simulation results are validated in terms of
pin-fin surface heat transfer, discharge coefficient and film-cooling effectiveness as described
below. After validation, further DES simulations of four t/H ratios would be carried out for
assessment. It commences with the coolant flow behaviour inside the cooling passage, followed
by the blade TE cutback cooling performance. The dynamic interaction of the mainstream flow
and the coolant, including the frequency spectrum of vortex-shedding at the mixing region, are
also discussed thereafter.
6.1 Heat transfer coefficient at the pin-fin surfaces
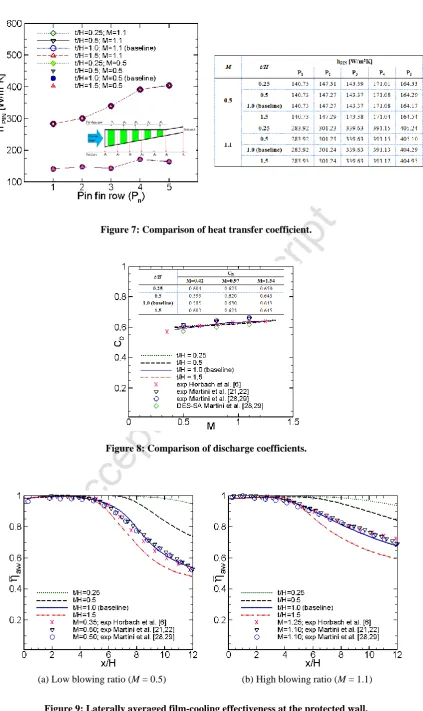
The heat transfer coefficient at the pin-fin surfaces inside the internal cooling passage increases
moderately row-by-row, as seen in Figure 7. This is probably due to the effect of flow
acceleration during the section area contraction. However, the increase becomes negligible after
the fourth row of the pin-fin array, specificaly for lower blowing ratio, and also there is no
significant difference between the four t/H ratios tested. This observation indicates that the
coolant flow inside the internal cooling passage flows has little impact on the flow mixing
process.
The trend of the present predicted heat transfer coefficient is comparable to that of Cunha et al.
[15], Tarchi et al. [39] and Effendy et al. [40], who studied similar subjects through the
staggered arrays of pin-fin cooling. For example, the peak heat transfer occurred in the last row
of the pin-fin located in a wedge duct, and the increase of the heat transfer coefficient is stronger
within a contraction channel than that in a parallel duct. In this study, it was found that the
difference between the highest and the lowest heat transfer levels of all pin-fin rows is
and Tarchi et al. [39] found up to 180% in their numerical study with seven pin-fin rows, whilst
Metzger et al. [41], who measured the heat transfer through ten staggered pin-fin rows within a
parallel duct, discovered 12% of heat transfer differences between the highest and the lowest
levels. Similar results have been found by Lawson et al. [42], Chyu et al. [43] and Mitre et al.
[44], all of whom investigated the heat transfer in the parallel duct with seven-rows of pin-fin
arrays. These researches confirmed that the heat transfer increases through the first three rows
and then reduces for the remaining rows.
As shown in Figure 7, the blowing ratio (M) increase from 0.5 to 1.1 does cause an increase of
heat transfer coefficient about a factor of three on average. It means that the blowing ratio is a
key parameter that affects the heat transfer coefficient of the pin-fin cooling. This has been
confirmed by further investigations over a wide range of M values between 0.42 and 1.83
(results not shown here).
6.2 Discharge coefficient
Figure 8 provides the DES predicted discharge coefficients (CD) for the four t/H ratios, in
comparison with the experimental measurements. It was found that the numerical results
demonstrate the same trend for all four t/H ratios, i.e. the discharge coefficients increase with the
raising of the blowing ratio, as seen in the inserted table. The DES prediction also matches the
experiments (e.g. Horbach et al. [6], Martini et al. [21][22][28] [29]), as well as other available
CFD data. As expected, the discharge coefficients remain almost unchanged for all four t/H
ratios simulated, most likely due to the fact thatthe dimensions and geometry of the cooling slot
were kept the same in all simulation cases. There is however a very small discrepancy that is
likely caused by the flow unsteadiness and the recirculation effect at the mixing region, which
could influence the static pressure at the slot exit.
6.3 Film-cooling effectiveness
Figure 9 provides the quantitative comparison of the averaged film-cooling effectiveness for four
different t/H ratios, at two blowing ratios of 0.5 and 1.1. The DES predictions are compared with
experimental measurements by Martini et al. [28] [29] and Horbach et al. [6], respectively.
In general, the blade TE cutback cooling performance is strongly dependent on the blowing ratio
the same level of film-cooling effectiveness in the near slot-exit region between 0 < x/H < 3, then
it gradually decays up to maximum 50% depending on the blowing ratio and the t/H ratio. For
the baseline model of t/H = 1.0 and two blowing ratios, the prediction agrees well with the
experiments.
From Figure 9(a), it is recognised that the decrease of the t/H ratio causes an increase in the
film-cooling effectiveness downstream of the slot-exit. For example, the blade TE cutback design of
the lowest ratio (t/H = 0.25) generates the highest level of cooling effectiveness of near unity in
the ‘breakout’ region. Compared to the baseline model of t/H = 1.0, it improves the cooling
performance up to 10.33%, despite a slight decay seen in the region between 8 < x/H < 12. For a
ratio of t/H = 0.5, an average improvement of 6.58% could be achieved, but the decay is more
pronounced in the downstream region with a discrepancy of up to a maximum of 25% compared
to unity. It emphasises the experimental finding by Horbach et al. [6], where the decrease of the
t/H ratio is able to largely improve the film-cooling effectiveness. One previous experiment with
an empty cooling passage [14] also noted that the decrease of the lip thickness to the slot height
ratio has the potential to increase adiabatic film-cooling effectiveness by approximately 10%, in
agreement with the present study.
Not surprisingly, the adiabatic film-cooling effectiveness is found to be largely decreased for the
case with higher t/H ratio of 1.5. The average discrepancy of cooling performance can be up to
3.02% when compared with that of the baseline model (t/H = 1.0), as seen in Figure 9(a).
Similarly, Figure 9(b) shows a quantitative comparison of the adiabatic film-cooling
effectiveness at a high blowing ratio of 1.1. It was found that the trend is quite similar to the
simulation results at a low blowing ratio of 0.5, e.g. it decreases up to 3.19% for the t/H ratio of
1.5, but increases by approximately 5.21% and 6.34% for the two t/H ratios of 0.5 and 0.25,
respectively.
In regards to the adiabatic film-cooling effectiveness, Horbach et al. [6] stated clearly from their
experiments that the thinnest lip thickness could produce the highest film-cooling effectiveness.
Taslim et al. [14] also believed that the film-cooling effectiveness could be maximised by
utilising a thin lip thickness in order to reduce an intensified thermal mixing along the TE
cutback region between the mainstream flow and the coolant fluid, and to create smaller size
wake flow. For thick lip geometry, it is most likely to have a larger wake, and this could further
enhance the flow unsteadiness, hence influencing the mixing process and causing rapid decay of
6.4 Mixing region
6.4.1 Temperature distributions
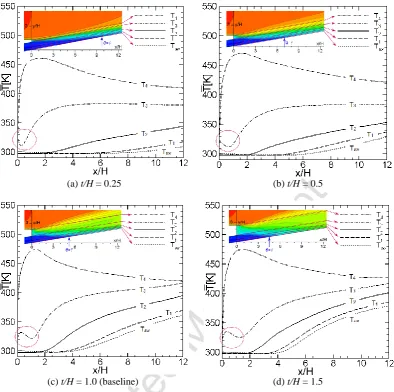
Figure 10 shows the temperature distributions from four various t/H ratios at a blowing ratio of
1.1. These charts follow a total of five polylines inserted in Figure 10. They are calculated in the
same manner as the laterally averaged film-cooling effectiveness. It was found that the change of
lip thickness influences the temperature distribution at the mixing region. For example, along
line 4, the temperature T4 has a peak around x/H = 1.5, with its magnitude slightly varying,
depending on the lip thickness. It seems that this magnitude is related to the size of the
trailing-edge vortex formed just behind the lip end. After the peak location, the temperature T4 decreases
gradually along the ‘breakout’ region in all four cases. The temperature distribution also relates
to the turbulent flow structures formed at the mixing region, which will be discussed later.
In contrast, the temperature distribution of T3 shows a different trend compared to those
described above, in particular there is no peak value between 0 < x/H < 2. This implies that the
vortex-shedding exists behind lips of different sizes, and that it depends on the wake area. The
increase of t/H ratio creates bigger vortex-shedding that gives a different effect against the
laterally averaged temperature of T3, mainly near the slot exit region as marked by the red circle.
This is due to the flow circulation around this region as the effect of different lip thickness (t). It
can be seen by examining the size of the vortices behind the lip that they are more pronounced
for a higher lip thickness. An experimental study by Holloway et al. [23] also noted that the
location and the size of vortices behind the lip are dependent on the blowing ratios, this being in
agreement with the present findings.
From Figure 10, it can be seen clearly that the trend of line T1 is almost identical to that of Taw at
a short distance, in parallel to the protected wall, mainly near the downstream region. The
discrepancy of the trend is stronger when away from the protected wall and can be justified by
comparing the laterally averaged temperature at T1 and T2. The discrepancy is more obvious
when compared to the laterally averaged temperature at T3 or T4, where the positions of both
polylines are very close to the mainstream hot gas region. This indicates that there is an
interaction process between the mainstream flow and the coolant jet along the cutback region.
As formulated in equation (1), the protected wall temperature (Taw) gives a direct influence to the
calculation of the adiabatic film-cooling effectiveness (ηaw), while the Taw is strongly dependent
between the mainstream flow and the coolant jet. By investigating the mixed-air properties at the
mixing flow region, it usually predicts the protected wall temperature first, and then calculates
the laterally averaged film-cooling effectiveness along the protected wall. This procedure has
been used in data analysis presented hereafter.
As mentioned above, larger vortex-shedding occurs for cases with a higher t/H ratio, and is more
likely to develop with a large wavy pattern. In fact, the recirculation effect of unsteady
vortex-shedding will cause the further growth of wavy flow along the breakout region, which will
eventually become more significant at the downstream region. Therefore, it influences an
intensified mixing process between the mainstream flow and the coolant jet, meaning the
mainstream gas, with its higher temperature, is more likely to be able to reach the protected wall.
The increase of wall temperature near the downstream region is more noticeable for the highest
t/H ratio due to a stronger magnitude and a wider flow oscillation period.
In contrast, smaller wakes obtained by simulation from the thinnest lip thickness causes a better
film-cooling performance almost across the entire surface of the adiabatic wall. Smaller wakes
over the ‘breakout’ region are therefore most effective when seeking to keep the coolant at its
lowest temperature level along the adiabatic wall.
As seen on the inserted-figures (see Figure 10), the non-dimensional temperature (θ) distribution
at the x-y plane for a fixed z/H = 0 remains at a lower level for the thinnest lip thickness. The
increase of lip thickness causes a strong interference of the mainstream flow to suppress the
shielded film cooling along the protected wall surface. This is indicated by the narrowing blue
colour of θ = 1, which is only up to x/H = 4.5 for a higher t/H ratio of 1.5. Besides that, an
intensive mixing process coupled with a large size wake influences a spacious area of the
mainstream flow with the capability of reaching the protected wall near the downstream region
(see Figure 10(d)). The coolant air is mostly suppressed by the mainstream flow before reaching
the downstream region. Finally, a higher temperature near the downstream region causes a larger
decay of film-cooling effectiveness for the case with a thicker lip thickness (seeFigure 9).
Based on the above observations, it can be concluded that film-cooling effectiveness could be
increased by maintaining the blade TE cutback with thinner lip thickness. Figure 10(a) confirms
that an optimum cooling performance could be maximised up to the downstream region while
using a thinner lip thickness with a t/H ratio of 0.25 (e.g. the position of θ = 1 at x/H = 9.7). It is
range of this optimum cooling performance is more than double that of the case with a t/H ratio of 1.5, as seen between Figure 10(a) and Figure 10(d).
6.4.2 Turbulent flow structures
Figure 11 provides the qualitative comparison of turbulent flow structures from simulations of
the four different t/H ratios, super-imposed by the contours of the adiabatic film-cooling
effectiveness at the protected wall surface. The turbulent flow structures are presented by
iso-surfaces of the vortex identification criterion Q = 0.5(Ω2 - S2) as used by Terzi et al. [45] and
Schneider et al. [46][47]. These iso-surfaces are coloured by the average temperature of the
mixing flow, from a low value of 293 K (in blue colour) to a high value of 500 K (in red colour),
respectively.
It can be seen from Figure 11(a) that a thin lip thickness to slot height ratio (t/H = 0.25)
generates small-scale wakes and relative shorter waves in the span wise direction, compared to
the other three cases. However, with this condition, the adiabatic film-cooling effectiveness has
shown high values (as seen in blue colour) along the protected wall surface. This finding is
consistent with that illustrated quantitatively in Figure 6 and Figure 9.
Unsteady wake patterns are more pronounced when the t/H ratio is increased. It can be seen that
a wake with a high level of intensity grows along the cutback region, accompanied by the growth
of vortex-shedding with longer waves in the span wise direction. This vortex-shedding becomes
more significant for the case with a higher t/H ratio, as clearly seen at the downstream region
(see Figure 11(d)). As it induces a strong mixing between the mainstream flow and the film
cooling slot jets, which in-turn degrades the adiabatic film-cooling effectiveness. Indeed, a decay
of the adiabatic film cooling effectiveness is obvious for a higher t/H ratio (see Figure 9). This
finding agrees with measurements made by Chen et al. [48], who found a degradation of the
adiabatic film cooling effectiveness on the trailing-edge cooling due to an intensive mixing. The
present numerical study indicates that detached-eddy simulation could be used to produce
predictions, in good agreement with the experimental measurements of Taslim et al. [13][14],
Krueckel et al. [49] and Horbach et al. [6][19]. The present numerical results also prove a
forgoing research done by Holloway et al. [20], in which it was identified that a larger lip
thickness leads to more film-cooling effectiveness decay, due to intensified vortex-shedding. A
larger wake seen in Figure 11(d) would induce a strong interaction between the main hot gas
distributions of mixed-air temperature as shown in Figure 10(d). The situation will be different
for thinner lip thickness in which a smaller wake will limit the growth of wake size along the
mixing region, so that the coolant temperature could be maintained for the majority of the
protected wall surface, as evident from Figure 10(a) and Figure 11(a).
Investigation of the laterally averaged turbulence level (Tu = u’/U∞) of fluid mixture along the
protected wall has shown some consistencies in terms of the intensity of wake as visualised in
Figure 11. The turbulence levels have shown a strong correlation with the turbulent flow
structures over the ‘breakout’ region, when comparing Figures 10-12.
6.5 Shedding frequency
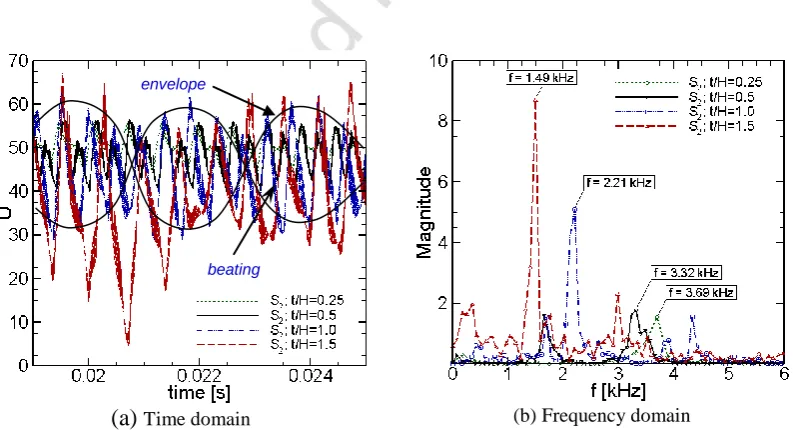
Figure 12 shows the comparison of the velocity magnitude (U) and the corresponding shedding
frequencies for various t/H ratios, presented in both the physical time and the frequency
domains, respectively. It was found that the amplitude of velocity is increased with the increase
of t/H ratios. This observation agrees with the turbulent flow structures, as depicted in Figure 11.
The velocity amplitude resulting from the thickest lip thickness is found to be more than two
times larger than that of the thinnest lip thickness.
The present simulation using a thinner lip thickness produces a harmonic wave pattern and
furthermore, sub-harmonic waves are captured for almost all cases simulated, this being in good
agreement with Medic et al. [50]. The flow response also found contains a sub-sub harmonic
wave with a stronger intensity when increasing the t/H ratios. Moreover, the ‘beating’
phenomenon is more pronounced for the case with higher t/H ratios, for example at 1.0 and 1.5.
It is likely this is caused by the 3-D effect of turbulent flow mixing which probably generates a
similar frequency in-phase between adjacent waves. The accumulation of these waves would
lead to a combined wave at higher amplitude, as seen in Figure 12(a).
After post-processing using the fast Fourier transform (FFT) technique, it was found that the
increase of t/H ratios causes the decrease of the dominant frequency, e.g. the vortex-shedding
frequencies are found fs = 3.69, 3.2, 2.21, and 1.49 kHz from the thinnest to the thickest lip
thickness, respectively. The predicted frequency from the baseline model (i.e. fs = 2.21 kHz) is
dominant frequency of 2.36 kHz based on simulation at the blowing ratio of 0.8. An analytical
calculation done by Martini et al. [28] [29] also found that the shedding frequency would be
approximately 2.4 kHz, based on the effective lip thickness of 5mm and the mainstream velocity
at uhg = 56 m/s, as used in the present study.
By using the equation (5), all dominant frequencies predicted above could be represented in
terms of Strouhal number, as presented in Table 3. A lower Strouhal number for the case with
the lowest t/H ratio is most likely to be related to the vortex shedding frequency. Comparing the
Strouhal numbers for the two TE geometries with turbulent boundary layers, one might notice
that these findings are very close to those experiments done by Sieverding et al. [51] using a
simple flat plate model with a squared trailing-edge. A Strouhal number around St = 0.215 was
found from their experiments at Mach numbers between 0.11 and 0.25. Another experiment
using rectangular cylinders was reported by Atsushi et al. [52], who evaluated Strouhal numbers
in a range of Reynolds numbers between 70 and 2 × 10⁴ and with a variation of the ratio of
width-to-height from 1 to 4. It was found that the Strouhal number is around St = 0.1 and 0.15
depending on the Reynolds number and the size of the rectangular cylinders. Boldman et al. [53]
reported that the Strouhal number is approximately 0.2 for turbulent flow behind a blunt trailing
edge for a certain range of Reynolds number with a width-to-height ratio of 2 to 3. Overall, the
present DES predicted Strouhal numbers agree very well with those experimental measurements.
7. Conclusions
The blade TE cutback cooling performance for four various t/H ratios (t/H = 0.25, 0.5, 1.0, 1.5)
has been studied by detached-eddy simulation (DES) with the SST k turbulence model. The
DES results have shown an overall good agreement with the available experimental data, in
terms of discharge coefficient, film-cooling effectiveness and vortex shedding frequency.
Accordingly, the following conclusions can be made:
1) By using a fixed slot-height (H), the change of t/H ratio will not have a major influence on
the heat transfer inside the cooling passage. This has been recognised by the coolant flow
behaviour at the surface of the pin-fin along the cooling channel, which has exhibited almost
the same properties in each row of pin-fins for all four t/H ratios studied.
2) The discharge coefficients remain almost unchanged for all four t/H ratios. However, the
3) The increase of t/H ratio of the blade TE cutback cooling will lead to the decrease of the adiabatic film-cooling effectiveness, particularly in downstream near-wake region. This is
likely due to an intensified flow mixing process between the coolant jet and the mainstream
hot gas. This has been confirmed qualitatively by the growth of the turbulent flow structures
with increasing t/H ratios, and also quantitatively by the increase of the airflow velocity
amplitude and the magnitude of shedding frequency, respectively.
4) Based on the FFT result, the dominant frequency is found to decrease when the t/H ratio is
increased from 0.25 to 1.5. The DES predicted frequencies are fs = 3.69, 3.2, 2.21, and 1.49
kHz from thinner to thicker lip thickness, corresponding to Strouhal numbers St = 0.15, 0.20,
0.23, and 0.22, respectively.
8. Acknowledgments
The first author would like to acknowledge the financial support from Muhammadiyah
University of Surakarta under research project No. 149/D4.4/PK/2010 and Kingston University
London through the accelerated research programme completion scheme.
9. Nomenclature
Aslot = Area at slot exit [m2]
DES
C = Calibration constant used in the DES model (CDES = 0.61)
CD = Discharge coefficient
D = Diameter of bluff body
Dω = Cross-diffusion term
s
f = Shedding frequency
FDES = Blending function of DES
Gk = Generation of turbulence kinetic energy due to the mean velocity gradients
Gω = Generation of turbulence dissipation rate ω
H = Height of internal coolant passage [mm]
h = Heat transfer coefficient [W/m2K]
k = Turbulence kinetic energy
L1,2.3,4 = Stream wise lengths of domain [mm]
t
M = Blowing ratio,
hg hg slot
c hg
hg slot c c
u A
m u
u M
Ma = Mach number
PIN = Pin-fin
p1,t = Total pressure at the coolant inlet
p2 = Static pressure at the slot exit,
T1,t = Total temperature at the coolant inlet,
Q = Vortex identification criterion
R = Gas constant
s = Pitch-wise distance of ribs array [mm]
S1 = First monitoring point location
S2 = Second monitoring point location
St = Strouhal number
Sk =source terms in turbulence kinetic equation
Sω = Source terms in turbulence dissipation equation
t = Thickness of blade trailing-edge [mm]
Taw = Temperature at the adiabatic wall surfaces [K]
Tw = Isothermal wall temperature [K]
Tc = Coolant gas temperature [K]
Tc’ = Coolant temperature measured at the centre of the slot-exit [K]
Thg = Hot gas temperature [K]
Tu = Turbulence level (Tu = u’/U∞)
u = Velocity
c
m = Mass flow rate of coolant gas [kg/s]
ui = velocity components
uc = Coolant gas velocity [m/s]
uhg = Hot gas velocity [m/s]
Yk = Dissipation term of k
Yω = Dissipation term of ω
Greek Symbols
θ = Non-dimensional temperature,
'
c hg
hg
T T
T T
ρ = Density [kg/m3]
ρc = Coolant gas density [kg/m3]
ρhg = Hot gas density [kg/m3]
ηaw = Adiabatic film cooling effectiveness
aw
= Averaged adiabatic film cooling effectiveness
Γk = Effective diffusivity of k
Γω = Effective diffusivity of ω
= Turbulence dissipation rate
= Maximum local grid spacing (∆x, ∆y, ∆z) of Cartesian coordinate system
κ = Specific heat capacity
Subscripts
aw = Adiabatic wall
c = Cold gas
c’ = Cold gas at the slot exit
hg = Hot gas
s = Shedding
slot = Slot exit
1,t = Coolant inlet
2 = Slot exit
Abbreviations
CFD = Computational Fluid Dynamics
DES = Detached-Eddy Simulation
LES = Large-Eddy Simulation
RANS = Reynolds-Averaged Navier-Stokes
SA = Spalart-Allmaras
SGS = Sub-grid-scale
SST = Shear-Stress Transport
10. References
[1] J. C. Han and S. Ekkad, “Recent Studies in Turbine Blade Film Cooling,” J. Rotating Machinery, vol. 7, no. 1, p. 21–40, 2001.
[2] J. C. Han, “Recent Studies in Turbine Blade Cooling,” J. Rotating Machinery, vol. 10, no. 6, p. 443–457, 2004.
[3] B. Facchini, B. Innocenti and L. Tarchi, “Pedestal and Endwall Contribution in Heat Transfer in Thin Wedge Shaped Trailing Edge,” in ASME Paper No. GT-2004-53152, Vienna, Austria, 2004.
[4] P. Martini, A. Schulz and S. Wittig, “Experimental and Numerical Investigation of Trailing Edge Film Cooling by Circular Wall Jets Ejected from a Slot with Internal Rib Arrays,” in ASME Paper No. GT-2003-38157, 2003.
[5] P. Martini and A. Schulz, “Experimental and Numerical Investigation of Trailing Edge Film Cooling by Circular Wall Jets Ejected from a Slot with Internal Rib Arrays,” J. Turbomachinery, vol. 126, no. 2, p. 229– 236, 2004.
[6] T. Horbach, A. Schulz and H. -J. Bauer, “Trailing Edge Film Cooling of Gas Turbine Airfoils – External Cooling Performance of Various Internal Pin Fin Configurations,” J. Turbomachinery, vol. 133, no. 4, pp. 041006-1 – 041006-9, 2011.
[7] Z. Yang and H. Hu, “An Experimental Investigation on the Trailing-edge Cooling of Turbine Blades,” J. Propulsion and Power Research, vol. 1, no. 1, p. 36–47, 2012.
[8] B. Facchini, F. Simonetti and L. Tarchi, “Experimental Investigation of Turning Flow Effects on Innovative Trailing Edge Cooling Configurations with Enlarged Pedestals and Square or Semicircular Ribs,” in ASME Paper No. GT-2009-59925, Orlando, Florida, USA, 2009.
[9] J. Choi, S. Mhetras, J. -C. Han, S. Lau and R. Rudolph, “Film Cooling and Heat Transfer on Two Cutback Trailing Edge Model with Internal Performance Blockages,” J. Heat Transfer, vol. 130, no. 1, p. 012201, 2008. [10] A. L. Brundage, M. W. Plesniak, P. B. Lawless and S. Ramadhyani, “Experimental Investigation of Airfoil Trailing Edge Heat Transfer and Aerodynamic Losses,” J. Experimental Thermal and Fluid Science, vol. 31, no. 3, p. 249–260, 2007.
[11] S. Kacker and J. Whitelaw, “The Effect of Slot Height and Slot-Turbulence Intensity on the Effectiveness of the Uniform Density, Two Dimensional Wall Jet,” J. Heat Transfer, vol. 90, no. 4, p. 469–475, 1968.
[12] S. C. Kacker and J. H. Whitelaw, “An Experimental Investigation of Slot Lip Thickness on Impervious Wall Effectiveness of the Uniform Density, Two-Dimensional Wall Jet,” J. Heat and Mass Transfer, vol. 12, no. 9, p. 1196–1201, 1969.
[13] N. E. Taslim, S. D. Spring and B. P. Mehlmann, “An Experimental Investigation of Film Cooling Effectiveness for Slot Various Exit Geometries,” AIAA Paper No. 90-2266, 1990.
[14] N. E. Taslim, S. D. Spring and B. P. Mehlmann, “Experimental Investigation of Film Cooling Effectiveness for Slot of Various Exit Geometries,” J. Thermophysics and Heat Transfer, vol. 6, no. 2, p. 302–307, 1992. [15] F. J. Cunha and M. K. Chyu, “Trailing-Edge Cooling for Gas Turbines,” J. Propulsion and Power, vol. 22, no.
2, p. 286–300, 2006.
[16] R. J. Goldstein, “Film Cooling,” J. Advance Heat Transfer, vol. 7, p. 321–379, 1971.
[17] S. Sivasegaram and J. Whitelaw, “Film Cooling Slots: The Importance of Lip Thickness and Injection Angle,” J. Mechanical Engineering Science, vol. 11, no. 1, p. 22–27, 1969.
[18] W. Burns and J. Stollery, “The Influence of Foreign Gas Injection and Slot Geometry on Film Cooling Effectiveness,” J. Heat and Mass Transfer, vol. 12, no. 8, p. 935–951, 1969.
[19] T. Horbach, A. Schulz and H. -J. Bauer, “Trailing Edge Film Cooling of Gas Turbine Airfoils – Effect of Ejection Lip Geometry on Film Cooling Effectiveness and Heat Transfer,” in International Symposium on Heat Transfer in Gas Turbine Systems, Antalya, Turkey, 42-TE, 2009.
[21] P. Martini, A. Schulz and H. -J. Bauer, “Film Cooling Effectiveness and Heat Transfer on The Trailing Edge Cutback of Gas Turbine Airfoils with Various Internal Cooling Designs,” in ASME Paper No. GT-2005-68083, 2005.
[22] P. Martini, A. Schulz and H. -J. Bauer, “Film Cooling Effectiveness and Heat Transfer on The Trailing Edge Cutback of Gas Turbine Airfoils with Various Internal Cooling Designs,” J. Turbomachinery, vol. 128, no. 1, p. 196–206, 2006.
[23] S. D. Holloway, J. H. Leylek and F. A. Buck, “Pressure-Side Bleed Film Cooling: Part I - Steady Framework For Experimental And Computational Results,” in ASME paper No GT-2002-30471, 2002.
[24] P. Martini, A. Schulz, C. F. Whitney and E. Lutum, “Experimental and Numerical Investigation of Trailing Edge Film Cooling Downstream of a Slot with Internal Rib Arrays,” in Proc. Inst. Mech. Eng., Part A, 217, 2003.
[25] Y. Egorov, F. R. Menter, R. Lechner and D. Cokljat, “The Scale-Adaptive Simulation Method for Unsteady Turbulent Flow Predictions. Part 2: Application to Complex Flows,” J. Flow, Turbulence and Combustion, vol. 85, no. 1, p. 139–165, 2010.
[26] M. Effendy, Y. Yao and J. Yao, “Comparison Study of Turbine Blade with Trailing-Edge Cutback Coolant Ejection Designs,” in 51st AIAA Aerospace Sciences Meeting, Grapevine, Texas, United States, 2013.
[27] M. Effendy, Y. Yao, J. Yao and D. R. Marchant, “Predicting Film Cooling Performance of Trailing–Edge Cutback Turbine Blades by Detached–Eddy Simulation,” in 52nd AIAA Aerospace Sciences Meeting, SciTech 2014, National Harbor, MD, United States, 2014.
[28] P. Martini, A. Schulz, H. -J. Bauer and C. F. Whitney, “Detached Eddy Simulation of Film Cooling Performance on The Trailing Edge Cutback of Gas Turbine Airfoils,” in ASME Paper No. GT-2005-68084, 2005.
[29] P. Martini, A. Schulz, H. -J. Bauer and C. F. Whitney, “Detached Eddy Simulation of Film Cooling Performance on The Trailing Edge Cutback of Gas Turbine Airfoils,” J. Turbomachinery, vol. 128, no. 2, p. 292–300, 2006.
[30] B. Wang and G. -C. Zha, “Detached-Eddy Simulation of Transonic Limit Cycle Oscillations Using High Order Schemes,” in 47th AIAA Aerospace Science Meeting. AIAA Paper No. 2009-1507, Orlando, Florida, United States, 2009.
[31] C. Xu, L. Chen and X. Lu, “Large-Eddy and Detached-Eddy Simulations of the Separated Flow around a Circular Cylinder,” J. Hydrodynamics, vol. 19, no. 5, pp. 559-563, 2007.
[32] F. R. Menter, M. Kuntz and R. Langtry, “Ten Years of Industrial Experience with the SST Turbulence Model,” Turbulence, Heat and Mass Transfer 4 , edited by K. Hanjalic, Y. Nagano, and M. Tummers, Begell House, Inc, p. 625–632, 2003.
[33] ANSYS-FLUENT, “Theory Guide Release 13.0,” Canonsburg, PA., ANSYS Inc., 2010, p. 61–102.
[34] T. Nishino, G. T. Roberts and X. Zhang, “Unsteady RANS and Detached-eddy Simulations of Flow around a Circular Cylinder in Ground Effect,” J. Fluids and Structures, vol. 24, no. 1, p. 18–33, 2008.
[35] P. R. Spalart, “Young-Person's Guide to Detached-Eddy Simulations Grids,” Boeing Commercial Airplane Group, Seattle, WA USA, 2001.
[36] P. R. Spalart, S. Deck, M. L. Shur, K. D. Squires, M. K. Strelets and A. Travin, “A New Version of Detached Eddy Simulation, Resistant to Ambiguous Grid Densities,” J. Theoretical and Computational Fluid Dynamics, vol. 20, no. 3, p. 181–195, 2006.
[37] J. Joo and P. Durbin, “Simulation of Turbine Blade Trailing Edge Cooling,” J. Fluids Engineering, vol. 131, no. 2, pp. 021102-1 – 021102-14, 2009.
[38] H. K. Versteeg and W. Malalasekera, An Introduction to Computational Fluid Dynamics, Pearson, 2007.
[39] L. Tarchi, B. Facchini and S. Zecchi, “Experimental Investigation of Innovative Internal Trailing Edge Cooling Configurations with Pentagonal Arrangement and Elliptic Pin Fin,” J. Rotating Machinery, 2008.
Arrays of Short Pin Fins,” J. Heat Transfer, vol. 104, no. 4, p. 700–706, 1982.
[42] S. A. Lawson, K. A. Thrift, A. Thole and A. Kohli, “Heat Transfer from Multiple Row Arrays of Low Aspect Ratio Pin-fins,” J. Heat and Mass Transfer, vol. 54, no. 17-18, p. 4099–4109, 2011.
[43] M. K. Chyu, Y. C. Hsing, T. I. -P. Shih and V. Natarajan, “Heat Transfer Contributions of Pins and Endwall in Pin-fin Arrays: Effects of Thermal Boundary Condition Modeling,” J. Turbomachinery, vol. 121, no. 2, p. 257– 263, 1999.
[44] J. F. Mitre, L. M. Santana, R. B. Damina, J. Su and P. L. C. Lage, “Numerical Study of Turbulent Heat Transfer iIn 3D Pin Fin Channels: Validation of a Quick Procedure to Estimate Mean Values in Quasi-Periodic Flows,” J. Applied Thermal Engineering, vol. 30, no. 17-18, p. 2796–2803, 2010.
[45] D. A. von Terzi, R. D. Sandberg and H. F. Fasel, “Identification of Large Coherent Structures in Supersonic Axisymmetric Wakes,” J. Computers and Fluids, vol. 38, no. 8, p. 1638–1650, 2009.
[46] H. Schneider, D. von Terzi and H. -J. Baurer, “Large-Eddy Simulations of trailing-edge cutback film cooling at low blowing ratio,” J. Heat and Fluid Flow, vol. 31, no. 5, p. 767–775, 2010.
[47] H. Schneider, D. von Terzi and H. -J. Baurer, “Turbulent Heat Transfer and Large Coherent Structures in Trailing-Edge Cutback Film Cooling,” J. Flow, Turbulence and Combustion, vol. 88, no. 1-2, p. 101–120, 2012.
[48] Y. Chen, C. G. Matalanis and J. K. Eaton, “High Resolution PIV Measurements around a Model Turbine Blade Trailing Edge Film Cooling Breakout,” J. Experiments in Fluids, vol. 44, no. 2, p. 199–209, 2007.
[49] J. Krueckels, M. Gritsch and M. Schnieder, “Design Consideration and Validation of Trailing Edge Pressure Side Bleed Cooling,” in ASME Paper No. GT-2009-59161, 2009.
[50] G. Medic and P. A. Durbin, “Unsteady Effects on Trailing Edge Cooling,” J. Heat Transfer, vol. 127, no. 4, p. 388–392, 2005.
[51] C. H. Sieverding and H. Heinemann, “The Influence of Boundary Layer State on Vortex Shedding from Flat Plates and Turbine Cascades,” J. Turbomachinery, vol. 112, no. 2, p. 181–187, 1990.
[52] O. Atsushi, “Strouhal Numbers of Rectangular Cylinders,” J. Fluid Mechanics, vol. 123, p. 379–398, 1982.
(a) t/H = 0.25 (b) t/H = 0.5 (c) t/H = 1.0 (baseline) (d) t/H = 1.5
Figure 1: Sketches of blade TE cutback for four various t/H ratios.
[image:25.595.187.435.222.329.2]
Figure 2: Schematic view of TE cutback slot with cold and hot gas streams.
(a) Isometric
(b) Front view
(c) Top view
[image:25.595.71.537.356.615.2](a) mesh A (coarse) (b) mesh B (medium) (c) mesh C (fine)
[image:26.595.140.476.243.409.2]Figure 4: Three types of mesh A, B, C around the pin-fin geometry.
Figure 5: Overall view of meshes at coolant inlet, side and bottom wall surfaces, and surface mesh C on the pin-fins arrays.
(a) Low blowing ratio (M = 0.5) (b) High blowing ratio (M = 1.1)
Figure 6: Grid refinement studies and validation against experimental data. 12 elements
1
2
elem
en
ts
18 elements
1
8
elem
en
ts
24 elements
2
4
elem
en
[image:26.595.102.513.424.681.2]Figure 7: Comparison of heat transfer coefficient.
Figure 8: Comparison of discharge coefficients.
[image:27.595.92.522.73.256.2](a) Low blowing ratio (M = 0.5) (b) High blowing ratio (M = 1.1)
(a) t/H = 0.25 (b) t/H = 0.5
[image:28.595.107.502.81.473.2](c) t/H = 1.0 (baseline) (d) t/H = 1.5
(a) t/H = 0.25 (b) t/H = 0.5
[image:29.595.74.534.102.393.2](c) t/H = 1.0 (baseline) (d) t/H = 1.5
Figure 11: Turbulent flow structures along the breakout region at a higher blowing ratio of 1.1, visualised by Iso-surfaces at a value of Ω2 - S2 = 105 1/s2.
(a) Time domain (b) Frequency domain
Figure 12: Shedding frequencies at a higher blowing ratio of 1.1.
A smaller wake
A larger wake Adiabatic film cooling
effectiveness
[image:29.595.109.506.429.644.2]Table 1: The numerical test conditions.
Mainstream flow Coolant flow Out flow
Velocity [m/s] uhg = 56 uc = 4 - 15 -
Temperature [K] Thg = 500 Tc = 293 -
Turbulence Intensity [%] Tuhg = 7 Tuc = 5 -
Length Scale [mm] 10 1.5 -
[image:30.595.91.516.255.464.2]Pressure [kPa] - - Phg = 105
Table 2: Mesh C statistics
t/H 0.25 0.5 1.0
(baseline)
1.5
Inside the cooling passage region
pin-fin wall ay1+ 0.907 0.907 0.907 0.906
end-wall y1+ 0.751 0.752 0.749 0.751
Mainstream region
pressure side wall y1+ 0.475 0.478 0.482 0.488
lip-end wall y1+ 0.528 0.523 0.607 0.654
TE breakout/cutback region
No. of elements b, nx × ny × nz 124×48×48 124×48×48 124×48×48 124×48×48
y1+ 0.338 0.309 0.257 0.254
average
y1+ 0.739 0.737 0.740 0.694
a an average of y
1+ in the radial direction of pin-fins, b elements at the block of breakout-slot region
Table 3: DES predicted Strouhal number
t/H 0.25 0.5 1.0 1.5