• No results found

Studying effects of preshearing on hand layup

N/A
N/A
Protected

Academic year: 2020

Share "Studying effects of preshearing on hand layup"

Copied!
15
0
0

Loading.... (view fulltext now)

Full text

Loading

Figure

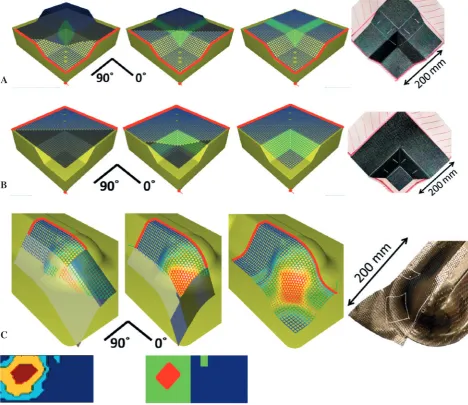
Figure 1Virtual fiber placement Animations and final ply pictures featuring preshearing markings for Tasks A, B and C (notto scale): (Bottom) example of flat shear map and then simplified shear map for task C
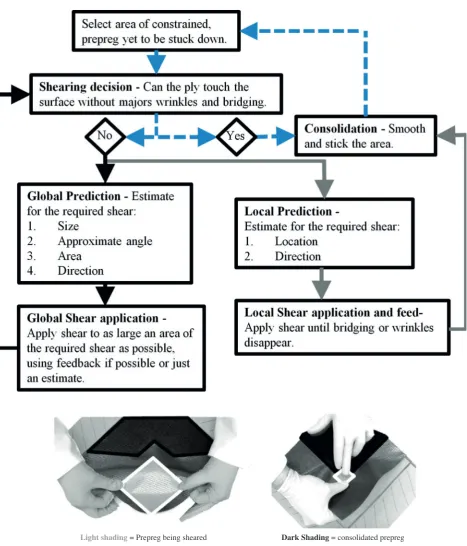
Figure 2(Top) Flow chart of shearing process: (Bottom left) example of global shearing; (Bottom right) example of localshearing: dark arrows 5 global shearing, light arrows 5 local shearing, dashed arrows 5 both
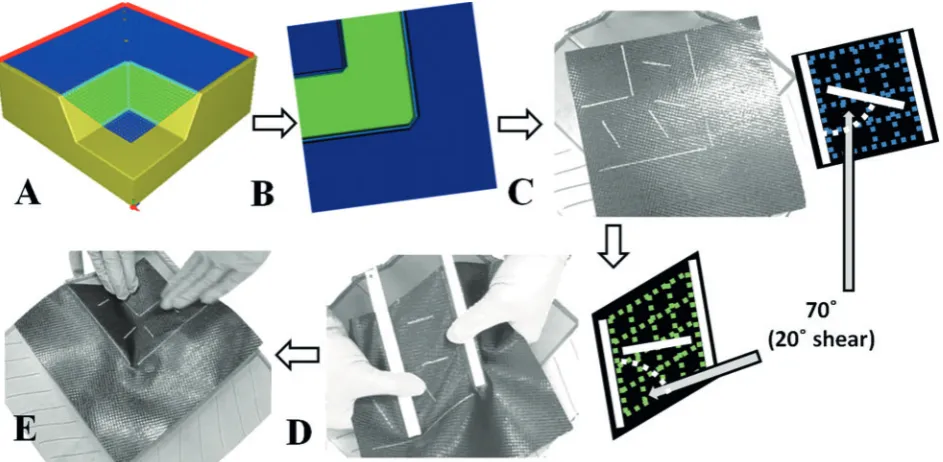
Figure 3Preshearing process for Task B: (A) virtual fiber placement simulation; (B) two-dimensional shear map; (C) shearpattern on undeformed prepreg with schematic; (D) prepreg being deformed using edge clamping, with schamatic showingformed shear (note white lines are now perpendicular to clamps); (E) preformed ply being placed into tool, approximatly fit-ting into recess
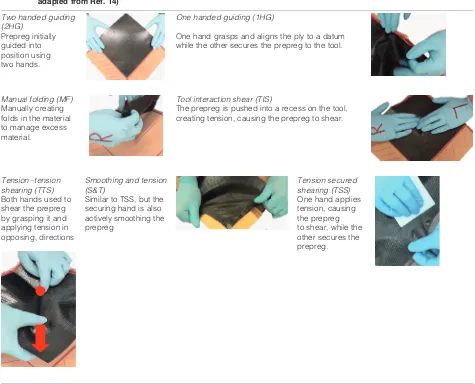
Table 1List of specialist layup techniques identified during layup, for more details description see Ref
+7

References

Related documents

Effect of aquatic Po, on locomotor stamina of 'small' (left) and 'large' (right) Bufo larvae swum at similar relative velocities.. Velocities are presented above

In addition, resistance cal- culations in which Pf=o is taken as right or left atrial pressure assume a linear pressure-flow relationship that has a distinctly smaller slope than

Figure 2.3 An example of a muon ring (left) and electron ring (right) in the SuperK Cherenkov detector using event display. Pictures taken