Attribute-based intervention development for
increasing resilience of urban drainage systems
Short title: Attribute-based intervention development for increasing resilience
Chris Sweetapple1*, Guangtao Fu1, Raziyeh Farmani1, Fanlin Meng1, Sarah Ward1 and David Butler1
1 Centre for Water Systems, College of Engineering, Mathematics and Physical Sciences, University of Exeter, North Park Road, Exeter, Devon EX4 4QF, United Kingdom
* Corresponding author’s e-mail: [email protected]
Abstract
Resilience building commonly focuses on attributes such as redundancy. Whilst this may work in some cases, provision of specific attributes does not guarantee resilient performance and research is required to determine the suitability of such approaches. This study uses 250 combined sewer system virtual case studies to explore the effects of two attribute-based interventions (increasing distributed storage and reducing imperviousness) on performance-based resilience measures. These are found to provide improvement in performance under system failure in the majority of case studies, but it is also shown that attribute-based intervention development can result in reduced resilience.
Keywords
Global resilience analysis, intervention, urban drainage system, virtual case studies
Introduction
Improving the resilience of urban infrastructure is a topic of current interest and great importance. It is recognised that an increasingly uncertain future will bring many challenges, including climate change and population growth amongst other known and unknown threats (Butler et al. 2016), and that systems need to be able to combat (i.e. absorb, adapt to or rapidly recover from) such disruptive events (Francis and Bekera 2014). As such, there is a growing body of research into the resilience of urban infrastructure systems, including, for example, transport (e.g. Jaroszweski et al. 2014), power distribution (e.g. Mureddu et al. 2016), water distribution (e.g. Diao et al. 2016) and urban drainage (e.g. Mugume et al. 2015). This paper focusses on efforts to increase the resilience of urban drainage systems, since these are vital if acceptable levels of flood protection are to be maintained and the consequences of any floods occurring under extreme conditions minimised (Mugume et al. 2015).
Whilst there are common themes across the research, many definitions, assessment frameworks and metrics exist for resilience exist (Francis and Bekera 2014). This study uses the resilience definition of Butler et al. (2016): “the degree to which the system minimises level of service failure magnitude and duration over its design life when subject to exceptional conditions” (Butler et al. 2016).
it has been shown to in some cases (Diao et al. 2016, Mugume et al. 2015), drawing conclusions from the results of individual investigations is questionable (Moederl et al. 2011) and may result in erroneous conclusions that are not applicable to other systems (Jolly et al. 2014).
Due to limited data availability, it may not be possible to evaluate strategies in a large number of real world case studies (Sitzenfrei et al. 2010), but virtual case studies (VCSs) provide a useful alternative and enable a wider analysis without the need for extensive case study data.
The influence of a range of system attributes on performance has been explored previously using VCSs (Moderl et al. 2012); however, there is still need for a better understanding of the relationship between system attributes and resilience. This study, therefore, utilises 250 combined sewer network VCSs to explore the effects of two ‘attribute-based’ interventions on performance-based measures of resilience. These are interventions which provide a system with attributes that are believed may increase resilience – in this case, increased storage capacity and reduced imperviousness – but do not have proven effects on resilience across a wide range of systems.
Methods
Virtual case studies
Performance-based measures of resilience are calculated for 250 VCSs with catchment areas of 772 to 8293 hectares. These are produced using an algorithmic VCS generator (Moederl et al. 2009), which uses an adapted Galton-Watson branching process to generate dendritic sewer system layouts and designs the components according to standard values. Tanks are sited in the network using a probabilistic approach, where the probability of a tank being located at each node is based on the impervious surface area of the corresponding subcatchment. Pipe diameters are designed based on the runoff and cross section flow, assuming a specified mean velocity in the pipes. Two example VCSs are shown in Fig. 1. Total sewer pipe lengths range from 21 to 366 km and, before intervention, mean catchment imperviousness is in the range 41.5 to 53.2 % and systems contain from 4 to 54 tanks. In each VCS, the base case rainfall for simulation is a 15 minute duration event with a return period of 1 year in an alpine region (Moederl et al. 2009). All VCSs are modelled using SWMM 5.1 (Rossman 2015).
Resilience assessment
The global resilience analysis (GRA) methodology (Diao et al. 2016, Mugume et al. 2015) is chosen for assessment of resilience, since this provides performance-based, quantitative measures and captures the effects of a wide range of potential system failure magnitudes without the need for scenario development. GRA involves calculation of the performance under increasing system failure magnitudes and generation of response curves (performance as a function of system failure magnitude). The area under each response curve then provides a performance-based indicator of resilience to the corresponding system failure mode.
Two failure modes are considered in this study: a) pipe failure, and b) change in rainfall intensity (due to change in depth or duration of a rainfall event). These enable calculation of
rainfall intensity’. Note that other failure modes exist and these specified resilience values may not be representative of the systems’ general resilience (i.e. resilience to anything), which cannot be assessed quantitatively using existing performance-based methodologies. Pipe failure may refer to a collapse or blockage, both of which can result in flooding and are, therefore, issues for concern (Kellagher et al. 2009). Future change in rainfall patterns and magnitudes resulting from climate change are also a widely acknowledged challenge to the functioning of drainage systems.
For pipe failure, the percentage of pipes in the network that have failed represents the system failure magnitude and values of 0, 5… 95, 100% are evaluated to estimate the response curve. These figures refer to the number of pipes that have failed and are not length weighted. Given that there are multiple combinations of pipes that could constitute failure of a given percentage of pipes in the system, 100 pipe failure combinations are randomly generated and simulated for each pipe failure magnitude (except 0% and 100%, where only one combination is possible). This sample size is found to be sufficient to achieve convergence in both the smallest and largest VCSs whilst not being prohibitively computationally demanding. This method does not necessarily capture the most probable pipe failure combinations, for example those that might result from cascading failures (although they may be present in the random combinations). However, global resilience analysis is not a probabilistic based method: instead, it aims to capture the potential response to any system failure magnitude, irrespective of its probability. Specific pipe failure scenarios of interest would need to be investigated separately.
Pipe failure is modelled in SWMM by increasing the Manning’s roughness coefficient, n, of the corresponding pipe to 100, which reduces the conveyance of flow sufficiently to simulate failure (Mugume et al. 2015). Repair or unblocking of failed pipes within the period of flooding is not considered as the time taken to do so is dependent on many factors such as the nature of the failure, accessibility and time to detection. In some cases, repair or unblocking may not be feasible until after any flooding has subsided. However, the effect of response and recovery strategies on resilience to pipe failure is an important topic that could be explored in further investigations.
For change in rainfall intensity, changes due to change in either depth or duration of a fixed rainfall pattern are considered independently. This does not capture every possible event, as depth and duration could change simultaneously and different rainfall patterns may be observed in the future. However, it captures a wide range of possibilities, including extreme events as necessary for assessment of resilience. The base case rainfall event has an intensity of 15.9mm/hr, and intensity multiplication factors of 0, 0.5 … 9.5, 10.0 are used in the GRA. This enables the effects of both reduction and increase in rainfall intensity for a fixed period event to be captured, irrespective of the return period of the new events. The intensity changes are achieved firstly by adjusting the depth of the base case rainfall time series only (i.e. applying a multiplier of 0, 0.5… 9.5, 10.0 to the depth at each time step) and secondly by adjusting the duration of the base case rainfall time series only (i.e. applying a multiplier of 1/0.5… 1/9.5, 1/10.0 to the duration of each time step; note that an intensity of 0 cannot be achieved by adjusting the duration only).
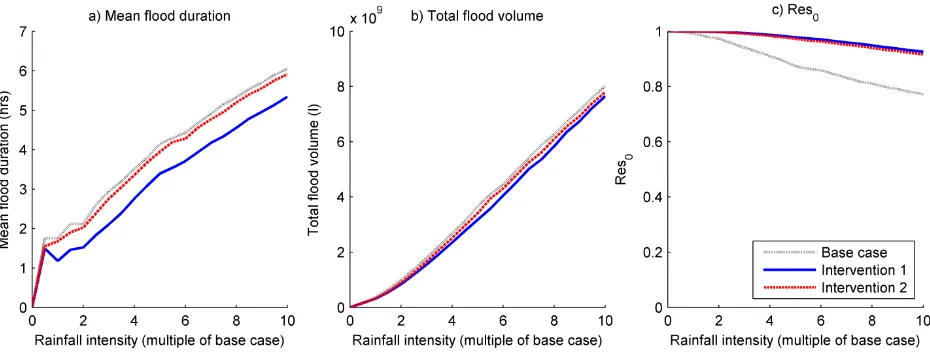
Under each system failure type and magnitude, total flood volume (VTF), flood duration (tf) and Res0 (equation (1) (Mugume et al. 2015)) are calculated, enabling three response curves to be plotted (as in results section, Fig. 3).
Where VTI is the total inflow to the system and tn the simulation duration.
For pipe failure, the mean response at each pipe failure magnitude (based on the 100 samples) is used. For change in rainfall intensity, the mean response at each intensity is used (based on manipulation of rainfall depth and duration independently). Total flood volume is the sum of flood volume at every node in the system and flood duration is the total duration during which at least one node in the system is flooded. These values should be minimised, hence a reduction in the area under their response curves represents an improvement in performance. Res0 incorporates flood volume and duration to provide a performance measure in the range 0-1 for each system failure magnitude. Given that Res0 incorporates the key elements of resilience (flood volume and duration), the area under the Res0 response curve can be considered a single, performance-based indicator for resilience. A Res0 value of 1 is obtained if no flooding is observed; therefore, if the system failure magnitude is normalised (necessary as the maximum system failure magnitude differs between failure modes), the area under the Res0 response curve will be in the range 0-1, with a value of 1 indicating a high degree of resilience to the given system failure mode.
Interventions
Two attribute-based interventions to increase resilience in the VCS combined sewer systems are considered:
1. Increase distributed storage 2. Reduce impervious surface area
Provision of additional storage capacity is a traditional flood control measure which increases redundancy or flexibility (Mugume et al. 2015), both of which are considered attributes of a resilient system (Cabinet Office 2011, Hassler and Kohler 2014, Mugume et al. 2015). Spatially distributed, upstream storage is selected for investigation here as this provides effective flow regulation (Tao et al. 2014) and has previously been found to provide greater improvement in resilience than centralised storage (Mugume et al. 2015).
Distributed storage is provided in the VCSs by adding sufficient tanks to reduce the mean catchment area per tank to 400 ha (hence, intervention 1 is only applied to the VCSs where this level of storage is not currently provided). All additional tanks are 2,000 m3, which is approximately equal to the smallest tank in the base case VCSs, and are located at nodes with the greatest flood area (identified iteratively following addition of each tank) and at least one upstream connection. This may not be the most effective design and it is recognised that greater benefit may be achieved from more appropriately located and sized tanks; however, whilst there have been studies on the sizing and placement of storage tanks (e.g. Duan et al. 2016, Li et al. 2015, Wang et al. 2017), there is no standard for determining the required location and capacities of storage facilities within a sewer network (Lim et al. 2014) and to enable comparison of the VCSs, interventions must be applied to each in the
𝑅𝑒𝑠0 = 1 −
𝑉𝑇𝐹
𝑉𝑇𝐼 ×
𝑡𝑓
same manner. Whilst not providing optimum designs, the chosen approach facilitates a simple evaluation of the effectiveness of distributed storage in a wide range of case studies. Two example VCSs, with application of intervention 1 illustrated, are shown in Fig. 1.
Fig. 1. Example VCSs; additional tanks provided in intervention 1 are circled
For intervention 2, a 10% reduction in imperviousness is applied uniformly to every subcatchment in each VCS (e.g. 80% imperviousness would be reduced to 80×0.9=72%). Disconnection of up to 50% of impervious surface areas has been assumed as a likely upper bound in other studies (Environment Agency 2013), but 10% is selected here as a more easily achievable (and, therefore, more likely) catchment-wide figure. The reduction in imperviousness is applied as percentage reduction instead of disconnection of a specific area to ensure that the results for all VCSs are comparable on a like-for-like basis, given that each VCS has a different catchment area.
Performance-based resilience indicators are recalculated as above for VCSs with interventions, enabling the effects of attribute-based interventions on performance under system failure to be analysed.
Results and discussion
Base case attribute and resilience relationships
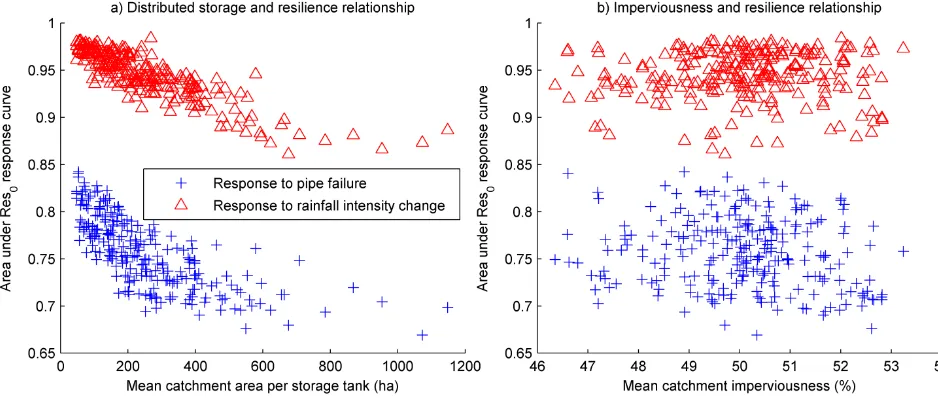
[image:5.595.86.539.128.349.2]There is no clear correlation between mean imperviousness (Fig. 2b) and either resilience measure calculated (r2 = 0.00 for resilience to rainfall intensity change, r2 = 0.03 for resilience to pipe failure). This shows that the mean catchment imperviousness of a combined sewer system provides no indication of its resilience. However, this does not mean that change in imperviousness (as provided by intervention 2) cannot be a reliable, attribute-based approach to increasing resilience, irrespective of its initial level.
Fig. 2. Relationship between a performance-based resilience indicator, distributed storage and imperviousness in the VCSs before intervention
Whilst there are some similarities in the ranking of the VCSs for resilience to pipe failure and resilience to rainfall intensity change (as measured by the area under the corresponding Res0 response curves) under base case conditions, there is only a weak correlation (r2 = 0.28). VCS 230, for example, has the highest resilience to pipe failure and is ranked 4th for resilience to rainfall intensity change, whereas VCS 2 has the 4th highest resilience to pipe failure but is only ranked 100th (out of 250) for resilience to rainfall intensity change. This suggests that attributes that provide resilience to one failure mode may not necessarily be beneficial with respect to others. This seems plausible as storage capacity for an upstream subcatchment with very high runoff, for example, may provide resilience to change in rainfall intensity but comparatively little benefit with respect to resilience to pipe failure if it is upstream of the majority of the pipes in the system.
Effects of attribute-based interventions
[image:6.595.73.542.181.380.2]Fig. 3. Effect of interventions on response to increased rainfall in VCS 180
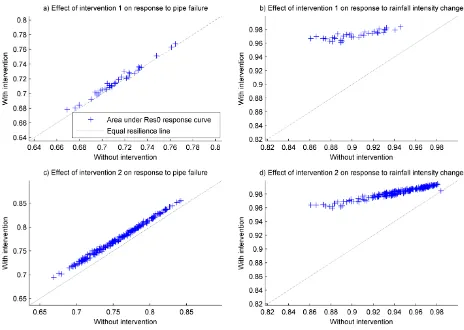
Fig. 4 shows the effects of the attribute-based interventions on performance-based measures of resilience for each VCS (area under the Res0 response curve, with system failure magnitude normalised), and Fig. 5 provides an overview of the range of benefits of each intervention in terms of its effects on flood volume, flood duration and Res0 under each failure mode. In Fig. 5, a positive ‘improvement’ value corresponds to be a reduction in the area under the flood duration and flood volume response curves and an increase in the area under the Res0 response curve.
These show that intervention 1 provides the greatest potential benefit with respect to Res0 performance under rainfall intensity change (maximum 33.3% and minimum 4.1% improvement in area under Res0 response curve). Intervention 2 is able to provide a similar level of improvement (maximum 32.9% improvement), but the median improvement is significantly lower than for intervention 1 (5.7% compared to 14.9%) and in some cases it provides negligible change in the Res0 response. The higher minimum and median improvement provided by intervention 1, however, may be attributed to the fact that intervention 1 was only applied to VCSs with an initially low level of distributed storage (i.e. those where greatest benefit would be expected), whereas intervention 2 was applied to all VCSs. Despite the high variability in the level of improvement shown in Fig. 5, it is clear from Fig. 4b and 4d that, with respect to performance under rainfall intensity change, both interventions provide the greatest benefit in VCSs with initially low resilience. This suggests that increasing distributed storage and reducing imperviousness are both effective, attribute-based interventions for combined sewer systems with low resilience to rainfall intensity change, and would be expected to provide significant improvement in the Res0 performance indicator under a range of rainfall intensity magnitudes.
[image:7.595.80.545.74.251.2]total volume of water in the system) whilst intervention 2 reduces the total volume of runoff entering the system.
It cannot be concluded more generally from these results that reducing imperviousness provides greater benefit than increasing distributed storage, since the magnitude of improvement will be dependent on the magnitude of imperviousness reduction or level of storage provided. Furthermore, all VCSs studied have a dendritic structure and, hence, no opportunity for flow re-routing under pipe failure, so the benefits observed here may be smaller than in systems with a different structure. Importantly, however, the results do demonstrate that increasing distributed storage may not always provide positive results. Such negative effects may be attributed to, for example, the synchronisation of peak flows resulting from poor storage tank design and location.
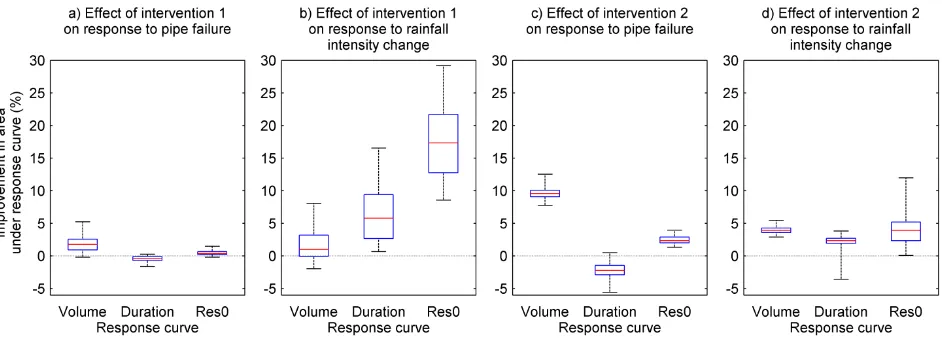
[image:8.595.74.538.258.588.2]Fig. 5. Improvement in area under response curves for pipe failure and rainfall intensity change provided by interventions.
Whilst both interventions typically provide an improvement in the Res0 response to either failure mode, analysis of the effects on flood magnitude and flood duration separately in Fig. 5 shows that there are trade-offs and the benefits of neither intervention are universal. Both interventions typically result in an increase in flood duration under pipe failure (observed in 78% of VCSs under intervention 1, 99% under intervention 2), although the volume of these floods is reduced. This finding is unexpected, as Mugume et al. (2015) found distributed storage to reduce both flood duration and volume when analysing the drainage system of Kampala; however, it is a good illustration of why conclusions cannot be drawn from a single case study. The acceptability of both interventions will, therefore, depend on whether an extended flood duration is considered an acceptable trade-off for a smaller flood coverage.
The increase in flood duration as a result of increasing distributed storage in the system may be explained by the increased attenuation provided: This may cause flooding at some nodes to occur at a later time than previously, therefore resulting in an increase in total time for which floods are present in the system (even if the duration of flooding at individual nodes is reduced). Similarly, the change in catchment imperviousness may alter the time at which flooding at some nodes occurs, resulting in a greater total flood duration for the system. Under rainfall intensity change, both interventions provide an improvement in the flood duration response in at least 98% of VCSs. Intervention 2 also provides a reduction in flood volume in every VCS, but intervention 1 results in an increase in flood volume in 14% of VCSs.
[image:9.595.82.553.70.240.2]Conclusions
This study explores, with a large set of examples, the effects of two attribute-based interventions on the resilience of combined sewer systems to pipe failure and rainfall intensity change. The results demonstrate that:
Implementation of attribute-based interventions can provide improved resilience in the majority of cases; however, improvement may only be small and positive results are not guaranteed.
In systems with initially low resilience to rainfall intensity change, increasing distributed storage and reducing imperviousness are both effective interventions and can be expected to provide a significant overall improvement under a range of rainfall magnitudes.
Achieving notable improvement in resilience to pipe failure with the attribute-based interventions studied is challenging.
Application of attribute-based interventions may result in trade-offs: Whilst improving a single, combined resilience indicator, increasing distributed storage and reducing imperviousness both typically result in an increase in flood duration under pipe failure. Increasing distributed storage can also increase flood volume under rainfall intensity change.
Limitations of this study include the simplistic approach to intervention design and the need to select a single base case rainfall event for evaluation of resilience to pipe failure. Improved intervention design and combination of interventions may increase the success rate of attribute-based interventions, and evaluation of the effects of pipe failure under more extreme and longer duration rainfall events would also yield greater evidence of the effectiveness (or otherwise) of these interventions. Analysis of additional case studies, not produced using the virtual case study generator, would also provide additional support to the conclusions.
Acknowledgement
This work forms part of a 5-year fellowship for the last author funded by the UK Engineering & Physical Sciences Research Council (EP/K006924/1).
References
Butler, D., Ward, S., Sweetapple, C., Astaraie-Imani, M., Diao, K., Farmani, R. and Fu, G. (2016) Reliable, resilient and sustainable water management: the Safe & SuRe approach. Global Challenges, DOI: 10.1002/gch2.1010.
Cabinet Office (2011) Keeping the Country Running: Natural Hazards and Infrastructure. A Guide to Improving the Resilience of Critical Infrastructure and Essential Services, Cabinet Office.
Diao, K., Sweetapple, C., Farmani, R., Fu, G., Ward, S. and Butler, D. (2016) Global Resilience Analysis of Water Distribution Systems. Water Research 106, 383-393, DOI: 10.1016/j.watres.2016.10.011
Environment Agency (2013) An assessment of evidence on sustainable drainage systems and the Thames Tideway standards, Environment Agency, Bristol, UK.
Francis, R. and Bekera, B. (2014) A metric and frameworks for resilience analysis of engineered and infrastructure systems. Reliability Engineering & System Safety 121, 90-103, DOI: 10.1016/j.ress.2013.07.004
Hassler, U. and Kohler, N. (2014) Resilience in the built environment. Building Research and Information 42(2), 119-129, DOI: 10.1080/09613218.2014.873593
Jaroszweski, D., Hooper, E. and Chapman, L. (2014) The impact of climate change on urban transport resilience in a changing world. Progress in Physical Geography 38(4), 448-463, DOI: 10.1177/0309133314538741
Jolly, M.D., Lothes, A.D., Bryson, L.S. and Ormsbee, L. (2014) Research Database of Water Distribution System Models. Journal of Water Resources Planning and Management 140(4), 410-416, DOI: 10.1061/(ASCE)WR.1943-5452.0000352
Kellagher, R., Cesses, Y., Mauro, M. and Gouldby, B. (2009) An urban drainage flood risk procedure - a comprehensive approach, Blackpool, UK.
Li, F., Duan, H.F., Yan, H.X. and Tao, T. (2015) Multi-Objective Optimal Design of Detention Tanks in the Urban Stormwater Drainage System: Framework Development and Case Study. Water Resources Management 29(7), 2125-2137, DOI: 10.1007/s11269-015-0931-0
Lim, S., Ho, V.H., Lee, S.Y., Yoo, D.G. and Kim, J.H. (2014) Determination of optimal location and capacity of detention facilities. 12th International Conference on Computing and Control for the Water Industry, CCWI2013 70, 1037-1045.
Moderl, M., Kleidorfer, M. and Rauch, W. (2012) Influence of characteristics on combined sewer performance. Water Science and Technology 66(5), 1052-1060, DOI: 10.2166/wst.2012.280
Moederl, M., Butler, D. and Rauch, W. (2009) A stochastic approach for automatic generation of urban drainage systems. Water Science and Technology 59(6), 1137-1143, DOI: 10.2166/wst.2009.097
Moederl, M., Sitzenfrei, R., Fetz, T., Fleischhacker, E. and Rauch, W. (2011) Systematic generation of virtual networks for water supply. Water Resources Research 47, DOI: 10.1029/2009WR008951
Mugume, S.N., Gomez, D.E., Fu, G., Farmani, R. and Butler, D. (2015) A global analysis approach for investigating structural resilience in urban drainage systems. Water Research 81, 15-26, DOI: 10.1016/j.watres.2015.05.030
Mureddu, M., Caldarelli, G., Damiano, A., Scala, A. and Meyer-Ortmanns, H. (2016) Islanding the power grid on the transmission level: less connections for more security. Scientific Reports 6, DOI: 10.1038/srep34797
Rossman, L. (2015) Storm Water Management Model User's Manual Version 5.1, Cincinnati, USA.
Sitzenfrei, R., Fach, S., Kinzel, H. and Rauch, W. (2010) A multi-layer cellular automata approach for algorithmic generation of virtual case studies: VIBe. Water Science and Technology 61(1), 37-45, DOI: 10.2166/wst.2010.782
Tao, T., Wang, J., Xin, K. and Li, S. (2014) Multi-objective optimal layout of distributed storm-water detention. International Journal of Environmental Science and Technology 11(5), 1473-1480, DOI: 10.1007/s13762-013-0330-0