AN ARCHITECTURAL APPROACH TO THE SOUNDWALK
METHOD
Merate Barakat
Architectural Association
School of Architecture,
London
ABSTRACT
A series of on-site surveys are conducted to observe possible qualitative aural pattern formations by using spatial measurements as fundamental parameters. The method assimilates the Soundwalk technique and the Relative Approach from the fields of soundscape and psychoacoustics, respectively. Soundwalking is an in situ technique typically used in soundscape research that can be designed to satisfy different research aims. It is a method that is highly dependent on the participating listener and the expected results. The Relative Approach is a method that considers the human response. These two site analysis methods are integrated within a customary architectural site-survey proposed to map the sonic morphology of urban spaces.
1. INTRODUCTION
Any research connected to soundscape refers to Schafer’s book ‘Soundscape: Our Sonic Environment and the Tuning of the World,’ to the extent that some argue that it is a cliché (Foale, 2014, p. 17). Regardless, it is important to note his contribution for a number of reasons. Schafer’s thesis establishes the base concepts as a broad scope. Anthologist Tim Ingold’s (2007) criticism of the field of soundscape aligns with Sophie Arkette’s (2004), who criticised Schafer’s original conjecture, noting that, when he declared “The world to resemble an orchestrated composition, he invites us to take assertive action to change its form and content” (2004, p. 161), he did not suggest metrics or methods for implementation beyond an electronic music studio. The non-specificity seems to be an advantage, rather than a limitation of the field. Schafer’s contribution allowed the field to evolve through the increasing interest of specialists from various disciplines including acoustics, anthropology, ecology, communication, design, landscape, literature, media arts, musicology, philosophy, psychology, political science, sociology and technology (Zhang & Kang, 2007)
Until recently, architecture and urban design have addressed the sound environment in sporadic attempts, and only by architects that have musical and/or engineering training like Iannis Xenakis (1997) and Peter Zumthor (2006). Björn Hellströma criticises the architectural research by stating that “hitherto, architectural research has largely ignored the sound[ing] environment” (2008, p. 423). Indeed, only
recently has there been a reference to Schafer’s conceptualisation of soundscape in the context of spatial design, as an architectural discourse. Like its earlier counterparts, this novelty situates the field of architecture in a position to interpret Schafer’s thesis through the mediation of spatial design. The other reason for referencing Schafer’s contribution is to appreciate the continued research conducted by the World Soundscape Project (WSP) that he founded and was extended by a number of composers. Hildegard Westerkamp is one of such composers that founded the soundwalk method. Soundwalking is “a form of active participation in the
soundscape” (Truax, 1999) that is designed and
documented (or scored) in several ways. A group of subjects (i.e. persons) is encouraged to walk purposefully in a particular area engaging aurally with their surrounding through discriminate listening. Westerkamp states that there is no direct method of soundwalking. The participant group can be a group of one, two or more, and the participant can follow a map, or create one as a score (Westerkamp, 1974/2001; Truax, 1999). The methods recently changed when the collaboration included architects. To date, there is only one ongoing research that aims to standardise and characterise soundscape semantics for urban design, at the School of Architecture, University of Sheffield.
This paper is part of a research synthesis that aims to survey the spatial configuration of acoustic spaces within urban spaces. The intent is to employ and adjust and customise the soundwalk method as and architectural site survey to map potential qualitative acoustic spatial boundaries. The soundwalk is designed to provide a map that determines the physical locations of the sound sources, in relation to the receiver, and ascertains which sources are within the acoustic horizon, and which are beyond it. The synthesis also employs the Relative Approach with the aid of Real-time Analysis (RTA) devices. In employing the Relative approach, the RTA spectral patterns are examined to deduce qualitative results. The soundwalk method is customised to document the relative locations where a particular spectral pattern associated with a considered sound sources is detected.
2. SEMANTICS
The term soundscape has many loose interpretations, some of which provide insight into what tools may assist the study. This discourse necessitates explicitly stating which terms pertain to this research and the associated definitions. Given the spatial character of this research and the need for quantifiable spatial factors, this study is aligned with the definition provided by Genuit and Fiebig (2006) that considers the spatial distribution of sounds. Genuit and Fiebig define soundscapes as domains that “consist of a number of spatially distributed sound sources, which give the soundscapes their distinctive features” (2006, p. 953). This concept allows the research to consider and map aural spatial patterns. The framework is informed by the interdisciplinary psychoacoustic and soundscape research, and architectural practice.
This research is attempting to map the acoustics spaces at a microscale (urban square). The focus is on the foreground signals that are immediately located on site. Keynote signals and broadcasting signals that are beyond the perimeter of the considered urban space are reduced to background signals. The terms assimilated from soundscape literature, including soundscape ecology and aural architecture are:
2.1.Receiver | Sensor
A receiver refers to a human listening/perceiving the sonic environment. In the context of field survey, this term denotes to the sound measurement equipment. If specified, it may refer to the person holding the device.
2.2.Sonic Event | Sound Source| Signal
The sounds considered are foreground signals, and will be denoted as sonic events. These terms refer to the events emitting a signal that are located within the urban space.
2.3.Auditory Channel
According to Barry Truax (1999), if the distance between a receiver and a sonic event allows the listener to detect and distinguish the signal, then an auditory channel forms. The level of information determines the strength of that channel. A receiver can be connected to multiple channels. An auditory channel can be disconnected for various reasons, including an increase in distance, other competing channels, the presence of a stronger channel connection, and the diversion of the listener’s attention.
2.4.Acoustic Horizon
According to Truax (1999), and Blesser and Salter (2007), the acoustic horizon is a space centred on the listener. The delineation of this area is mediated by the number and strength of auditory channels connecting the listener and sonic events.
2.5.Acoustic Arena | Acoustic Space | Patch
Truax (1999) presented the term acoustic space. Blesser and Salter (2007) adapted the idiom for aural architecture as an acoustic arena. A similar concept is known in the
field of soundscape ecology, referred to as a patch (Farina, 2014). These three terms refer to the area of space where a sonic event can be heard, and it is centred on that event. Acoustic arenas have different forms and are delineated by the human response to frequency content.
2.6.Edge
A number of auditory channels are connected to the receiver in the presence of multiple adjacent sonic events, and the associated acoustic arenas ‘overlap.’ In that intersecting domain, two conditions may occur: 1) the strongest auditory channel severs the other weaker connections, or 2) all connections are of equal strength negating each other. In the former case, the receiver is considered in the arena associated with the strongest auditory channel and the emitting signal is considered dominant. In the latter case, the receiver is not connected to an auditory channel and may be counted in the edge domain. Edge is a term assimilated from the patch-edge epistemological concept that is adopted in both fields of soundscape ecology and urban design (Farina, 2014).
2.7.Soundscape pattern
As an extension of Genuit and Fiebig’s (2006) definition of soundscape, soundscape patterns may be regarded as the spatial morphologies mediated by the acoustic arenas (or patches) centred on the spatially distributed sound source, and the edges forming between them. Since the event spatial distribution distinguishes the features of the soundscape, each soundscape would have a characteristic morphological pattern.
3. IN SITU | AN ARCHITECTURAL APPROACH
A series of soundwalk investigations are designed as in-field pattern mapping surveys that are set up for an urban space case study. The soundwalk ‘score’ (or documentation) is designed as a spatial site survey that documents the properties of the space, such as dimensions (in metres), materiality, and the properties of the mapped aspects. In this case, the mapped elements are the sonic events occurring within the urban space and their associated properties (frequency content and relative sound level), and the human response (auditory threshold and detection).
In an attempt to assimilate in-situ soundwalking, RTA and the relative approach method, the goal is to ascertain and document three spatial aspects: 1) the sonic events within a receivers’ acoustic horizon at a particular location; 2) the dominant signal, i.e. has the highest relative level; 3) the associated relative source-receiver distance (in metres).
determines the dominant sonic event. For example, Figure 1 shows three distinct sonic events S1, S2, and S3.
If the RTA device located at point R records the spectral patterns of all three signals (regardless of the relative levels), then they have an acoustic connection to receiver R. The acoustic horizon centred on R includes all three events. If the spectral pattern records S1 as having the
highest sound level, in relation to S2, and S3, then S1-R is
the strongest connection and S1 is the dominant sonic
event.
Figure 1. Schematic diagram of possible acoustic horizon patterns connecting a single receiver and multiple sonic events.
For multiple sources, S1 and S2, and receivers, R1, R2
and R3, as shown in Figure 2, the strongest channel
determines the dominant sound for each receiver. If the RTA spectrogram indicates that channels R1-S1 and R1-S2
are of equal strength, then R1 is not dominated by a sonic
event, and R1 is within an edge domain. If the spectral
patterns recorded at R3 show that R3-S1 and R3-S2 are
equally weak acoustic connections, R3 is located in an
edge area. By nature, such patch and edge conditions are not permanent in the field. The RTA spectrogram gives an indication of the change in acoustic channel strengths and the manner in which the aural spatial patterns are changing on site. This qualitative analysis is conducted by considering the spectral patterns, similar to the relative approach to map aural spatial patterns in the field.
3.1.Spectral Patterns and the ‘Relative Approach.'
According to the way the human auditory short-term memory functions, if signals are similar in terms of their temporal structures and spectral patterns, but only differ in the absolute level, the human ear is almost completely unable to detect the slight differences (Kuwano, et al., 2002). On the basis of these considerations, Genuit (1996) developed a procedure that considers temporal
structures and spectral patterns for determining ‘acoustic quality,’ namely the ‘Relative Approach.’ The relative approach recognises the standard soundscape studies approach spectral analysis, and it is a method that represents an analysis of the relative intensities at a resolution of different frequencies with a particular time lag (Joo, et al., 2011).
Figure 2. Schematic diagram of possible acoustic horizon patterns connecting multiple receivers and multiple sonic events.
This objective is achieved by observing continuous spectral formations of a reference signal as an average in the time and frequency domain (Genuit, 1996). Modulation spectral analysis is adept at identifying temporal structures or tonal components in a sound (Genuit & Fiebig, 2005). In using the relative approach, Genuit (1996; 2001) found that it is possible to measure objectively apparent pattern differences between two spectrographic displays, taken by different equipment. It is possible to deduce reasons for a negatively evaluated acoustic quality, by comparing the relevant temporal structures and patterns (Genuit, 1996; 2001). In a binaural investigation, Genuit and Fiebig (2006) provide a modulation spectra depicting the relative approach that shows that the ‘disturbing’ patterns remain unchanged with distance, although the LAeq decreases with distance
(Genuit & Fiebig, 2006).
[image:3.595.63.276.197.429.2]the dominant sound detected, in relation to other sources. Although the reviews for the employed RTA application indicate its relative accuracy (see next section), compared to high-end equipment, these investigations are only concerned with the recorded spectral patterns. If Genuit and Fiebig’s (2005) assertion that spectral analysis can identify temporal structures and tonal components, with any equipment at any distance holds true, then by using the relative approach it is possible to measure objectively clear pattern differences and make deductions accordingly. Here, the deduction is relatively straightforward. If a particular spectral pattern has the highest relative level, for a given time (surveying duration), then the associated signal is perceived at the receivers’ (i.e., RTA equipment and volunteer) location as the dominant sonic event.
3.2.Real-time Analysis (RTA) Equipment
[image:4.595.307.544.70.114.2]There is a debate among sound specialists concerning sound level and Real-Time Analysis (RTA) equipment (for ongoing discussions see (AudioTool Discussion Group, 2011)). Specialists consider that it is necessary to invest a large sum in developing equipment to ensure they produce accurate readings. Recently this impression is changing with the increase of technological equipment at lower prices. The quality of audio measurements depends on the quality of the microphone used. For example, the microphone employed in these field surveys is the calibrated Dayton Audio iMM-6 (Figure 3), plugged into the headset jack on Android devices (Table 1). The iMM-6 is a Class 2 microphone that is considerably cheaper than the high-end Class 1, and the resulting measurements compare well (for reviews see (Parts Express, 1996)).
Figure 3. Real-Time Analysis (RTA) equipment | Three Android devices used with microphones, simultaneously running the Android Tool application.
Android
Device Dimensions (mm) Display Resolution OnePlus One 152.9 75.9 8.9 1080 x
1920pix 401 ppi HTC One M7 137.4 68.2 9.3 1080 x 468
1920 pix ppi
HTC One V 120 60 9.1 480 x
800 pix
~252 ppi
Table 1. Display specifications of the three Android devices.
This type of microphone can be used with a cheap Android application (app) Audio Tool, created by Julian Bunn, who previously consulted for Ivie Technologies. Brent Butterworth wrote a review of the Audio Tool app, for the Sound and Vision Consumer periodical, stating that “the sound pressure level meter feature [of this app] gives you the same functionality as the famous RadioShack SPL meter […] the core function you’ll use most is the audio spectrum analyser. […] I haven’t seen a free spectrum analyzer app that delivers such high resolution” (2011, p. 1). Audio Tool uses A- and C-weighting networks. The application can be calibrated against a standard sound pressure level (SPL) metre, to account for differences of Android device microphones (Bofinit Corporation, 2014) that can be compensated for by with the use of the calibrated Dayton Audio iMM-6. Google play user reviews note “Kevin Worrell: […] Once calibration is performed with the phone and mic, the results are fairly accurate. Compared to stand-alone commercial measurement tools which all cost thousands of dollars” (for more reviews see (Google Play, 2015)).
It is worth mentioning that the principal aim of these field investigation is to create qualitative maps of the aural spaces on site. Although using relatively good quality RTA equipment is beneficial, and the calibration would offset recording errors, only the relative sound levels, and the spectral patterns are of consideration here, specifically when employing the relative approach.
4. CASE STUDY | COVENT GARDEN MARKET,
LONDON, UK
Historically, the configuration of the Covent Garden Market marks it as a cultural place where entertainers and musicians perform. The agora-like image of a bustling fruit and vegetable market, with merchants trying to out-shout their competitors, is not very different from the sonic character of the space today. Covent Garden Market was developed during a time when entertainment and commercial advertisement was based on using unamplified sounds. Currently, performances in the courtyard and the structure use high-fidelity speakers.
The arcade configuration of the space permits activities to proceed within 15,500 m2 of space without
[image:4.595.57.281.468.628.2]musicians perform. At any given time, at least three events are occurring concurrently.
5. PROCEDURE
Multiple site visits to Covent Garden Market have been conducted. This section selects two experiments in which more than one volunteer was available to take simultaneous measurements. Two foreground sources are considered here. A regular folk music performer (Figure 5) located at the North-East corner is surveyed at three simultaneous locations, and a Tibetan music performer (Figure 6) situated along the North-West façade is surveyed at four consecutive locations.
5.1.Soundwalk Score/Map
A printed spatial plan is obtained from a three-dimensional (3D) scanned model (ScanTech-International ltd., 2002) of the urban space (Figure 4) for in-field notations. The model is generated from a 3D point cloud. A preliminary plan section is cut and used for documentation for each site visit that includes: 1. Relative Dimensional Mapping (metres) of:
a. The locations of sonic events
b. The locations of RTA equipment (receivers) 2. Photographic documentation of:
a. The spatial material properties
b. The sonic events documented in images 3. Spectrograms recorded at each receiver location 4. Audio and video recordings of the sonic events
Figure 4. A rendering of a 3D model of Covent Garden Market. Purchased from a 3D-scanning company.
The in-field notations and the volunteer’s observations are then translated using computer aided design CAD model as interpolated splines. There are two splines to denote the furthest distance that: 1) where the volunteers can detect (hear) the selected sonic events and 2) where the devices detect the associated spectral patterns.
5.2.Sonic Event 01 | Folk performer
Figure 7 shows the CAD map resulting from surveying the Folk performer. In this case, an RTA device is located close to the performer for pattern reference, denoted R0. Location RA is the farthest distance where the
person holding the device can hear the performance. Point RB is selected at the point beyond where the
instrument holder can aurally detect the music. However, the spectrogram still shows the observed sonic event as the dominant pattern.
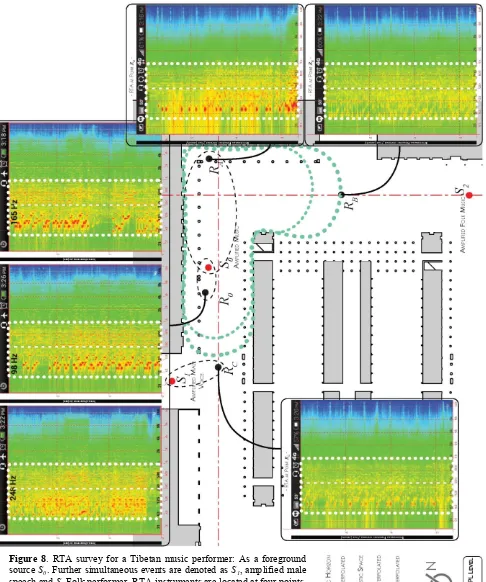
5.3.Sonic event 02 | Tibetan music performer
In the second case, an RTA device is also located close to the performer for pattern reference, denoted R0 in
Figure 8. Location RA is the farthest distance where
spectral patterns show high SPL levels. Point RB is
selected at the point beyond the device holder can aurally or visually detect the performance. At Rc the
device holder cannot hear the considered source, rather can hear another simultaneous event S1 that is an
amplified male speech performance (Image not available). Surveys gathered at RA, RB and RC occurred
consecutively while the RTA device at R0 remained
stationary as a point of spectral pattern reference.
Figure 5. An image of a regular Folk performer. Selected foreground sonic event to be surveyed.
Figure 6. An image of a Tibetan music performer. Selected foreground sonic event to be surveyed.
6. OBSERVATION AND DISCUSSION
[image:5.595.309.532.269.395.2] [image:5.595.57.277.423.553.2] [image:5.595.308.532.437.561.2]aspects into the different aspects of urban design, including site survey.
The adopted methods of Soundwalk, the Relative Approach, and RTA have been in use in their respective domains. The novelty of this proposed process is in the incorporation of these techniques as an architectural field survey to qualitatively map acoustic spaces on-site. This provides a method for architects conduct pre-design information gathering or design research in modalities that align with design processes. For example, this method is developed as a validation process for an architectural design research developing a computation tool that aims to map aural patterns within urban spaces.
There are a number of observations that are with pointing out. It is interesting to note that although the points where the device holder could not hear the foreground signals, the RTA spectral patterns clearly show similar patterns to the control points. This is worth noting because in considering attention masking the primary attention of the surveying individual is the considered sonic event. Normally the urban space users’ attention may be linked to the architectural programmatic use of the square (i.e. the activity the space is designed for). Also, the difference in the delineated acoustic spaces centred on the Tibetan music performer seems smaller. This may be due to the difference in ambient level at both locations that may be a result of the presence of more outdoor seating areas towards the North-East corner. The main Covent Garden underground tube station was closed during these particular visits that may attribute to the lower ambient sound levels in the North-West corner of the square.
The temporal nature of sonic events active within an urban space and the environmental aspects put a limitation on this process. Although this method is adequate for a number of architectural applications, there is a number of considerations that can be aggregated to the soundwalk design. Further development of this approach can include social activities changing in time (hour, day and season), as well as, reverberation time, and early and late reflections, which, according to literature, are contributors to the envelopment aspect of acoustic spaces. The on-site surveys can also consider these temporal environmental changes parameters such as windshield, atmospheric pressure, and environmental temperature.
According to Westerkamp’s original definition of the soundwalk method, these considerations can be included according to the ultimate aim of the on-site data gathering.
7. REFERENCES
Arkette, S., 2004. Sounds like city. Theory, Culture & Society, 21(1), pp. 159-168.
AudioTool Discussion Group, 2011. AudioTool Discussion Group. s.l.:Google Groups.
Blesser, B. & Salter, L.-R., 2007. Spaces Speak, Are You Listening? Experiencing Aural Architecture. Cambridge, Massachusetts: The MIT Press.
Bofinit Corporation, 2014. AudioTool - Online Manual. [Online]
Available at:
https://sites.google.com/site/bofinit/audiotool [Accessed 2014].
Butterworth, B., 2011. AudioTool — the Ultimate Audio App for Android. Sound & Vision, 11 July, p. online.
Farina, A., 2014. Soundscape Ecology: Principles, Patterns, Methods and Applications. New York, London: Springer Science+Business Media Dordrecht.
Foale, K., 2014. A Listener-Centered Approach to Soundscape Analysis. Manchester, UK: College of Science and Technology, University of Salford.
Genuit, K., 1996. Objective evaluation of acoustic quality based on a relative approach. s.l., s.n., p. 3233–3238. Genuit, K., 2001. The problem of predicting noise annoyance as a function of distance. Rome, Italy, International Conference on Acoustics (ICA).
Genuit, K. & Fiebig, A., 2005. Prediction of psychoacoustic parameters. Journal of the Acoustical Society of America, 118(3), p. 1874.
Genuit, K. & Fiebig, A., 2006. Psychoacoustics and its benefit for the soundscape approach. Acta Acustica united with Acustica, Volume 92, pp. 952-958.
Google Play, 2015. AudioTool. [Online]
Available at:
https://play.google.com/store/apps/details?id=com.julian. apps.AudioTool
[Accessed 15 April 2015].
Hellströma, B., Nilsson, M., Becker, P. & Lunden, P., 2008. Acoustic design artifacts and methods for urban soundscapes. Daejeon, Korea, DBpia, pp. 422-429.
Ingold, T., 2007. Against soundscape. Autumn leaves: sound and the environment in artistic practice, pp. 10-13. Joo, W., Gage, S. H. & Kasten., E. P., 2011. Analysis and interpretation of variability in soundscapes along an urban–rural gradient. Landscape and Urban Planning, 103(3), pp. 259-276.
Kuwano, S., Seiichiro, N., Kato, T. & Hellbrück, J., 2002. Memory of the loudness of sounds and its relation to overall impression. Sevilla, Spain, Sociedad Espanola de Acustica.
Parts Express, 1996. Dayton Audio iMM-6 Calibrated Measurement Microphone for iPhone iPad Tablet and Android. Springboro,OH: s.n.
ScanTech-International ltd., 2002.
ScanTech-International. [Online]
Available at: http://www.scantech-international.com/ [Accessed 11 11 2011].
Truax, B., 1999. Handbook For Acoustic Ecology,
CD-ROM. [Online]
Westerkamp, H., 1974/2001. Soundwalking. Sound Heritage, III(4).
Xenakis, I., 1997. Music and architecture. Hillsdale: Pendragon.
Zhang, M. & Kang, J., 2007. Towards the evaluation, description, and creation of soundscapes in urban open spaces. Environment and Planning B: Planning and Design, Volume 34, pp. 68-86.
Figure 7. RTA survey for a Folk performer: As a foreground source S0.
RTA instruments are located at three points. R0 is the control point, RA is
the farthest distance west where the holder can hear the performance, and RB is beyond the farthest distance south where the device holder can
Figure 8. RTA survey for a Tibetan music performer: As a foreground source S0. Further simultaneous events are denoted as S1, amplified male
speech and S2 Folk performer. RTA instruments are located at four points,
where R0 is the control point, RA is the farthest distance east where
spectral patterns show high levels, RB is beyond the farthest distance
south where the device holder can hear or see the performance and Rc is
beyond the farthest distance west where the device holder can see the performer but can hear S1 more clearly. Time stamped screen shots of
spectral patterns show that recordings at RA, RB and RC occurred
consecutively while spectral analysis at R0 remained stationary. The
[image:9.595.55.541.74.656.2]