External Evaluation of Event Extraction Classifiers for Automatic
Pathway Curation: An extended study of the mTOR pathway
Wojciech Kusa AGH University of Science and Technology
Cracow, Poland
Michael Spranger Sony Computer Science
Laboratories Inc. Tokyo, Japan
Abstract
This paper evaluates the impact of vari-ous event extraction systems on automatic pathway curation using the popular mTOR pathway. We quantify the impact of train-ing data sets as well as different machine learning classifiers and show that some improve the quality of automatically ex-tracted pathways.
1 Introduction
Biological pathways encode sequences of biolog-ical reactions, such as phosphorylation, activa-tion etc, involving various biological species, such as genes, proteins (Aldridge et al.,2006;Kitano,
2002). Studying and analyzing pathways is cru-cial to understanding biological systems and for the development of effective disease treatments and drugs (Creixell et al., 2015; Khatri et al.,
2012). There have been numerous efforts to re-construct detailed process-based and disease level pathway maps such as Parkinson disease map (Fu-jita et al., 2014), Alzheimers disease Map (Mizuno et al., 2012), mTOR pathway Map (Caron et al.,
2010), and the TLR pathway map (Oda and Ki-tano, 2006). Traditionally, these maps are con-structed and curated by expert pathway curators who manually read numerous biomedical docu-ments, comprehend and assimilate the knowledge in them and construct the pathway.
With increasing number of scientific publica-tions manual pathway curation is becoming more and more impossible. Therefore, Automated Path-way Curation (APC) and semi-automated biolog-ical knowledge extraction has been an active re-search area (Ananiadou et al., 2010; Ohta et al.,
2013; Szostak et al., 2015) trying to overcome the limitations of manual curation using vari-ous techniques from hand-crafted NLP systems
(Allen et al.,2015) to machine learning techniques (Bj¨orne et al.,2011). Machine-learning NLP sys-tems, in particular, show good performance in BioNLP tasks, but they are still performing less good in automated pathway curation, partly be-cause there have been few attempts to measure the performance of NLP systems for APC directly.
Recently, there has been some attempt at rem-edying the situation and new datasets and eval-uation measures have been proposed. For in-stance, Spranger et al. (2016) use the popu-lar human-generated mTOR pathway map (Caron et al., 2010; Efeyan and Sabatini, 2010; Katiyar et al.,2009) and quantify the performance of a par-ticular APC system and its ability to recreate the complete pathway automatically. Results reported were mixed.
One of the key components in such APC sys-tems is identification of triggers, events and their relationships. These machine learning-based sys-tems are essentially just supervised classification components.
This paper explores whether we can improve results of automated pathway curation for mTOR pathway by using different training datasets and learning algorithms. We show that the choice of event extraction classifiers increases F-score by up to 20% compared to state-of-the-art system. Our results also show that within limits the choice of training data has significantly less impact on re-sults than the choice of classifier. Our rere-sults also suggest that additional research is necessary to solve the problem of APC.
2 Automatic Pathway Curation
We constructed an automatic pathway curation system that take as input scientific articles in PDF format and transforms them into SBML encoded, annotated pathway maps. The pipeline has
ple steps.
1. PDFs are translated into pure text files using the cermine1tool.
2. Preprocessing provides tokenization, POS tagging, dependency and syntax parsing. 3. Anevent extraction systemextracts the
men-tions of entities (genes, proteins etc), reac-tions (e.g. phosphorylation) and their argu-ments (theme, cause, product).
4. A converter constructs pathways from the in-formation provided by the event extraction system.
5. An annotation system maps extracted entities and events to Entrez gene identifiers and SBO terms.
The following sections detail steps 3 to 5.
2.1 Event Extraction
We used the TURKU Event Extraction System (TEES) for event extraction (Bj¨orne et al.,2010). This system is one of the most successful BioNLP systems. It has not only won 1st place in BioNLP competitions but was also the only one NLP sys-tem that participated in all BioNLP-ST 2013 tasks (Bj¨orne et al., 2012). The system combines var-ious NLP techniques to extract information from text. TEES workflow consists of four steps:
1. Trigger Detection - detection of named enti-ties and event triggers in a given sentence to construct nodes of the event graph.
2. Edge detection - construction of complex events linking few triggers to create event graph. Output produced during this step is often a directed, typed edge connecting two entity nodes.
3. Unmerging - event nodes from merged event graph are duplicated in order to separate ar-guments into valid combinations. This step is needed for evaluation of final results in BioNLP Shared Task standard.
4. Modifiers detection - final component that defines additional attributes for events such as speculation and negation modifiers.
By default TEES trains a different instance of multiclass Support Vector Machines (SVM) for each step. Recent versions of TEES (Bj¨orne and
1http://cermine.ceon.pl/index.html
Salakoski, 2015) allow to easily exchange the SVM classifiers with other supervised classifica-tion algorithms. For example, allscikit-learn mul-ticlass, supervised learning algorithms that sup-port sparse feature matrices can be applied ( Pe-dregosa et al., 2011). Thanks to this it is possi-ble to test different algorithms for event extraction task and automatic pathway extraction. For this paper, we exchanges classifiers in all steps 1-4s as described in Section3. The output of TEES is a standoff formatted representation of entities and events.
2.2 Conversion Standoff to SBML pathways
In principle events and entities extracted by TEES correspond to biological species and reactions. We translate the NLP representation into SBML – the standard, XML-based markup language for representing biological models (Hucka et al.,
2003). SBML essentially encodes models us-ing biological players called sbml:species2.
sbml:species can participate in interac-tions, called sbml:reaction. Species par-ticipate in interaction as sbml:reactant, sbml:product and sbml:modifier. The basic idea being that some quantity of reactant is consumed to produce a product. Reactions are influenced by modifiers. The mapping algorithm is adopted from and described in more detail in Spranger et al. (2015).
2.3 SBO/GO, Entrez Gene Annotations
The SBML encoded, automatically extracted path-way is further annotated using Systems Biology Ontology (SBO) (Le Nov`ere,2006) and Gene On-tology (GO) terms. SBO also provides a class hi-erarchy for reaction types. For instance, the NLP system identify phosphorylation reactions, which are a subclass of conversion reactions. All reac-tions in the data are automatically annotated with SBO/GO term (coverage 100%) using an annota-tion scheme detailed in (Spranger et al.,2015).
Species (e.g. proteins, genes) were annotated using the gene/protein named entity recognition and normalization software GNAT (Hakenberg et al., 2011) - a publicly available gene/protein normalization tool. GNAT returns a set of En-trez Gene identifiers (Maglott et al.,2005) for each input string. Species were annotated using all returned Entrez Gene identifiers for a particular
species (organism human). We call the set of En-trez Gene identifiers returned by GNAT for each speciesEntrez Gene signature.
3 Classifiers for Event Extraction
In this paper we evaluate classifiers for event ex-traction (Section2.1) and their impact on the over-all performance of the automatic pathway extrac-tion system. We compare the following classifiers:
• Support Vector Machines (SVM)is the de-fault TEES classifier (Joachims, 1999). It was optimized for linear classification and its performance scales linearly with the number of training examples.
• Decision Tree (DT)creates a model that can predict the target value by learning simple de-cision rules inferred from the training data. Compared to the other techniques they are relatively fast, cost of using tree is logarith-mic in the number of examples. We use Gini impurity criterion to evaluate quality of the split.
• Random Forest (RF)classifiers fit a number of ensembled decision tree classifiers, each built from a bootstrap sample of a training set. The best split of node is chosen only from a random subset of the features, not all fea-tures. Final classifiers are combined by av-eraging their probabilistic prediction. Single tree have a higher bias but, due to averaging variance of the random forest as a whole de-creases.
• Multinomial Naive Bayes (MNNB)This is an implementation of the naive Bayes algo-rithm for multinomial data which is one of the classic variants used in classification of discrete features (e.g. text classification). Additive smoothing parameter was set to 1. • Multi-layer Perceptron (MLP) MLP is a
feedforward neural network model. We use hidden layer with 100 neurons and rectified linear unit activation function. We optimize for logarithmic loss using stochastic gradient descent. Learning rate is constant and equal to 0.001.
For DT, RF, MNNB and MLP we use imple-mentations from scikit-learn Python library ( Pe-dregosa et al.,2011).
Item ANN GE11 PC13
Documents 60 908 260
Words 11960 205729 53811
Entities 1921 11625 7855
Events 1284 10310 5992
Modifiers 71 1382 317
[image:3.595.312.518.59.554.2]Renaming 101 571 455
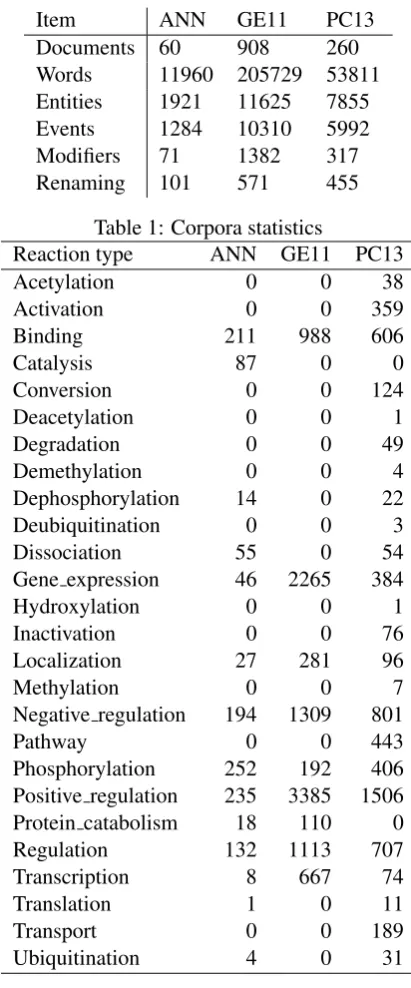
Table 1: Corpora statistics
Reaction type ANN GE11 PC13
Acetylation 0 0 38
Activation 0 0 359
Binding 211 988 606
Catalysis 87 0 0
Conversion 0 0 124
Deacetylation 0 0 1
Degradation 0 0 49
Demethylation 0 0 4
Dephosphorylation 14 0 22
Deubiquitination 0 0 3
Dissociation 55 0 54
Gene expression 46 2265 384
Hydroxylation 0 0 1
Inactivation 0 0 76
Localization 27 281 96
Methylation 0 0 7
Negative regulation 194 1309 801
Pathway 0 0 443
Phosphorylation 252 192 406
Positive regulation 235 3385 1506
Protein catabolism 18 110 0
Regulation 132 1113 707
Transcription 8 667 74
Translation 1 0 11
Transport 0 0 189
Ubiquitination 4 0 31
Table 2: Reaction types annotated for training data sets.
4 Datasets
4.1 Training Datasets
In order to quantify the impact of training data, we test the following three training sets.
[image:3.595.311.520.79.548.2]• GE11consists of 908 abstracts and full texts of scientific papers used in BioNLP ST 2011 GENIA Event Extraction task as training data (Kim et al.,2012).
• PC13 consists of 260 abstracts of scientific papers used in BioNLP ST 2013 Pathway Curation task as training data (Ohta et al.,
2013). The task goal was to evaluate the ap-plicability of event extraction systems to sup-port the automatic curation and evaluation of biomolecular pathway models.
The overall corpora statistics are summarized in Table1. GE11 and PC13 have the largest number of annotated events. ANN is much smaller in com-parison. Also, the distribution of event types dif-fers between data sets (Table2). GE11 uses more general terms (Binding, Regulation) compared to PC13 where some specific events appear only a few times (Deacetylation, Hydroxylation, Methy-lation).
We train classifiers on four combinations of the three training datasets: 1) standalone GE11; 2) GE11+ANN - combined GE11 and ANN; 3) combined GE11+PC13+ANN - GE11, PC13 and ANN; 4) PC13+ANN - combined PC13 and ANN. For instance, DT+GE11 refers to a decision tree classifier trained on GE11.
We use GE11-Devel BioNLP ST2011 dataset for hyperparameter optimization of all classifiers.
4.2 Test Data
Performance of classifiers is tested on the mTOR pathway map (Caron et al.,2010). The map was constructed by expert human curators using 522 full text papers from the PubMed database. The experts curated a single large map using CellDe-signer (Funahashi et al., 2008) - a software for modeling and executing mechanistic models of pathways. CellDesigner represents information using a heavily customized XML-based SBML format (Hucka et al.,2003).
Target Human expert data We translate the curator map into standard SBML and further en-rich the information using SBO/GO and Entrez Gene annotations. For SBO/GO, we use existing annotations provided by curators and extend them by automatic annotations deduced from reactants and products of reactions. For example, if a phos-phoryl group is added in a reaction, it is annotated using the SBO term for phosphorylation. Each re-action may be annotated with multiple SBO/GO
terms. Also we annotate the curated map with En-trez gene identifiers (similar to the automatic ex-traction data). We call this pathwayTARGET.
Testing classifiers The 522 full text papers – used by human curators for the construction of the mTOR pathway – are used for evaluating the dif-ferent text mining classifiers. For this, we plug in (trained) classifiers into the automatic pathway extraction pipeline which performs preprocessing, event extraction, conversion to SBML and anno-tation (see also Section 2). The output of this is an annotated SBML file that is subsequently com-pared to human-curated SBML-encoded pathway data.
5 Evaluation
Evaluation of the classifiers (and the system as a whole) is performed by comparing the auto-matically extracted pathway with the hand-curated pathway. Spranger et al. (2016) propose a num-ber of graph overlap algorithms for quantifying the difference and similarity of two pathways. Here we employ the same measures. The following summarizes the strategies.
Species In order to decide whether species in two pathways are the same, we use the name of the identifiers and their Entrez gene signatures.
nmeq: Two species are equal if their names are exactly equal. We remove certain prefixes from the names (e.g. phosphorylated).
appeq: Two species are equal if their names are approximately equal. Two names are approximately equal iff their Levenshtein-based string distance is above 90 ( Leven-shtein,1966)
enteq: Two species are equal if their entrez gene identifiers are exactly equal. This basically translates to the two species bqbiol:is identi-fier sets being exactly the same (order does not matter).
entov: Two species are equal if their entrez gene identifiers sets overlap. This basically trans-lates to the two species bqbiol:is identifier sets overlapping.
wc: Human curated data contains complex species that contain other species as con-stituents (species that consist of various pro-teins etc). wc allows species to match with constituents of complexes.
sboeq: Two reactions are equal iff their signa-tures are exactly the same. That is, the whole set of SBO/GO terms of one reaction is the same as of the other reaction.
sboov: Two reactions are equal, iff their signa-tures overlap. That is, the intersection of the set of SBO/GO terms of one reaction is with the set of SBO/GO terms of the other reaction is not empty.
sobisa: Two reactions are equal, iff there is at least one SBO/GO term in each signature that relate in a is a relationship in the SBO re-action type hierarchy. For instance, if there is a phosphorylation reaction and a conver-sion reaction, thensboisawill match because phosphorylation is a subclass of conversion according to the SBO type hierarchy.
Edges only match if their labels are strictly equal. So if an edge is a reactant, then it has to be a reactant in the other pathway. Same holds for products and modifiers.
Subgraph matching strategies are combina-tions of matching strategies for species, reaccombina-tions (and for edges which is always the same). For in-stance, the matching strategy nmeq, sboeq is the most strict and requires that species names are ex-actly equal and that SBO/GO signatures of reac-tions are exactly equal. The matching strategy
appeq/enteq/wc, sboisais the most loose strategy. In this strategy, two species match if their names are approximately equal or if their Entrez gene identifiers overlap or if any of this applies to one of the constituents of the two species. Two reactions match if any of their SBO/GO terms are in ais a
relationship. We compare a total of 24 matching strategies.
Subgraph overlap is computed as follows. For each subgraph in the extracted pathway we search for subgraphs in the human curated data that match according to some subgraph matching strategy. We use micro-averaged F-score, preci-sion and recall (Sokolova and Lapalme,2009) for quantifying the retrieval results. F-score is used to quantify the overlap of species, reactions and edges. We then macro-average these results to get atotal F-scorequantifying performance of the ex-traction system as a whole.
6 Results
Some classifiers take long to train, so we only have partial results for MLP. However, all other
classi-fiers (DT, MNNB, RF, SVM) finished training on all selected combinations of training data sets.
Since we tested 24 subgraph overlap measures with 18 classifiers, we receive a lot of data that cannot be discussed in detail in this paper. Here, we concentrate on general trends in the data. Code and datasets are published as appropriate3.
6.1 Extraction Results: Species, Reactions, Subgraphs
Generally speaking the extracted pathways con-tain two order of magnitudes more species reac-tions, and edges than the TARGET pathway (see Table 3for all results). This is normal since the extracted pathways consist of all combinations of entity and event mentions in text. The same enti-ties may occur more often in the text then they are referenced in the actual pathway.
Our results show that extraction classifiers per-form inconsistent with respect to the identification of compartments. While some classifiers retrieve a lot of compartment information (via localization events), others (especially MNNB trained on ANN and PC13 datasets) do not extract any compart-ments. MNNB with our parameter choice might not be able to learn many different event types so it skips least frequent reaction types (one of which is localization event).
Measuring how many subgraphs there are per pathway, we can see that more than half of all species extracted by classifiers are isolated and not connected to any reactions. Similarly we see many (small) subgraphs being extracted by the classi-fiers, whereasTARGET consists of essentially one large connected graph (with a few modeling mis-takes).
6.2 General Trends Subgraphs overlap
Let us first concentrate on overall performance especially with respect to previous results. For this we compute the best classifiers and their score for different matching strategies. For each matching strategy, we evaluate all classifiers and then choose the best performing one and com-pare it with the results reported in Spranger et al. (2016)/Spr16. Table4 shows that the best classi-fiers outperform Spr16 in all cases and for some subgraph overlap measures by 10 points.
If we analyze the classifiers from this paper in more detail, results (Figure1, Table 5) show that
name # species # reactions # compartments # edges # reactant edges
# edges product
# modifiers # isolated species
# isolated subgraphs
[image:6.595.74.523.62.227.2]DT+GE11 282361 92899 201 195531 89001 91895 14635 118162 187871 DT+GE11+ANN 284187 95096 188 212490 100529 93886 18075 115427 184542 DT+GE11+PC13+ANN 289504 94496 208 207447 94044 93559 19844 118281 188013 DT+PC13+ANN 279647 82977 20 188325 86802 82469 19054 123309 184698 MLP+GE11+ANN 278510 88502 230 193150 88655 87636 16859 114541 182456 MNNB+GE11 264413 69744 202 137828 61448 69250 7130 139402 198972 MNNB+GE11+ANN 245680 45690 0 86771 40102 45676 993 166712 206606 MNNB+GE11+PC13+ANN 269008 68926 0 142712 70292 68894 3526 151495 203903 MNNB+PC13+ANN 287314 76932 0 183029 94693 76925 11411 154210 199844 RF+GE11 227613 29573 9 50444 20786 29133 525 178233 206874 RF+GE11+ANN 261414 67974 347 130556 57195 67271 6090 136180 199157 RF+GE11+PC13+ANN 203314 32075 1 58083 25312 31704 1067 146342 177371 RF+PC13+ANN 236220 37018 0 68559 30493 36909 1157 168927 204771 SVM+GE11 288421 98938 451 200595 89769 97791 13035 109060 191175 SVM+GE11+ANN 262327 81207 388 169841 73033 80203 16605 109862 177023 SVM+GE11+PC13+ANN 275303 85435 312 179661 77587 84549 17525 114941 184481 SVM+PC13+ANN 275256 82119 59 177651 79239 81512 16900 120729 186122 TARGET 2242 777 7 2457 1044 892 521 15 4
Table 3: General statistics of all datasets. Number of extracted species, reactions and compartments. Total number of edges and of product, reactant and modifier edges. The table also shows the number of isolated species and the number of unconnected subgraphs for each pathway. The human curated mTOR pathwayTARGET numbers are shown in the last row.
this Spr16 f-score f-score
nmeq, sboeq 11.7 7.6
nmeq, sboov 15.3 11.4
nmeq, sboisa 18.1 13.6
appeq, sboeq 12.5 8.1
appeq, sboov 16.3 12.0
appeq, sboisa 19.4 14.5
appeq/enteq, sboeq 16.9 11.9
appeq/enteq, sboov 21.7 17.1
appeq/enteq, sboisa 26.0 20.4
appeq/entov, sboeq 36.2 26.9
appeq/entov, sboov 41.9 34.7
appeq/entov, sboisa 48.6 39.5
nmeq/wc, sboeq 23.3 15.0
nmeq/wc, sboov 26.0 19.6
nmeq/wc, sboisa 29.1 22.0
appeq/wc, sboeq 24.6 15.7
appeq/wc, sboov 27.4 20.4
appeq/wc, sboisa 30.9 23.1
appeq/enteq/wc, sboeq 39.7 29.1
appeq/enteq/wc, sboov 45.3 37.2
appeq/enteq/wc, sboisa 52.0 42.2
appeq/entov/wc, sboeq 39.7 29.1
appeq/entov/wc, sboov 45.3 37.2
appeq/entov/wc, sboisa 52.0 42.2 Table 4: This table compares macro F-score per-formance of the classifiers discussed in this paper with results reported in Spranger et al. (2016)
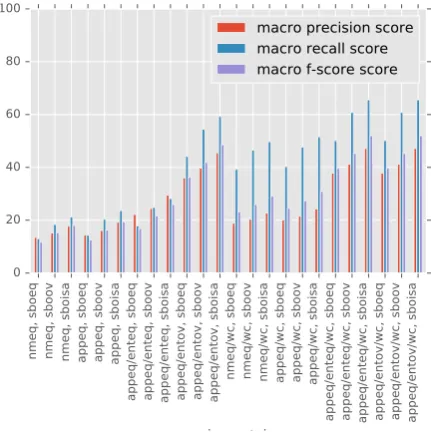
[image:6.595.307.523.310.527.2]for the strictest matching strategy (nmeq, sboeq) the best classifiers reach a macro F-score of 12
Figure 1: Best performing classifier f-score, pre-cision and recall for each subgraph overlap func-tions. The x-axis are the different subgraph over-lap function. The y-axis shows precision, recall, f-score of the highest classifier for each subgraph overlap function. Notice that these can be differ-ent classifiers for each subgraph overlap function (see Table5for all results).
[image:6.595.74.269.311.660.2]ex-tracted and the human-curated data. Of course, this also entails that the automatically extracted pathway does not completely capture what hu-mans are constructing from the text.
Generally speaking overlap strategies that are loose with respect to constituents of complex species (wc) outperform their nonwccounterparts. For instance,nmeq/wc, sboeqperforms much bet-ter than nmeq, sboeq. This shows that complex species are important for the mTOR pathway but their extraction is not very detailed - which is why the overlap matching strategy has to be lenient with respect to complex species constituents. The increase in F-score for wc matching strategies is primarily driven by an increase in recall score. For instance, the difference betweennmeq, sboeqand
nmeq/wc, sboeq is more than 20 points, whereas precision does not improve that much. The rea-sons for that is that the same subgraphs in the ex-tracted pathway overlap with more subgraphs in
TARGET. So it is not the case that other subgraphs in the extracted pathway overlap withTARGET.
Results also show that recall is in general much higher than precision for looser strategies. For instance, wcstrategies (right hand side of Figure
1) double the recall score w.r.t to their precision scores. This also shows that in principle loosen-ing matchloosen-ing strategies impacts mostly recall as the same subgraphs in the extracted data overlap with the human curated data.
6.3 Classifier Performance in Detail
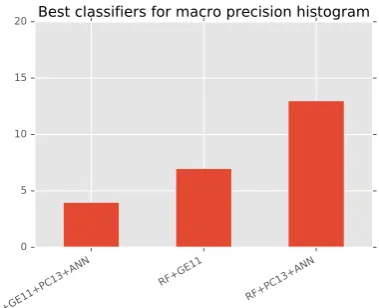
The bottom figure in Figure2shows the best clas-sifiers in terms of precision, recall and F-score. We measured how often a classifier is the best classi-fier (for each of the 24 subgraph overlap strate-gies). It is clear that overall Random Forest classi-fier (RF) performance is the best. For all 24 match-ing strategies it is a Random Forest classifier that is better than any other competitor with RF trained on PC13 and ANN being the most frequent best classifier overall. Second place is Random For-est trained simply on GE11 (the largFor-est dataset in terms of entities and events). No other classifiers (SVM, MLP, MNNB, DT) outperform RF. Train-ing on all datasets (RF+GE11+PC13+ANN) does not seem to increase success significantly. Perfor-mance across different RF classifiers is on par and good (see Table5)
[image:7.595.317.507.68.222.2]Results in the top figure of Figure 2 show that RF has the best precision performance.
Figure 2: Histogram of best classifiers. This his-togram is generated by counting how often a clas-sifier is the best for a particular subgraph matching strategy.
RF+PC13+ANN is the most frequent best classifier w.r.t precision. RF+GE11 and RF+GE11+PC13+ANN also performing compa-rably. Compared to recall this means that RF wins F-score because they are best in precision.
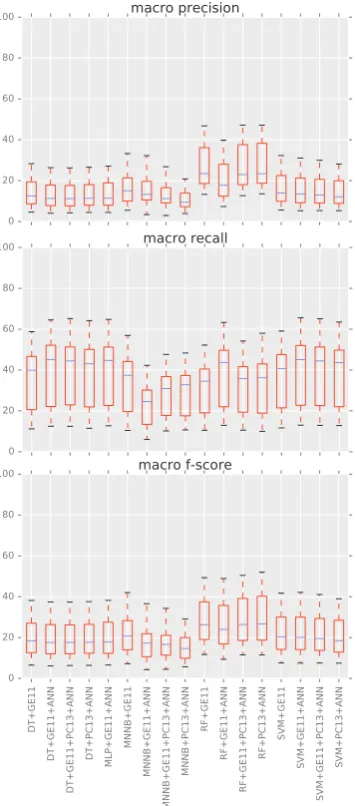
be-Figure 3: Statistics of classifier performance across all matching strategies. X-axis - classifiers. Y-axis - macro precision top, macro recall middle and macro f-score bottom (with 100 being perfect score).
ing most often the best classifier, followed by var-ious DT-based classifiers and MLP.
Figure 3 gives results for all classifiers across all matching strategies. Looser strategies give the max and strict matching strategies the min data points. We can see that performance is primar-ily driven by the choice of classifier as the F-score mostly varies with the type of classifier used (even though there are a few outliers). Situation is a bit more varied for precision and recall. Interestingly choice of dataset seems to have less impact. Gen-erally speaking MNNB are the least successful. RF clearly dominate precision on average but are close enough to DT and SVM on recall.
7 Conclusion
This paper continues the current trend of extend-ing NLP systems for APC and buildextend-ing more com-plete systems that allow evaluation with respect to some external standard - here the hand curated mTOR pathway.
We measured the impact of different classifiers on retrieval performance and showed that certain classifiers have the potential to increase retrieval performance. Especially Random Forest classi-fiers perform much better on mTOR than previ-ously tried Support Vector Machines. On the other hand, the training data choice seems to have lit-tle impact (at least for the tested ANN, GE11 and PC13 training datasets).
Spranger et al. (2016) argue that not all of the problems of APC can be overcome by using more training data on event extraction systems. They ar-gue that additions such as complex species recog-nition, co-reference resolution and pathway con-struction are needed to ultimately solve the prob-lem posed by APC. This certainly remains true and is not directly questioned by results in this paper. The system described here does not automatically compose single pathway maps from the extracted data. Nevertheless, our results suggest that a lot of progress can be made by improving on the event extraction part of the pipeline.
This paper focuses on evaluating current ma-chine learning techniques for event extraction. We are currently in the process of evaluating other sys-tems including rule-based ones.
Acknowledgments
We would like to thank the authors of the Turku Event Extraction System for providing such an ex-cellent system to the community. We also thank SBI for making the mTOR dataset available and their collaboration on evaluation and measure-ments.
References
B. B Aldridge, J. M Burke, D. A Lauffenburger, and P. K Sorger. 2006. Physicochemical modelling of cell signalling pathways. Nature cell biology 8(11):1195–1203.
[image:8.595.93.271.63.467.2]S. Ananiadou, S. Pyysalo, J. Tsujii, and D. Kell. 2010. Event extraction for systems biology by text mining the literature. Trends in biotechnology28(7):381– 90.
J. Bj¨orne, F. Ginter, S. Pyysalo, J. Tsujii, and T. Salakoski. 2010. Complex event extraction at pubmed scale. Bioinformatics26(12):i382–i390.
J. Bj¨orne, F. Ginter, and T. Salakoski. 2012. University of turku in the bionlp’11 shared task. BMC bioin-formatics13(11):1.
J. Bj¨orne, J. Heimonen, F. Ginter, A. Airola, T. Pahikkala, and T. Salakoski. 2011. Extracting contextualized complex biological events with rich graph-based feature sets. Computational Intelli-gence27(4):541–557.
J. Bj¨orne and T. Salakoski. 2015. Tees 2.2: Biomedical event extraction for diverse corpora. BMC Bioinfor-matics16(16):S4.
E. Caron, S. Ghosh, Y. Matsuoka, et al. 2010. A comprehensive map of the mtor signaling network. Molecular systems biology6(1).
P. Creixell, J. Reimand, S. Haider, et al. 2015. Path-way and network analysis of cancer genomes. Na-ture methods12(7):615.
A. Efeyan and D. Sabatini. 2010. mtor and cancer: many loops in one pathway. Current opinion in cell biology22(2):169–176.
A. Funahashi, Y. Matsuoka, A. Jouraku, et al. 2008. Celldesigner 3.5: a versatile modeling tool for biochemical networks. Proceedings of the IEEE 96(8):1254–1265.
J. Hakenberg, M. Gerner, M. Haeussler, I. Solt, C. Plake, M. Schroeder, G. Gonzalez, G. Nenadic, and C. M Bergman. 2011. The gnat library for local and remote gene mention normalization. Bioinfor-matics27(19):2769–2771.
M. Hucka, A. Finney, H. Sauro, et al. 2003. The sys-tems biology markup language (sbml): a medium for representation and exchange of biochemical net-work models. Bioinformatics19(4):524–531. T. Joachims. 1999. Making large-scale SVM learning
practical. In B. Sch¨olkopf, C. Burges, and A. Smola, editors,Advances in Kernel Methods - Support Vec-tor Learning, MIT Press, Cambridge, MA, chap-ter 11, pages 169–184.
S. Katiyar, E. Liu, C. Knutzen, et al. 2009. Redd1, an inhibitor of mtor signalling, is regulated by the cul4a–ddb1 ubiquitin ligase. EMBO reports 10(8):866–872.
P. Khatri, M. Sirota, and A. Butte. 2012. Ten years of pathway analysis: current approaches and outstand-ing challenges.PLoS Comput Biol8(2).
J.-D. Kim, N. Nguyen, Y. Wang, J. Tsujii, T. Takagi, and A. Yonezawa. 2012. The genia event and pro-tein coreference tasks of the bionlp shared task 2011. BMC Bioinformatics13(11):S1.
H. Kitano. 2002. Systems biology: a brief overview. Science295(5560):1662–1664.
N. Le Nov`ere. 2006. Model storage, exchange and in-tegration.BMC neuroscience.
V. I Levenshtein. 1966. Binary codes capable of cor-recting deletions, insertions, and reversals. InSoviet physics doklady. volume 10, pages 707–710. D. Maglott, J. Ostell, K. D Pruitt, and T. Tatusova.
2005. Entrez gene: gene-centered information at ncbi. Nucleic acids research33(suppl 1):D54–D58. S. Mizuno, R. Iijima, S. Ogishima, et al. 2012. Alz-pathway: a comprehensive map of signaling path-ways of alzheimer’s disease. BMC systems biology 6(1):52.
K. Oda and H. Kitano. 2006. A comprehensive map of the toll-like receptor signaling network. Molecular systems biology2(1).
T. Ohta, S. Pyysalo, R. Rak, et al. 2013. Overview of the pathway curation (pc) task of bionlp shared task 2013. In Proceedings of the BioNLP Shared Task 2013 Workshop. ACL, pages 67–75.
T. Ohta, S. Pyysalo, and J. Tsujii. 2011. From path-ways to biomolecular events: opportunities and challenges. InProceedings of BioNLP 2011 Work-shop. ACL, pages 105–113.
F. Pedregosa, G. Varoquaux, A. Gramfort, V. Michel, B. Thirion, O. Grisel, M. Blondel, P. Pretten-hofer, R. Weiss, V. Dubourg, J. Vanderplas, A. Pas-sos, D. Cournapeau, M. Brucher, M. Perrot, and E. Duchesnay. 2011. Scikit-learn: Machine learning in Python. Journal of Machine Learning Research 12:2825–2830.
M. Sokolova and G. Lapalme. 2009. A systematic analysis of performance measures for classifica-tion tasks. Information Processing & Management 45(4):427–437.
M. Spranger, S. Palaniappan, and S. Ghosh. 2015. Ex-tracting biological pathway models from nlp event representations. InProceedings of the 2015 Work-shop on Biomedical Natural Language Processing (BioNLP 2015). ACL, pages 42—51.
M. Spranger, S. K. Palaniappan, and S. Ghosh. 2016. Measuring the State of the Art of Automated Path-way Curation Using Graph Algorithms - A Case Study of the mTOR Pathway.ArXiv e-prints. J. Szostak, S. Ansari, S. Madan, J. Fluck, M. Talikka,