Original Scientific Papers Soil & Water Res., 3, 2008 (Special Issue 1): S123–S129
It is now widely accepted that the wettability of surface soil alters considerably depending on its moisture content and coatings by water repellent compounds. These compounds have a biologi-cal origin, formed from decaying organic matter (aliphatic hydrocarbons, amphiphilic substances), living or dead organisms (e.g. fungal hyphae) and microbial exudates (Nunan et al. 2002). When soil particles are coated sufficiently by these com-pounds, drying can result in hydrophobic behaviour that resists or retards surface water infiltration. In extreme instances, water infiltration is impeded completely and the soils are classified as water repellent (e.g., Wahl et al. 2003, 2005). Most soils appear to wet readily, but the recent development of more sensitive testing approaches, has shown that small levels of water repellency might exist in
many soils, with significant environmental impacts (Hallett et al. 2004).
The potential impacts of soil water repellency are reduced infiltration capacity, unstable wetting front with fingers (Bauters et al. 2000), prefer-ential flow, faster transport of solutes, variations in soil water content (Dekker & Ritsema 1994) affecting plant growth, and possibly increased overland flow and soil erosion. Forecasting and controlling the associated environmental risks of this phenomenon requires measures of water repellency in soil hydrology investigations, but this is complicated by the spatial variability of this property at various scales (Hallett et al. 2004).
Several approaches exist for quantifying the soil water repellency. These include: water drop
Supported by the Slovak Grant Agency APVV, Grant No. 51-030205 and the Slovak Grant Agency VEGA, Grant No. 2/6003/26. The Scottish Crop Research Institute receives grant-in-aid from the Scottish Goverment.
Spatial Variability of Water Repellency in Pine Forest Soil
Tomáš ORfánuS
1, Zoltán BedRna
2, Ľubomír LIchneR
1, Paul d. hallett
3,
Karol Kňava
1and Michal SeBíň
11
Institute of hydrology, Slovak academy of Sciences, Bratislava, Slovakia;
2department
of Soil Science, faculty of natural Sciences, comenius university, Bratislava, Slovakia;
3
Scottish crop Research Institute, Invergowrie, dundee, united Kingdom
Abstract: The variability of water repellency of pine-forest arenic regosols and its influence on infiltration processes were measured in southwest Slovakia. The water drop penetration time (WDPT) tests of soil water repellency and infiltration tests with a miniature tension infiltrometer (3 mm diameter) were performed. Large differences in infiltration were observed over centimetre spatial resolution, with WDPT tests suggesting water repellency varying from extreme to moderate levels. For soils with severe to extreme water repellency determined with WDPT, steady state infiltration was not reached in tests with the miniature tension infiltrometer, making it impossible to estimate sorptivity. Where sorptivity could be measured, the correlation with WDPT was poor. All results suggest that hydraulic properties of soil change below the centimetre scale resolution of the current study, probably due to a presence of unevenly distributed hydrophobic material.
penetration time (WDPT) test, molarity of ethanol droplet assessment (Roy & McGill 2002), contact angle by capillary rise (Czachor 2006; Czachor
et al. 2008), water entry pressure (Bauters et al. 2000), index of water repellency (Hallett
et al. 2004) among others.Graber et al. (2006) examined spatial variability of water repellency along several transects of 1.2 m length in a cit-rus orchard with extremely repellent soils in the central part of the Israel. They used the water drop penetration time test (WDPT), where the time taken for a drop of water to infiltrate soil is a measure of the persistence of water repellency (Dekker & Ritsema 1994). In individual 5 cm × 5 cm soil cores taken at 3 cm spacings along the transect, they found less that 10% variability within cores but extreme variability between cores. This suggests extremely variable infiltration will result along the transect, with major impacts to the first few minutes of infiltration when erosion and preferential flow paths develop.
An environment where more extreme water repel-lency is commonplace is under coniferous forest. The often low pH of the soil combined with waxes from pine needles and a microbial community dominated by fungi has been shown in numer-ous studies to contribute to the development of water repellency (Wahl et al. 2003). However, no study to date has examined the spatial variability of water repellency at small scale in coniferous forest soil. The objective of this study was to ex-amine the variability of soil water repellency and its relation to water sorptivity for a pine forest in southwest Slovakia. The sorptivity was measured with a 3 mm diameter infiltrometer at 100 cm3 sample scale. Temporal variability was assessed by taking measurements during hot and dry spells with well-pronounced water repellency.
MATERIALS AND METHODS
Experimental site and sampling
The experimental site is located at Mláky II near Sekule on the Borská nížina lowland (southwest Slovakia) where the sand dunes with surface eolian
sand cover about 570 km2 (Kalivodová et al. 2002). Elevation of the studied locality is 150 m a.s.l., the average annual air temperature is 9°C, and annual precipitation is 500–600 mm. The soil was a Regosol formed from wind blown sand (WRB 1994) and had a sandy texture (Soil Survey Division Staff 1993). The thickness of the A horizon varied from 1.5 to 7 cm. The basic physical and chemical properties of the surface horizon are presented in Table 1. Beneath the organo-mineral A horizon was an unconsolidated mineral C horizon of eo-lian sand that extended to groundwater table at a depth of about 2 m.
Pedon description:
F –1.5–0 cm: partly decomposed litter layer, Ao 0–7 cm: surface organo-mineral ochric hori-zon with colour 10YR 6/2 (according to Munsell designations),
C 7–80 cm: horizon with colour 10YR 7/3–8/3, C(Go) > 80 cm: colour 10YR 8/3, local spots: 6/8.
The soil was covered mostly by the moss species
Polytrichum piliferum, then by lichens (cladonia
sp.), and in isolated cases by the grass species co-rynephorus canescens. More detailed description of plant and microbial species on the locality could be found in Lichner et al. (2005, 2007).
The top 5 cm soil surface layer was sampled in the pine forest on 18th July 2007. The age of the pine trees (Pinus sylvestris) in the forest was about 30 years. Stainless steel cylinders of 100 cm3 volume and 5 cm height were used for obtaining undisturbed samples by pressing the cylinders into the soil. Samples were taken in three clusters, each containing 3 samples, 5–10 cm apart. Two clusters were located under the pine trees and one cluster between the trees. Thus, the total number of samples was nine. Cylinders were lifted carefully out of the soil and fitted at each end with metal caps to prevent changes in soil water content.
Water repellency estimation
In the laboratory, the caps were removed from the soil samples and the water repellency of the soil surfaces was determined by the water drop
penetra-Table 1. Physical and chemical properties of the soil samples taken at Mláky II near Sekule (southwest Slovakia)
Depth (cm) Sand (%) Silt (%) Clay (%) CaCO3 (%) C (%) pH(H2O) pH(KCl)
[image:2.595.58.533.721.755.2]Original Scientific Papers Soil & Water Res., 3, 2008 (Special Issue 1): S123–S129
tion time (WDPT) test. The volume of water in a droplet was 58 ± 5 μl. A total of 10 to 14 drops of distilled water were placed on the surface of each soil sample, and the time that elapsed before the drops were absorbed was determined.
Eight repellency classes were distinguished fol-lowing Dekker and Ritsema (1994): Class I (wet-table, not water repellent): infiltration within 5 s; Class II (slightly water repellent): 5 s < WDPT ≤ 60 s; Class III (strongly water repellent): 60 s < WDPT ≤ 600 s; Class IV (severely water repellent): 600 s < WDPT ≤ 3600 s; Class V (extremely wa-ter repellent): 1 h < WDPT ≤ 2 h; Class VI: 2 h < WDPT ≤ 3 h; Class VII: 3 h < WDPT ≤ 4 h; Class VIII: WDPT > 4 h.
Measurement of water transport using miniaturized tension infiltrometer
After finishing the WDPT tests, the soil samples were air-dried until water loss ceased (approxi-mately 10 days at 22°C) and infiltration measure-ments performed. We used a miniature tension infiltrometer, similar to that described by Hallett and Young (1999). The infiltrometer consisted of a 3.0-mm radius tip that housed a sponge to enable good soil contact and the establishment of a nega-tive pressure head. Water was supplied to the tip via a flexible pipe that connected to a reservoir on a recording balance accurate to 0.01g (Figure 1). Twenty-five infiltration measurements were taken on twelv samples. All measurements were done at –20 mm pressure head and the steady-state rate
of water uptake, Q was recorded from the mass loss on the balance. Sorptivity, S, was calculated using (Hallett et al. 2004)
(1)
where:
b – parameter dependent on the soil-water diffusivity function (taken as 0.55 following recommenda-tions of White and Sully (1987) for soils with unknown b parameter)
r – radius of the infiltrometer tip (3.0 mm)
f – fillable (air-filled) porosity (0.36), measured from the soil density
In some soils the infiltration of water was negligi-ble, so water sorptivity could not be calculated.
RESuLTS AND DIScuSSION
Under the pine forest all classes of soil water repellency were identified using the WDPT ap-proach. The most frequent classes were class III (22.5%), class IV (23.3%), and class VIII (20%). Thus, generally, the soils of the research plot could be characterized as strongly or extremely water repellent. Within an individual soil core, extremely variable water repellency was also found. Each core has surface area of 22 cm2 and over this small area the coefficient of variation of WDPT as a measure of its relative variability ranged between 23 and 135%. The average number of repellency classes identified on an individual core was 3 (Figure 2a).
Figure 1. The miniaturized tension infiltrometer apparatus
1 – soil sample, 2 – sponge tip enabling good soil contact, 3 – conductance tube, 4 – flexible pipe, 5 – water table, 6 – reservoir, 7 – balance
br Qf S
[image:3.595.61.536.537.757.2]s (class VIII). This might suggest that the highest levels of WDPT values exhibit some type of spatial connectivity. It was interesting that the extreme samples with greatest and least spatial variability in WDPT were only 25 cm apart on the pine forest Figure 2. Spatial variability of water drop penetration time (WDPT) values at sample scale (22 cm2) and occurrence
frequencies of particular soil water repellency classes
At most, the soil water repellency extended across 5 classes (Figure 2b; sample 41), with only one sample having only one WDPT class range (Fig-ure 2c; sample 98). The latter was the most water repellent core, however, with WDPTs above 14400
(a) (b) (c) b c 205 WDPT [s] N o of o bs 0 1 2 3 4 5 6 <= 5
(5;60](60;600](600;3600](3600;7200](7200;10800](10800;14400]> 14400
98 WDPT [s] N o of o bs 0 1 2 3 4 5 6 7 8 9 10 11 12 13 <= 5
(5;60](60;600](600;3600](3600;7200](7200;10800](10800;14400]> 14400 041 WDPT [s] N o of o bs 0 1 2 3 4 5 <= 5
(5;60](60;600](600;3600](3600;7200](7200;10800](10800;14400]> 14400
b c 205 WDPT [s] N o of o bs 0 1 2 3 4 5 6 <= 5
(5;60](60;600](600;3600](3600;7200](7200;10800](10800;14400]> 14400
98 WDPT [s] N o of o bs 0 1 2 3 4 5 6 7 8 9 10 11 12 13 <= 5
(5;60](60;600](600;3600](3600;7200](7200;10800](10800;14400]> 14400
041 WDPT [s] N o of o bs 0 1 2 3 4 5 <= 5
(5;60](60;600](600;3600](3600;7200](7200;10800](10800;14400]> 14400 b c 205 WDPT [s] N o of o bs 0 1 2 3 4 5 6 <= 5
(5;60](60;600](600;3600](3600;7200](7200;10800](10800;14400]> 14400
98 WDPT [s] N o of o bs 0 1 2 3 4 5 6 7 8 9 10 11 12 13 <= 5
(5;60](60;600](600;3600](3600;7200](7200;10800](10800;14400]> 14400
041 WDPT [s] N o of o bs 0 1 2 3 4 5 <= 5
(5;60](60;600](600;3600](3600;7200](7200;10800](10800;14400]> 14400 -2.5 -2 -1.5 -1 -0.5 0 0.5 1 1.5 2 2.5
cm -2.5 -2 -1.5 -1 -0.5 0 0.5 1 1.5 2 2.5 cm 0 200 400 600 800 1000 1200 1400 1600 1800 2000 2200
-2.5 -2 -1.5 -1 -0.5 0 0.5 1 1.5 2 2.5 cm -2.5 -2 -1.5 -1 -0.5 0 0.5 1 1.5 2 2.5 cm 3000 4000 5000 6000 7000 8000 9000 10000 11000 12000 13000 14000 15000 16000
Original Scientific Papers Soil & Water Res., 3, 2008 (Special Issue 1): S123–S129
floor. As the scale of measurement increased, the variability of WDPT did not exceed the variability detected at single sample scale (Table 2).
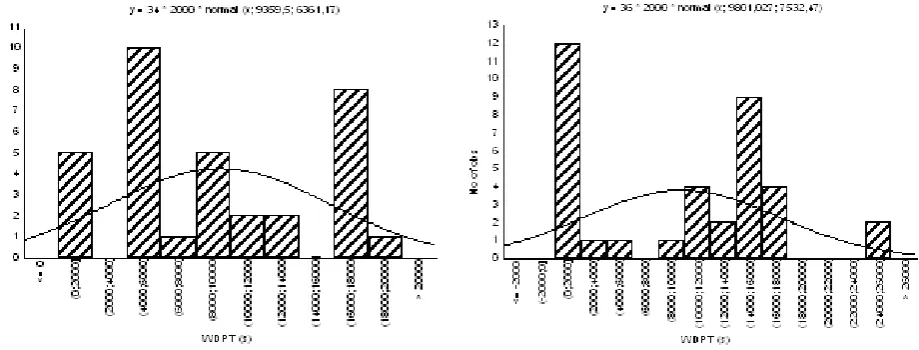
Within a particular sample clusters (each contain-ing 3 samples), it was interestcontain-ing to find that two of them (Cluster II and Cluster III) had very similar frequency distributions of WDPT values (Figure 3). The difference between them was not confirmed by Kolmogorov-Smirnov test even at the significance level P = 0.1 (Table 2). This has nothing to do with the original position of sample clusters (under or between the trees) on the forest floor.
The strong to extreme water repellency detected with the WDPT tests was supported by the tests with the miniature tension infiltrometer. Over 70% of the tests performed had too slow a rate of water uptake for water sorptivity to be determined from early-time steady-state infiltration. On tests where water infiltration did occur, a steady-state occurred between 25 s and 100 s, similar to previ-ous findings by Hallett and Young (1999) (Fig-ure 3). This was observed at a range of repellency
classes I–III. The sorptivity was determined for these situations, but there was only a weak relation between the sorptivity and WDPT values (Table 3). In about 30% of the samples tested, no infiltration was observed after a very long time (> 5 hours). On the remaining samples that did show steady-state water infiltration, water began to enter after a prolonged period or progressed chaotically. We assume that such variable behaviour of millimetre-scale infiltration is caused by the heterogeneous distribution of hydrophobic surfaces in different pores. It seems that this property of soil can dra-matically change in very short distances in both directions (Wahl et al. 2003, 2005).
[image:5.595.63.531.102.188.2]The impacts on hydrology could therefore be massive, but the impacts of water repellency need to be disentangled from pore structure, which has been shown to influence sorptivity at small-scale significantly (Kutílek & Nielsen 1994). Research by Hallett et al. (2004) suggests, however, that the impact of water repellency on sorptivity may exceed pore structure variation.
Table 2. Descriptive and comparative statistics of various water drop penetration time (WDPT) data sets
WDPT data set Location n Mean SD cv (%) K-S test
Complete 104 6478 6712 104
Cluster I under the tree 34 1234 1383 112 CL. I–CL. II*
Cluster II between the trees 36 9801 7532 77 CL. I–CL. III*
Cluster III under the tree 34 9359 6361 68 CL. II–CL. III**
n – number of measurements, SD – standard deviation, cv – coefficient of variation, K-S test – Kolmogorov-Smirnov test of significant difference between distributions of particular data sets
*significant difference at P < 0.001; **not significant difference at P > 0.1
[image:5.595.70.530.554.729.2]Figure 4. An example of infiltration measure-ment, when process started immediately after establishing the soil contact. This situation was observed for repellency classes I–III
Biological material (e.g. cells of plant organisms) is unevenly distributed in soil. It contains various organic matters like polysaccharides, lipids, and waxes, all with different affinities to water. Baut-ers et al. (2000) showed that the extent of water repellency in soil pores was extremely sensitive to organic coatings. By changing the concentration of octadecyltrichlorosilane
(
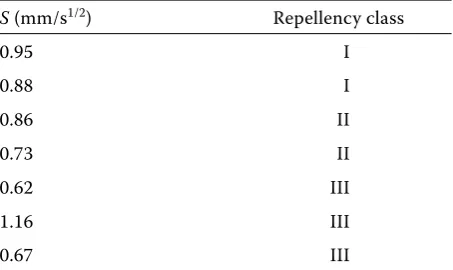
octadecyltrichlorosilane is an amphiphilic molecule consisting of a long-chain alkyl group (C18H37–) and a polar head group (SiCl3–), which forms Self-Assembled Monolayers (SAMs) on various oxidic substrates) from 3.1% to 5.7%, the pore volume affected by water repellent material increased from 37% to 60%.The results of WDPT and infiltration tests sug-gested that soil water repellency did not have a contiguous surface distribution at single-sample scales. If a spatial organization of soil water repel-lency does occur, one should go in search for it at microscopic scale. This is in agreement with the findings of Hallett et al. (2004). The infiltration measurements with miniature tension infiltrom-eter showed early-time steady-state infiltration on sample with WDPT classes I, II, and III only. The values ranged between 0.62 and 1.16 mm s–1/2
but there was no direct relationship between sorp-tivity and WDPT (Table 2).
cONcLuSION
The water repellency of pine-forest arenic re-gosols and its influence on soil water sorptivity were determined. It can be stated that water repellency and hence infiltration are spatially heterogeneous in soil, presumably due to soil biota and terrestrial plants. The WDPT test of soil water repellency exhibited great variability even at the sample scale (22 cm2), mostly extending across 3 repellency classes, maximally 5 classes. Further increasing of measurement scale did not exceed the WDPT variability. From measure-ments of soil sorptivity, we conclude that water can infiltrate readily the soil surface, which is hydrophobic up to IIIrd WDPT class. For more than a quarter of the samples tested, minimal water uptake from the infiltrometer occurred even after several hours. These tended to be for cores with severe to extreme repellency (classes VI, VII, and VIII). This study showed that water repellency exacerbated the great variability of soil hydraulic properties.
References
Bauters T.W.J., Steenhuis T.S., DiCarlo D.A., Nieber J.L., Dekker L.W., Ritsema C.J., Parlange J.Y., Haver-kamp R. (2000): Physics of water repellent soils. Journal of Hydrology, 231–232: 233–243.
Czachor, H. (2006): Modelling the effect of pore structure and wetting angles on capillary rise in soils having different wettabilities. Journal of Hydrology, 328: 604–613.
Czachor H., Flis-Bujak M.,Kafarski M., Król A. (2008): Wetting angle and water sorptivity in mineral Table 3. Estimated sorptivities S related to repellency
classes
S (mm/s1/2) Repellency class
0.95 I
0.88 I
0.86 II
0.73 II
0.62 III
1.16 III
0.67 III
0.5
0.4
0.3
0.2
0.1
0
0 5 10 15 20
t1/2 (s1/2)
m
(g
[image:6.595.64.291.620.755.2]Original Scientific Papers Soil & Water Res., 3, 2008 (Special Issue 1): S123–S129
soils. Soil and Water Research, 3 (Special Issue 1): S52–S57.
Dekker L.W., Ritsema C.J. (1994): How water moves in a water repellent sandy soil: 1. Potential and actu-al water repellency. Water Resources Research, 30: 2507–2517.
Graber E.R., Ben-Arie O., Wallach R. (2006): Effect of sample disturbance on soil water repellency deter-mination in sandy soils. Geoderma, 136: 11–19. Hallett P.D., Young I.M. (1999): Changes to water
repellence of soil aggregates caused by substrate-induced microbial activity. European Journal of Soil Science, 50: 35–40.
Hallett P.D., Nunan N., Douglas J.T., Young I.M. (2004): Millimeter-scale spatial variability in soil water sorptivity: scale, surface elevation, and subcritical repellency effects. Soil Science Society of America Journal, 68: 352–358.
Kalivodová E., Kubíček F., Bedrna Z., Kalivoda H., Gavlas V., Kollár J., Gajdoš P., Štepanovičová O. (2002): Sand Dunes of Slovakia. Luka-Press, Bra-tislava. (in Slovak)
Kutilek M., Nielsen D.R. (1994): Soil Hydrology. Catena Verlag, Cremlingen-Destedt.
Lichner Ľ., Nižnanská Z., Faško P., Šír M., Tesař M. (2005): The impact of plant cover and weather on soil-hydrological parameters of a water repellent soil at the locality Mláky II at Sekule. Acta Hydrologica Slovaca, 6: 321–329. (in Slovak)
Lichner Ľ., Hallett P.D., Feeney D., Ďugová O., Šír M., Tesař M. (2007): Field measurement of the impact of hydrophobicity on soil water transport under different vegetation over time. Biologia, 62: 537–541.
Nunan N., Ritz K., Wu K., Young I. M., Crawford J. W. (2002): In situ spatial patterns of soil bacterial populations, mapped at multiple scales in arable soil. Microbial Ecology, 44: 296–305.
Roy J.L., McGill W.B. (2002): Assessing soil water repellency using the molarity of ethanol droplet (MED) test. Soil Science, 167: 83–97.
Soil Survey Division Staff (1993): Soil Survey Manual. Soil Conservation Service. U.S. Department of Agriculture Handbook 18, Washington, DC.
Wahl N.A., Bens O., Schäfer B., Hüttl R.F. (2003): Impact of changes in land-use management on soil hydraulic properties: hydraulic conductivity, water repellency and water retention. Physics and Chemistry of the Earth, 28: 1377–1387.
Wahl N.A., Wöllecke B., Bens O., Hüttl R.F. (2005): Can forest transformation help reducing floods in forested watersheds? Certain aspects on soil hydraulics and organic matter properties. Physics and Chemistry of the Earth, 30: 611–621.
White I., Sully M.J. (1987): Macroscopic and micros-copic capillary length and time scales from field infil-tration. Water Resources Research, 23: 1514–1522. WRB (1994): World Reference Base for Soil Resources.
Wageningen/Rome.
corresponding author:
RNDr. Tomáš Orfánus, Ph.D., Institute of Hydrology, Slovak Academy of Sciences, Račianska 75, 831 02 Bratislava, Slovakia