Soil respiration is closely associated with eco-system carbon cycle and global climate change, and related research has become one of the main directions in the field of global climate change research. As the important component of the ter-restrial ecosystem, farmland ecosystem had the most active carbon pool in the worldwide relation because it was subjected to intense anthropogenic disturbance (Han et al. 2008). Wang et al. (2009b) has once proposed the triple intercropping system of wheat-maize-soybean as a new conservation tillage pattern which is highly efficient, ecologi-cal, and water saving. Most studies investigate the soil respiration in single crop field, few research cases deal with multiple cropping, crop rotation and relay-intercropping. Especially the influencing factors of soil respiration in the triple intercrop-ping system of wheat-maize-soybean in the purple
soils in the hilly area of southwest China have not been reported, yet.
Recently, a lot of works show that soil animals stimulate the soil CO2 emission for they directly take part in the original process of material cycle and soil respiration (Zhu and Wei 2007, Speratti and Whalen 2008). At present, the object is mainly concentrated in a few groups such as earthworms, termites, and nematodes (Liu and Zou 2002, Fu et al. 2005, Luo et al. 2008). It was difficult to precise that soil animal respiration contributes to soil respiration because of the complexity in composition, and sensitive response to environ-mental changes and greatly different regions and habitat of soil animals. These factors hinder the development of general rule of soil respiration. In view of the important status and role of soil animals underground in the ecological system,
Soil respiration in a triple intercropping system
under conservation tillage
S. Zhang, L.C. Wang, C. Shi, J. Chen, Q. Zhou, Y. Xiong
College of Agronomy and Biotechnology, Southwest University, Key Laboratory
of Eco-environments in the Three Gorges Reservoir Region, Engineering Research
Center of South Upland Agriculture, Ministry of Education, Beibei District,
Chongqing, P.R. China
ABSTRACT
Drivers of soil respiration (Rs) in farmland ecosystem have already been widely studied. However, the relationship between Rs and soil fauna (Fs), hydrothermic factor in the triple intercropping system remains poorly known. An LI-6400 XT portable photosynthesis measurement system equipped with a soil respiratory chamber was adopted in the experimental field. Straw mulching treatment increased soil respiration rate but ridge tillage treatment did not have a consistent effect. A regression analysis of the relationship revealed that exponential equation fitted well the relationship between Rs and soil temperature at 10 cm soil depth. However, the relationship between Rs and soil moisture was best confirmed by a parabolic function. The common dominant groups of Fs in wheat, corn, and soy-bean farmland were Collembola and Acarina, while Diptera emerged in the two rear crops farmlands. Compared to the control, ridge tillage reduced the number of Fs, but straw mulching increased it and improved the index of soil fauna diversity. In conclusion, the higher was the amount of animals being active above soil surface, the stronger was the soil respiration.
Keywords: triple cropping in dryland; wheat-maize-soybean; soil hydrothermic factor; soil animals
it is essential to study the soil animals for soil respiration principle. Therefore, in the present study, we examined soil respiration in response to soil animals coupling soil temperature and soil moisture in wheat-corn-soybean cropping system.
MATERIAL AND METHODS
Study areas and site description. The study was conducted from November 2012 to October 2013 on the teaching experimental farm, under the triple intercropping system of wheat-maize-soybean. Conservation tillage lasted for 7 years under a con-sistent tillage annually. There were six treatments: (1) traditional tillage (T) – using convention planting for the entire experimental period; (2) ridge tillage (R) – ridge was 20 cm high; (3) traditional tillage + straw mulching (TS) – using straw mulch for the en-tire experimental period with all the harvested straw maintained in situ; (4) ridge tillage + straw mulch-ing (RS) – mulchmulch-ing straw on the ridge durmulch-ing the entire experimental period and keeping ridge 20 cm high; (5) traditional tillage + straw mulching + decomposing inoculants (TSD) – traditional tillage with crop straw left in the field as mulch amended with straw decomposing agent; and (6) ridge tillage + straw mulching + decomposing inoculants (RSD) – ridge tillage with crop straw left in the field as mulch amended with straw decomposing agent. The test used randomized block arrangement. Each plot had an area of 8.0 m × 3.6 m which was subdivided into four stripes each 1.0 m wide and 3.6 m long. Wheat was seeded three lines in each stripe, each line with 17 seeded holes. The su-perphosphate fertilizer was applied at 390 kg/ha and urea at 152 kg/ha as basal fertilization at plant-ing. Corn was transplanted in two lines in each stripe and each line had 8 holes. Basal fertilizer applied at transplanting was compound fertiliz-er (148 kg/ha) and urea (74 kg/ha). Soybean was seeded in three lines in each stripe and each line had 12 holes. Basal fertilizer applied at planting was compound fertilizer (300 kg/ha). The straw used for mulching was the previous harvested wheat and corn, uniformly covered in the district, each plot with 42.7 kg, equivalent to 24 000 kg/ha. The decomposing inoculants were composite bacte-ria which had living bactebacte-ria ≥ 109 colony-forming units/g. The applying amount was 0.2% of straw amount, dissolved in water and then was evenly
sprayed on the straw. Soybean was sowed in the strip planted with wheat originally and that was named W-S strip. Maize strip which was idle in maize transplanting before and after harvest was named C-K strip.
Soil respiration was measured every two weeks by using an infrared gas analyzer (Li-Cor 6400 potable photosynthesis system fitted with a 6400-09 soil CO2 flux chamber, LI-COR Inc., Lincoln, USA) during the whole growth period. Self-made PVC collars (11 cm in diameter and 5 cm high) were placed at three fixed points in the measurement area, with 1 m in spacing and installed one day prior to measurement to minimize the disturbance of the soil. Each PVC collar was measured once in 3 cycles. Each treatment was repeated three times. All the measurements for each time were conducted between 9:00 a.m. and 11:00 a.m. to minimize the impact of the diurnal variation in soil respiration. Soil temperature was recorded simul-taneously with soil respiration by the probe in the infrared gas analyzer; the depth in soil was 10 cm. Soil moisture in the 0–5 cm soil layer was deter-mined by oven drying method when soil respiration and soil temperature were measured. Soil fauna was surveyed every two weeks by tullgren apparatus and pitfall traps method using random sampling method (quadrat was 10 cm × 10 cm × 5 cm). The soil animal separation was determined during the first four treatments.
Diversity index (Shannon-Wiener): H = –∑(PilnPi) Evenness index (Pielou): E = H/lnS Dominance index (Simpson): C = ∑(Pi)2 Richness index (Menhinick): D = lnS/lnN Where:Pi = ni/N, ni– number of individuals in the ist group;
N – number of individuals of all groups in the community;
S – number of the groups.
The Q10 index indicated relationship between soil temperature and soil respiration. It meant multiplication of soil respiration rate when soil tem-perature increased by 10°C. Calculation formula:
Y = a × ebx, Q
10 = e10b
Where: Y – soil respiration rate; a,b – simulation param-eters; x – soil temperature.
respiration rate and soil temperature, soil moisture and the number of soil fauna. All differences were tested for statistical significance at the 95% level. Statistical analyses were performed with SPSS 13.0 (Chicago,USA) and Excel 2003 (Beijing,China).
RESULTS AND DISCUSSION
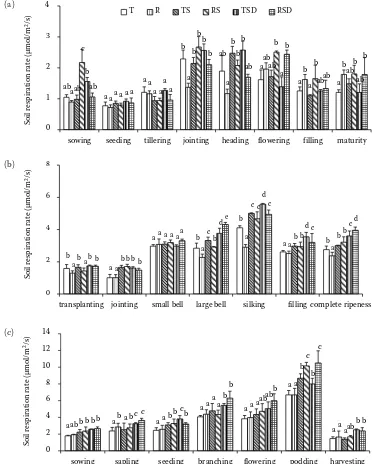
The dynamics of soil respiration rate. In the wheat growing seasons, the average soil respiration
[image:3.595.102.480.249.713.2]rate was 1.53 μmol/m2/s with fluctuations between 0.89 and 2.67 μmol/m2/s. Ridge tillage treatment reduced soil respiration from the jointing stage but it was opposite when after heading stage. Straw mulching treatment had little influence on soil res-piration during the whole period because the straw cover coming from previous crops decayed. In the soybean growing period, soil respiration rate was ranged between 1.34 and 10.50 μmol/m2/s. There was a severe decrease to 62–84% in the harvesting stage as a result of soil temperature which was low
Figure 1. Soil respiration rate in growing seasons of (a) wheat; (b) corn and (c) soybean. T – traditional tillage; R – ridge tillage; TS – traditional tillage + straw mulching; RS – ridge tillage + straw mulching; TSD – traditional tillage + straw mulching + decomposing inoculants; RSD – ridge tillage + straw mulching + decomposing inoculants
ab a a b ab a
a a a
a
a a a
ab
b b
ab a a
b b
ab
a
ab c
a a
b
b
b
b b b
a
a
b b
a
ab ab
ab a a
b ab b ab b 0 1 2 3 4
sowing seeding tillering jointing heading flowering filling maturity
Soi l re sp ira tion ra te (μ mol /m 2/s
) T R TS RS TSD RSD
b
a
a b
b
a b
a a
a
a
a
a a
b b
a c
c
b b
a b
a b
c
b b
b b
a
d
d
d c
b b
a
e
c
c d
0 2 4 6 8
transplanting jointing small bell large bell silking filling complete ripeness
Soi l re sp ira tion ra te (μ mol /m 2/s)
a a a
a a
a
a
ab b a
a a
a
a
b a b
a a
b
a
b b b
a ab
c
ab
b c c
b ab
b
b
b c b
b b
c b 0 2 4 6 8 10 12 14
sowing sapling seeding branching flowering podding harvesting
when the soybean was mature, leading to reduced soil microbial activity. The soil respiration rate which was between 1.01 and 5.58 μmol/m2/s during the whole growing season was the minimum in the jointing stage of corn, which was only 1.01 μmol/m2/s. Along with the growth of corn, it began to increase and reached to the maximum in the silking stage. Straw mulching treatment enhanced soil respiration was certainly consistent, and the effect on soil respiration was gradually weakened as the straw decomposed (Zhang et al. 2005, Guan et al. 2011). The influence of ridge tillage on soil respiration was not constant. It was contrary in different crops with conventional and ridge tillage and also varied with growth stages in the same crop (Wang et al. 2009a).
Soil respiration and influencing factors. In the farmland ecosystem, the relationship between soil
[image:4.595.64.532.113.256.2]respiration and soil temperature was described as the exponential function, linear function, power function, parabolic function and so on. The fitting models used by different scientists were not the same (Zhu et al. 2008). However, the exponential function was used widespread, and Q10 index model could correctly reflect the relationship between them. Precvious studies showed that the value of Q10 was between 1.3 and 5.6 (Sun et al. 2009). In our study, the value was between 2.25 and 2.69 (Table 1). Ridge and straw mulching increased the Q10 value but this trend was decreased by adding decomposing inoculants. The high temperature sensitivity meant that lower soil temperature would bring greater decreases in soil respiration. Therefore, straw mulching treatment helps to cut carbon emissions because it reduced the soil temperature.
Table 1. Relationship between soil respiration rate and soil temperature
Code temperature (°C)Average soil a b numberSample equationFitting R2 P Q
10 T 23.09 0.344 0.085 20 Rs= 0.344e0.085T 0.512 0.000 2.34
R 23.13 0.357 0.083 20 Rs= 0.357e0.083T 0.429 0.002 2.41
TS 23.20 0.279 0.099 20 Rs = 0.279e0.099T 0.461 0.001 2.69
RS 23.10 0.407 0.083 20 Rs = 0.407e0.083T 0.405 0.003 2.41
TSD 23.18 0.340 0.093 20 Rs = 0.340e0.093T 0.537 0.000 2.53
RSD 23.17 0.451 0.081 20 Rs = 0.451e0.081T 0.289 0.014 2.25
W-S 23.16 0.311 0.095 60 Rs = 0.311e0.095T 0.465 0.000 2.59
C-K 22.98 0.350 0.088 60 Rs = 0.350e0.088T 0.423 0.000 2.41
T – traditional tillage; R – ridge tillage; TS – traditional tillage + straw mulching; RS – ridge tillage + straw mulch-ing; TSD – traditional tillage + straw mulching + decomposing inoculants; RSD – ridge tillage + straw mulching + decomposing inoculants; W-S – strip planted with wheat and soybean; C-K – strip planted with corn; a,b – simulation parameters; Q10 – multiplication of soil respiration rate when soil temperature increased by 10°C
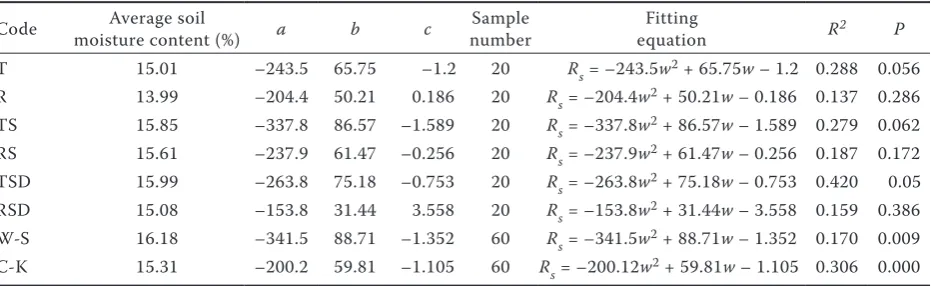
Table 2. Relationship between soil respiration rate and soil moisture
Code moisture content (%)Average soil a b c numberSample equationFitting R2 P
[image:4.595.66.532.572.715.2]The relationship between soil respiration and soil moisture was described as exponential func-tion, linear funcfunc-tion, power function and parabolic function (Meng et al. 2008). In this study, the re-lationship can be well described with a parabolic function (Table 2). According to the mathemati-cal meaning of the function, it could be easily understood that soil moisture had a bidirectional regulation effect on soil respiration. Soil respira-tion was promoted by increasing soil moisture in relatively dry state, while it was inhibited when the soil moisture content exceeded a given limit (Che et al. 2010). The given limit in our study was 14.94%.
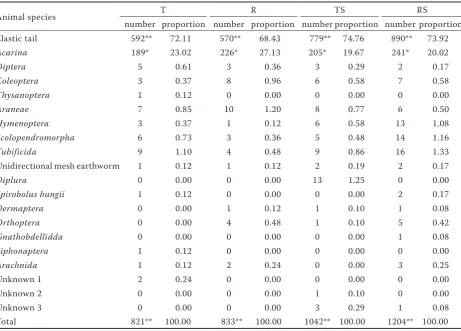
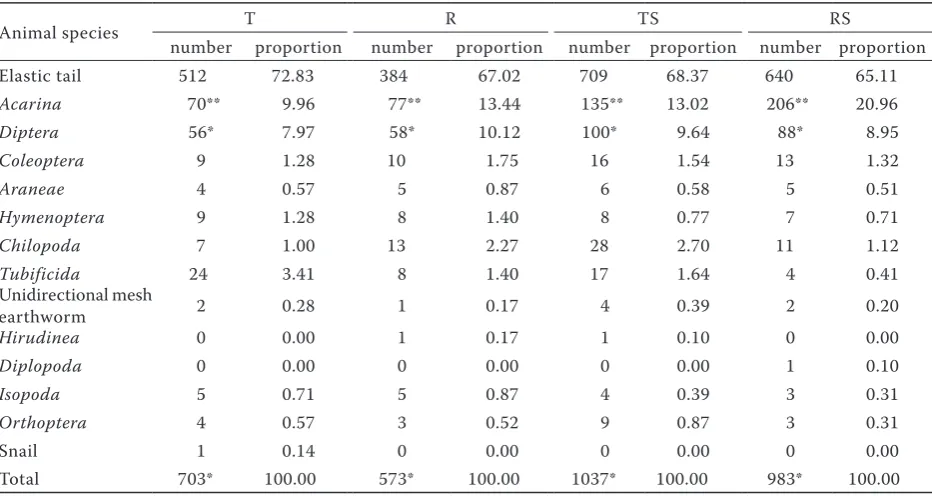
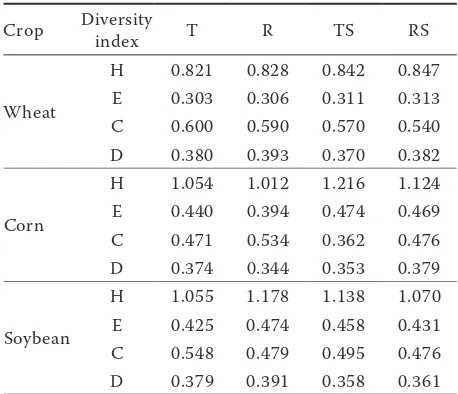
The numbers of soil fauna was seized by the Tullgren apparatus method during the growth period of wheat, corn and soybean reached 3893, 3111 and 3296 per 500 cm3, respective-ly. The number of soil animal species was 20, 15 and 14, respectively (Tables 3, 4 and 5). It can be concluded that soil animal
[image:5.595.68.530.112.443.2]communi-ty structure changed more stably under long-term straw mulching in farmland (Table 6). Correlation analysis between soil respiration and the number of soil fauna showed that the two had a correlation. The average soil respiration at two time points was multiplied by the number of days, that is, the soil respiration of the two sampling interval was obtained. The number of soil fauna was obtained by the average of soil fauna in the two sampling time points. In corn farmland, cor-relation index was the highest under ridge tillage treatment (r = 1.000; P = 0.017). The second was the straw mulching treatment (r = 0.915; P = 0.029). However, it only emerged the soil fauna cap-tured by pitfall traps method. The correlation index of RS treatment reached significant level (r = 0.930; P = 0.022) when correlation analysis of all soil fauna by the two methods and soil respira-tion. The phenomenon also appeared in soybean soil where the correlation index of T treatment reached significant level (r = 0.901; P = 0.037). As Table 3. Number and proportion of soil animals under different treatments during growing period of wheat
Animal species T R TS RS
number proportion number proportion number proportion number proportion Elastic tail 592** 72.11 570** 68.43 779** 74.76 890** 73.92
Acarina 189* 23.02 226* 27.13 205* 19.67 241* 20.02
Diptera 5 0.61 3 0.36 3 0.29 2 0.17
Coleoptera 3 0.37 8 0.96 6 0.58 7 0.58
Thysanoptera 1 0.12 0 0.00 0 0.00 0 0.00
Araneae 7 0.85 10 1.20 8 0.77 6 0.50
Hymenoptera 3 0.37 1 0.12 6 0.58 13 1.08
Scolopendromorpha 6 0.73 3 0.36 5 0.48 14 1.16
Tubificida 9 1.10 4 0.48 9 0.86 16 1.33
Unidirectional mesh earthworm 1 0.12 1 0.12 2 0.19 2 0.17
Diplura 0 0.00 0 0.00 13 1.25 0 0.00
Spirobolus bungii 1 0.12 0 0.00 0 0.00 2 0.17
Dermaptera 0 0.00 1 0.12 1 0.10 1 0.08
Orthoptera 0 0.00 4 0.48 1 0.10 5 0.42
Gnathobdellidda 0 0.00 0 0.00 0 0.00 1 0.08
Siphonaptera 1 0.12 0 0.00 0 0.00 0 0.00
Arachnida 1 0.12 2 0.24 0 0.00 3 0.25
Unknown 1 2 0.24 0 0.00 0 0.00 0 0.00
Unknown 2 0 0.00 0 0.00 1 0.10 0 0.00
Unknown 3 0 0.00 0 0.00 3 0.29 1 0.08
a result, it was needed to expand the scope of soil animal captured for study in the relationship more clearly between soil respiration and soil fauna.
In conclusion, the daily average soil respiration rate under different crops farmland was sequenced by wheat < corn < soybean. Compared with con-Table 4. Number and proportion of soil animals under different treatments during growing period of corn
Animal species T R TS RS
number proportion number proportion number proportion number proportion
Elastic tail 394 64.80 368 65.95 490 55.30 752 71.01
Acarina 118 19.41 95 17.03 187 21.11 168 15.86
Diptera 70 11.51 57 10.22 90 10.16 66 6.23
Coleoptera 5 0.82 8 1.43 16 1.81 12 1.13
Thysanoptera 1 0.16 0 0.00 0 0.00 0 0.00
Araneae 4 0.66 4 0.72 8 0.90 3 0.28
Hymenoptera 1 0.16 8 1.43 3 0.34 2 0.19
Scolopendromorpha 2 0.33 3 0.54 4 0.45 9 0.85
Tubificida 11 1.81 4 0.72 20 2.26 30 2.83
Unidirectional mesh
earthworm 0 0.00 0 0.00 0 0.00 2 0.19
Blind spider 1 0.16 1 0.18 1 0.11 1 0.09
Chilopoda 1 0.16 7 1.25 7 0.79 1 0.09
Isopoda 0 0.00 0 0.00 2 0.23 4 0.38
Orthoptera 0 0.00 3 0.54 4 0.45 8 0.76
Snail 0 0.00 0 0.00 4 0.45 0 0.00
[image:6.595.66.532.109.374.2]Total 608** 100.00 558** 100.00 886** 100.00 1059** 100.00 **P < 0.01; *P < 0.05. T – traditional tillage; R – ridge tillage; TS – traditional tillage + straw mulching; RS – ridge till-age + straw mulching
Table 5. Number and proportion of soil animals under different treatments during growing period of soybean
Animal species T R TS RS
number proportion number proportion number proportion number proportion
Elastic tail 512 72.83 384 67.02 709 68.37 640 65.11
Acarina 70** 9.96 77** 13.44 135** 13.02 206** 20.96
Diptera 56* 7.97 58* 10.12 100* 9.64 88* 8.95
Coleoptera 9 1.28 10 1.75 16 1.54 13 1.32
Araneae 4 0.57 5 0.87 6 0.58 5 0.51
Hymenoptera 9 1.28 8 1.40 8 0.77 7 0.71
Chilopoda 7 1.00 13 2.27 28 2.70 11 1.12
Tubificida 24 3.41 8 1.40 17 1.64 4 0.41
Unidirectional mesh
earthworm 2 0.28 1 0.17 4 0.39 2 0.20
Hirudinea 0 0.00 1 0.17 1 0.10 0 0.00
Diplopoda 0 0.00 0 0.00 0 0.00 1 0.10
Isopoda 5 0.71 5 0.87 4 0.39 3 0.31
Orthoptera 4 0.57 3 0.52 9 0.87 3 0.31
Snail 1 0.14 0 0.00 0 0.00 0 0.00
[image:6.595.65.532.482.730.2]ventional tillage, straw mulching treatment en-hanced soil respiration rate but the ridge tillage had different effects. In wheat-soybean stripes, ridge tillage increased soil respiration rate but in corn stripe it was opposite. The experiment also shows that soil temperature and soil moisture content were the two major factors affecting soil respiration. It indicated that soil tillage patterns had great impact on soil animals. The more was the amount of animals being active above soil surface, the stronger was the soil respiration.
REFERENCES
Che S.G., Guo S.L., Zhang F., Xia X. (2010): Dynamics of soil respiration and its affecting factors in arid upland fields during summer fallow season on the Loess Plateau. Acta Pedologica Sinica, 47: 1159–1169.
Fu S.L., Ferris H., Brown D., Plant R. (2005): Does the positive feedback effect of nematodes on the biomass and activity of their bacteria prey vary with nematode species and population size? Soil Biology and Biochemistry, 37: 1979–1987.
Guan Q., Wang J., Song S.Y., Liu W.Z. (2011): Effects of differ-ent mulching measures on winter wheat field soil respiration in Loess Plateau dry land region. Chinese Journal of Applied Ecology, 22: 1471–1476. (In Chinese)
Han G.X., Zhou G.S., Xu Z.Z. (2008): Research and prospects for soil respiration of farmland ecosystems in China. Chinese Journal of Plant Ecology, 32: 719–733.
Liu Z.G., Zou X.M. (2002): Exotic earthworms accelerate plant litter decomposition in a Puerto Rican pasture and a wet forest. Ecological Applications, 12: 1406–1417.
Luo T.X., Li H.X., Wang T., Hu F. (2008): Influence of nematodes and earthworms on the emission of atmosphere trace gases
(CO2, N2O). Acta Ecologica Sinica, 28: 993–999.
Meng L., Ding W.X., Cai Z.C. (2008): The effect of temperature and water on soil respiration in long-term fertilized Fluvo-aquci soil. Ecology and Environment, 7: 693–698.
Speratti A.B., Whalen J.K. (2008): Carbon dioxide and nitrous oxide fluxes from soil as influenced by anecic and endogeic earthworms. Applied Soil Ecology, 38: 27–33.
Sun X.H., Zhang R.Z., Cai L.Q., Chen Q.Q. (2009): Effects of differ -ent tillage measures on upland soil respiration in Loess Plateau. Chinese Journal of Applied Ecology, 20: 2173–2180. (In Chinese) Wang T.C., Wei L., Tian Y., Ma C., Du Y.Y., Tan Y. (2009a): Dy-namic changes of soil respiration on mulched bed planting under winter wheat and summer maize double cropping inte-gration. Journal of Agro-Environment Science, 28: 1970–1974. Wang X.C., Yang W.Y., Yong T.W. (2009b): Analysis on present situ-ation trend of farming system and the development advantages of new 3 ripe wheat/maize/bean in dry land in southwest hilly region. Journal of Anhui Agricultural Sciences, 37: 3962–3982. Zhang Q.Z., Wu W.L., Wang M.X., Zhou Z.R., Chen S.F. (2005):
The effects of crop residue amendment and N rate on soil respiration. Acta Ecologica Sinica, 25: 2883–2887.
Zhu L.A., Wei X.G. (2007): Research progress on soil community. Ecological Science, 26: 269–273.
Zhu Y.L., Wu J.S., Tong C.L., Wang K.L., Wang Q.X. (2008):
Re-sponses of CO2 fluxes to light intensity and temperature in rice
paddy field. Environmental Science, 29: 1040–1044. (In Chinese)
[image:7.595.62.291.125.322.2]Received on June 9, 2015 Accepted on July 13, 2015
Table 6. Comparison of soil animal diversity index in wheat farmland
Crop Diversity index T R TS RS
Wheat
H 0.821 0.828 0.842 0.847 E 0.303 0.306 0.311 0.313 C 0.600 0.590 0.570 0.540 D 0.380 0.393 0.370 0.382
Corn
H 1.054 1.012 1.216 1.124 E 0.440 0.394 0.474 0.469 C 0.471 0.534 0.362 0.476 D 0.374 0.344 0.353 0.379
Soybean
H 1.055 1.178 1.138 1.070 E 0.425 0.474 0.458 0.431 C 0.548 0.479 0.495 0.476 D 0.379 0.391 0.358 0.361 H – diversity index; E – evenness index; C – dominance index; D – richness index; T – traditional tillage; R – ridge tillage; TS – traditional tillage + straw mulching; RS – ridge tillage + straw mulching
Corresponding author: