_______________________________________________________________
* Corresponding author. Tel +353 1 896 2534; fax: +353 1 677 3072 Email address: brian.caulfield@tcd.ie (B. Caulfield)
Department of Civil, Structural and Environmental Engineering, Trinity College Dublin, Dublin 2, Ireland
Abstract
Ride-sharing has often been cited as a successful method to reduce congestion and green house gas emissions. This paper examines the patterns of ride-sharing, in Dublin, and estimates the environmental benefits of ride-sharing both in terms of reductions in emissions and the total vehicle kilometres travelled. Data from the 2006 Census of Ireland is used in this paper to examine the travel patterns of those that ride-share. Ride-sharing in Dublin currently accounts for 4% of the total morning peak commute trips. The COPERT4 model is used in this paper to estimate the CO2 emissions saved
by ride-sharing.
Keywords: ride-share; sustainable transport
1. Introduction
Between 1996 and 2006 the population of Ireland has grown by 17% to just under 4.2 million people. Private car ownership has increased by 38% in the same period
(Department of Transport, 2009). This rapid growth has resulted in chronic congestion in urban areas and escalating green house gas emissions (GHG). CO2 emissions from
transport have grown by 88% in this 10 year period to 13.7Mt of CO2 emissions
per-annum. Energy use in the transport sector was over 99% dependent on oil products in 2005 (SEI, 2006). These trends are not unique to Ireland; such patterns have been replicated in many other countries.
In an attempt to reduce emissions and congestion, the Irish Government has launched a plan to promote sustainable transport policies. It is proposed that this plan will work in conjunction with the planned investment in capital projects. This
sustainable transport plan will encourage behavioural change, and promote soft measures. This paper examines one such soft measure, ride-sharing. Ride-sharing (or carpooling) is an arrangement whereby two or more individuals travel in one vehicle from a given origin to a specific destination. The ride-sharing trips that are examined in this paper focus on weekday morning trips to work. Currently in Dublin, individuals that to ride-share do not have access to high occupancy vehicle lanes. These lanes are restricted to public transport vehicles.
2. Ride-sharing
Many countries see reducing transport emissions as one of their key targets for meeting national Kyoto reduction targets. However, meeting these targets will require an
efficient travel is to ride-share. The promotion of ride-sharing in conjunction with other modes such as public transport is crucial to solving our oil dependence problems (Sovacool, 2007).
Ride-sharing has the potential to yield significant economic and environmental benefits. Reductions in journey time and vehicle kilometres travelled (VKT), shared fuel costs, and decreases in emission, can all be achieved from encouraging ride-sharing (Fellows and Pitfield, 2000). Jacobson and King (2009) examine the potential fuel savings in the United States if policy of ride-sharing were promoted. Authors found that if 1 in every 10 cars were to have more than one passenger, it could result in a saving of 5.4% in annual fuel consumption. In 2005, the International Energy Agency (IEA) examined the potential benefits of promoting ride-sharing, in Organisation for
Economic Cooperation and Development (OECD) countries. This study found that by adding one person to every commute trip, in each of the countries in the OECD, it would result in a saving of 7.7% on fuel consumption or 2,223 barrels of oil a day and reduce the total VKT by 12.5% (IEA, 2005). This report stresses it is essential that ride-sharing lanes and priority parking measures are provided, to encourage ride-ride-sharing. The provision of ride-share lanes is seen as essential for the promotion of this mode of transport. The benefits of reductions in VKT and improvements in air quality are cited as arguments for providing ride-share lanes in urban areas (Ungermah et al, 2007). A further policy tool which could be employed to promote ride-sharing is to use fiscal measures such as reducing fuel tax for those individuals that ride-share (Meyer, 1999, Rajan, 2006).
3. Data and methodology
3.1 Data
The Census data used in this paper was taken on the night of Sunday, 23rd April 2006. 1.5 million homes in Ireland received the Census forms two weeks before the night of the 23rd of April. The data analysed in this paper were taken from the place of work Census of anonymised records dataset (POWCAR) (CSO, 2007). The POWCAR dataset contains information on the regular work trips of 1,834,472 individuals in Ireland.
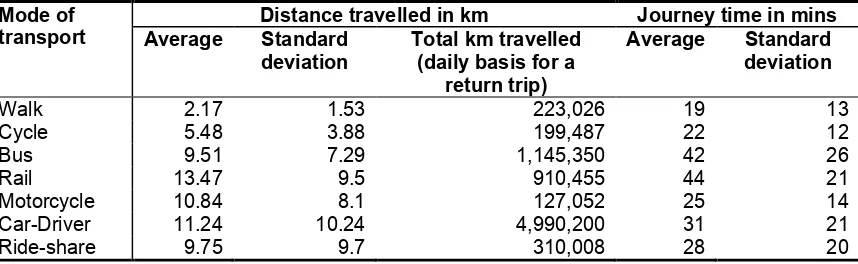
Table 1 presents the modal split of the morning peak trips to work in Dublin. When completing the Census form individuals are asked to select the mode of transport they use to travel to work, school, or college. The Census form states ‘tick one box only for the longest part, by distance, of your usual journey to work school or college’ (CSO, 2006). The results show that 4% of respondents ride-share. The average distances travelled, the total kilometres travelled, and the times taken by each mode of transport are detailed in Table 2. Ride-sharers were found to travel on average of 9.75km; those that drive alone were shown to travel on average 11.24km each day. As one would expect the average distance travelled for the slow modes was found to be considerably less than that of the mechanised modes. The results show that car and bus are
Table 1 Mode split
Mode of transport N %
Walk 70,080 13
Cycle 20,602 4
Bus 76,816 14
Rail 39,534 7
Motorcycle 6,607 1
Car-Driver 260,754 49
Ride-share 19,977 4
Lorry/van 19,239 4
Other means 1,028 0
Work from home 8,218 2
NA 9,364 2
Total 532,219 100
Table 2
Distance travelled and time taken
Mode of transport
Distance travelled in km Journey time in mins Average Standard
deviation
Total km travelled (daily basis for a
return trip)
Average Standard deviation
Walk 2.17 1.53 223,026 19 13
Cycle 5.48 3.88 199,487 22 12
Bus 9.51 7.29 1,145,350 42 26
Rail 13.47 9.5 910,455 44 21
Motorcycle 10.84 8.1 127,052 25 14
Car-Driver 11.24 10.24 4,990,200 31 21
Ride-share 9.75 9.7 310,008 28 20
3.2 Methodology
A logistic regression analysis is applied in this study to examine the relationships between those individuals that ride-shared and those that did not. The reference
category used in the logistic regression analysis was those respondents that ride-shared. The logistic regression analysis can be expressed as follows in equation [1]:
ln 1 i i i i p
a b X e
p ⎡ ⎤ = + + ⎢ ⎥ − ⎣ ⎦
∑
[1]where pi is the probability that the respondent ride-shared, a is the intercept, Xi and bi are explanatory variables and e represents the error term. The results of the logistic
regression analysis are presented in Table 3.
COPERT4 was used to calculate the CO2 emissions for each of the different scenarios
for 2006 were also inputted into the COPERT4 model.
4. Results
4.1 Who are the individuals that are most likely to ride-share?
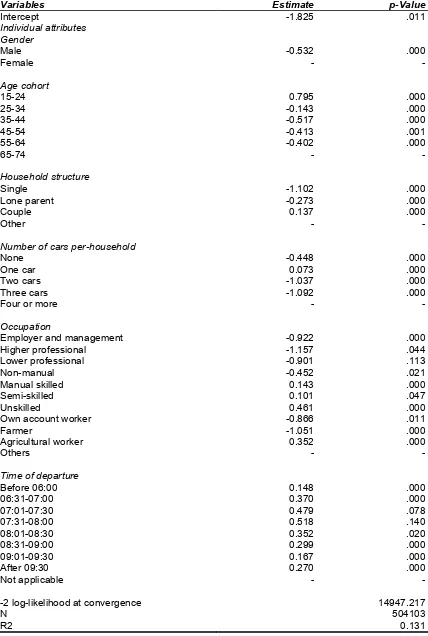
The results of the logistic regression analysis are outlined in Table 3. The p-values estimated, demonstrate that each of the variables are significant. The negative
coefficient estimated for the male variable, suggests that females are more likely to ride-share. Younger individuals were shown to be the most likely to ride-share, with those aged 35-44 the least likely.
Table 3
Logistic regression results
Variables Estimate p-Value
Intercept -1.825 .011
Individual attributes Gender
Male -0.532 .000
Female - -
Age cohort
15-24 0.795 .000
25-34 -0.143 .000
35-44 -0.517 .000
45-54 -0.413 .001
55-64 -0.402 .000
65-74 - -
Household structure
Single -1.102 .000
Lone parent -0.273 .000
Couple 0.137 .000
Other - -
Number of cars per-household
None -0.448 .000
One car 0.073 .000
Two cars -1.037 .000
Three cars -1.092 .000
Four or more - -
Occupation
Employer and management -0.922 .000
Higher professional -1.157 .044
Lower professional -0.901 .113
Non-manual -0.452 .021
Manual skilled 0.143 .000
Semi-skilled 0.101 .047
Unskilled 0.461 .000
Own account worker -0.866 .011
Farmer -1.051 .000
Agricultural worker 0.352 .000
Others - -
Time of departure
Before 06:00 0.148 .000
06:31-07:00 0.370 .000
07:01-07:30 0.479 .078
07:31-08:00 0.518 .140
08:01-08:30 0.352 .020
08:31-09:00 0.299 .000
09:01-09:30 0.167 .000
After 09:30 0.270 .000
Not applicable - -
-2 log-likelihood at convergence 14947.217
N 504103
R2 0.131
The environmental benefits examined in this paper relate to reductions in CO2
emissions. The COPERT4 model was used to estimate the reductions in CO2 emissions.
The savings in CO2 emissions and VKT presented in this section of the paper are
assumed to occur as the ride-sharers, forgo driving to work. The reductions in CO2
emissions are given a monetary value in each of the scenarios modelled in this section. This monetary value was estimated using equation [2].
[2]
where VR is the monetary value of the change in CO2 emissions and c, is the value
per-gram of CO2. A value of €0.00006 per-gram of CO2, this is the value prescribed by the
National Roads Authority of Ireland when placing a monetary value on CO2 emissions
(NRA, 2005).
The three scenarios modelled are presented in Table 4. As shown in Table 2, ride-sharers were found to travel a total of 310,008km, each day in Dublin. The first scenario assumes a return trip, five days per-week, 44 weeks a year. The second scenario assumes the same as the first, but individuals are assumed to ride-share four days a week. The final scenario again assumes the same as the first, but individuals are assumed to ride-share three days a week.
The results for the first scenario show that annually 12,674 tonnes of CO2
emissions are saved by individuals ride-sharing. As the first scenario is based upon the findings taken from the Census data, it is fair to say that this CO2 emission saving was
realised. The monetary value for this estimated saving on CO2 emissions was €706,428.
Scenarios 2 and 3 demonstrate that if respondents were to ride-share 4 or 3 times a week, there would be a sizable annual saving in CO2 emissions. Each of the scenarios
modelled in Table 4 show a considerable saving in the VKT on an annual basis.
Table 4
COPERT4 Results - Base scenarios
Travel modelled Total vehicle km
saved (millions)
CO2
(tonnes)
Monetary Value
Scenario 1 – ride-sharing 5 days a week 68.2 per annum 12,674 €706,428 Scenario 2 – ride-sharing 4 days a week 54.6 per annum 10,139 €608,343 Scenario 3 – ride-sharing 3 days a week 40.9 per annum 7,604 €456,257
5. Discussion and conclusions
The general consensus from the literature is that a combination of approaches will be required to reduce CO2 emissions and promote sustainable transport. A number of
policies need to be considered that both provide viable alternatives to driving and change individuals’ behavioural habits by encouraging the use of sustainable transport options. As part of this policy mix the results of this paper make the case for supporting polices that promote ride-sharing, as it is shown to provide considerable benefits.
The characteristics of the individuals that currently ride-share in Dublin are examined in this paper using a logistic regression analysis. The results show that females and those in couples were most likely to ride-share. Occupation was found to
2( )
R
significantly impact upon individual’s decision to ride-share. The findings demonstrate that those in skilled or non-skilled and those in manual industries were found to be more likely to ride-share that those individuals employed as higher or lower professionals or those in management. Age was also found to be significant, with younger individuals shown to be the most likely to ride-share.
The results presented in this study demonstrate the benefits of ride-sharing, and the potential of this mode of transport for reducing CO2 emissions. Under the different
scenarios examined, one can see that even if ride-sharing isn’t the mode of transport that is used everyday when travelling to work, if it is used three or four days a week it can result in considerable benefits. These scenarios were analysed as permanent ride-sharing arrangements are hard to maintain. The results of this study present a strong case for promoting ride-sharing and providing incentives such as ride-share lanes and financial incentives.
Acknowledgement
The author would like to thank the Central Statistics Office of Ireland for providing the POWCAR dataset.
References
Central Statistics Office. 2006. Census of Ireland Form. CSO, Dublin, Ireland.
Central Statistics Office. 2007. Census of population of Ireland 2006, Place of Work, Census of Anonymised Records (POWCAR) Users Guide. CSO, Dublin, Ireland.
Department of the Environment, Heritage and Local Government, 2004. Irish Bulletin of Vehicle and Driver Statistics 2003, Government Publications, Dublin.
Department of Transport. 2009. Smarter Travel – A sustainable transport future. Dublin, Ireland.
Fellows, N. T., Pitfield, D.E. 2000. An economic and operational evaluation of urban car-sharing. Transportation Research D 5, 1-10.
Gkatzoflias, D., Kouridis, C., Ntziachristos, L. 2007. COPERT 4: Computer programme to calculate emissions from road transport. European Environment Agency.
Hickman, R., Banister, D. 2007. Looking over the horizon: Transport and reduced CO2
emissions in the UL by 2030. Transport Policy 14, 377-387.
International Energy Agency. 2005. Saving oil in a hurry: measures for rapid demand restraint in transport. Draft Report, OECD, Paris, 2005
carrots and sticks to influence travel behaviour. Transportation Research A. 33, 575-599.
NRA. 2005. Guidelines for cost benefit analysis, National Roads Authority, Ireland
Rajan, S.C. 2006. Climate change dilemma: technology, social change or both? An examination of long-term transport policies in the United States. Energy Policy 34, 664-679.
Sustainable Energy Ireland. 2006. Energy in Transport: trends influencing factors 2006 Report, Sustainable Energy Ireland, Dublin Ireland.
Sovacool, B.K. 2007. Solving the oil independence problem: Is it possible? Energy Policy 35, 5505-5514.
Soylu, S. 2007. Estimation of Turkish road transport emissions. Energy Policy, 35, 4088-4094