Abstract—Industrial factories usually adopt application specific software to enhance the effectiveness of administration and management and reduce workload of executives and other personnel. However, there are some software applications which are completely developed but are not practically utilized resulting in an economic loss both in time and in financial investment. Therefore, this research proposes a risk assessment model for helping a manager to make decision at an early phase whether to go ahead or cancel the software development project based on empirical data. The method includes a prediction model which integrates risk factors including Hardware (HW), Software (SW), Organization (OG), and Human (HM). The risk assessment model is developed using Confirmatory Factor Analysis (CFA).
Index Terms—Risk Assessment Model, Risk Model, Prediction Model, Software Adoption
I. INTRODUCTION
ANY industrial factories adopt an application specific software to use which is designed for a particular or unique business needs. This type of software may be developed in-house by the organization’s information systems personnel, or it may be developed by a software vendor. At the present, the software plays an increasingly relevant role in industrial factories or manufacturing companies which brings specific software supports for businesses such as manufacturing planning, production scheduling, designing, production, quality control, and reporting systems.
Some software in companies have been used and some not. The reasons that software users do not adopt a software maybe because the computer and the hardware devices are not ready to use, the hardware devices do not comply with the software requirements, the functionalities of the software does not meet user’s needs, the software is not reliable, the installation of the software is complex, the management of IT in the organizations is poor, a certain skill for particular software is needed and some users are habitual with traditional system etc.
The software has not been utilized from users and the organization loses investment of money, time, and effort.
Manuscript received December 19, 2016
C. Jantarachit and P. Muenchaisri are with the Department of Computer Engineering, Faculty of Engineering, Chulalongkorn University, Bangkok, 10330, Thailand (e-mail: [email protected], [email protected])
Whether the software under consideration will be adopted by users in the future or not should be investigated and predicted before the software development begins. Therefore, this research proposes a method for risk assessment model to predict the software adoption. The risk assessment model is constructed from four aspects including hardware problem (HW), software problem (SW), organization problem (OG), and human problem (HM). The confirmatory factor analysis (CFA) is used for risk assessment model development. The following section describes the researches. Section II presents literature review. Section III presents design and construction of the risk assessment model. Section IV explains the evaluation of the risk assessment model, Section V presents the conclusion and the future work.
II. LITERATURE REVIEW
Many researchers publish methods and models to evaluate the software project risk for both technological and non-technological system. The models, however, do not have a measurement of software adoption, which plays an important role in determining the risk for the software project.
There are some related works as follows. Say-Wei and Muruganantham [1] propose Software Risk Assessment Model (SRAM) for assessing risk in software project. A questionnaire instrument is used for gathering information from the risk assessor. The comprehensive questionnaire is constructed from the following nine risk elements: complexity of software, staff involved in the project, targeted reliability, product requirements, method of estimation, method of monitoring, development process adopted, usability of software, and tools used for development. The SRAM model is defined as a measure of the nine risk element probabilities and the weights assigned to the elements. The risk level of the project is computed as following the equation in [1].
Antinyan et al. [2] present a method to define the technical risk in software development by collecting data from four large software development companies. They organize a workshop and identify main list of technical risk that the designers face problem during software development. The results of the researched method show that the technical risks could be viewed as a combination of uncertainty and magnitude of differences between actual and optimal designs and processes. It supports risk assessment and management to enable identification of some potential product improvement areas.
Lo et al. [3] present a prediction of success/failure of electronic product development using the multiple regression
Risk Assessment Model to Predict Software
Adoption
Chanyapatch Jantarachit and Pornsiri Muenchaisri
models. Risk assessor responses to a comprehensive questionnaire that contains six critical factors including product requirements and fit, technical expertise, marketing expertise, management, human resource and other resources. The resulting model is based on six key success/failure factors which is presented as following the regression equation in [3].
Confirmatory factor analysis (CFA) is a statistical tool of structural equation modeling (SEM) [4]. This CFA method deals with measurement models, that is, the relationships between observed measures (indicators) and latent variables (factors) [5]. It is a multivariate statistical technique which is the most commonly used in applied research. Some of the common uses of the CFA are as follows: psychometric evaluation of test instrument, construct validation, method effects, and measurement invariance evaluation [5].
III. DESIGN AND CONSTRUCTION OF THE RISK ASSESSMENT MODEL
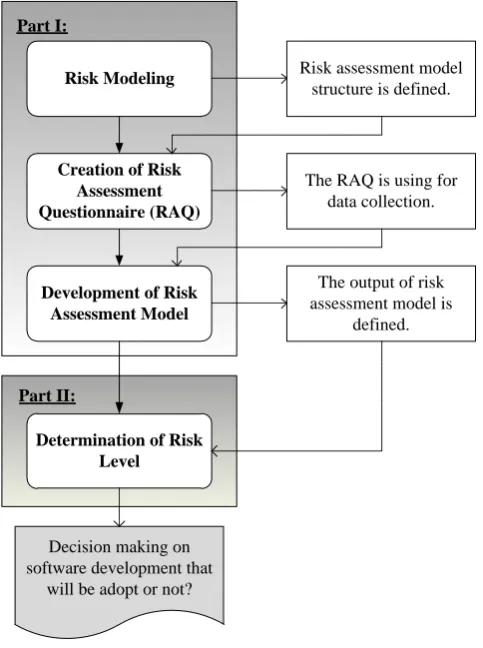
The proposed risk assessment model is the prediction on risk level of software development project indicates whether software will be adopted or not. The research method is divided into two parts. The first part is a development process of the risk assessment model which includes risk modeling, creation of risk assessment questionnaire (RAQ) and development of risk assessment model. The second part is a process to determine the overall risk level of a software development project. The overview of the proposed method is depicted in Figure 1.
Risk Modeling
Creation of Risk Assessment Questionnaire (RAQ)
Development of Risk Assessment Model Part I:
Part II:
Determination of Risk Level
Decision making on software development that
will be adopt or not?
Risk assessment model structure is defined.
The RAQ is using for data collection.
The output of risk assessment model is
[image:2.595.309.549.135.262.2]defined.
Figure 1An overview of method for risk assessment model
A. Risk Modeling
This research herein, a risk assessment model structure is defined by applying principle of holistic approach [6], which refers to four elements including hardware (HW), software (SW), organization (OG) and human (HM) as depicted in Figure 2.
Risk Assessment Model
Hardware aspect (HW)
Software aspect (SW)
Organization aspect (OG)
Human aspect (HM)
Figure 2Structure of Risk Assessment Model The definition of elements on this research is presented in Table I. For each element, there is a set of questions addressing the natural holistic problem relating software adoption by users. The risk assessment model is developed using confirmatory factor analysis (CFA) [5] as represented through equation (1). The details will be described in section C.
(
*
) (
*
) (
*
) (
*
)
p hw hw sw sw og og hm hm
R
w
r
w
r
w
r
w
r
(1) Where,
p
R is overall risk value of declining to use software. hw
w
is weight of hardware risk.
r
hw isrisk value of hardware aspect affecting software adoption.sw
w
is weight of software risk.
r
swis risk value of software aspect affecting software adoption.og
w
is weight of organization risk. ogr
is risk value of organization aspect affecting software adoption.hm
w
is weight of human risk. hmr
is risk value of human aspect affecting software adoption.Table I Definition of risk elements
Element Definition
Hardware A personal computer (PC) or laptop and including the components of computer system, such as monitor, mainboard, mouse, keyboard, etc.
Software A software development project. Organization An action of organizing on software
[image:2.595.50.292.422.746.2]B. Creation of Risk Assessment Questionnaire (RAQ)
In this section, “Risk Assessment Questionnaire (RAQ)” is created. The RAQ is composed of two main parts. The first part contains questions on demography of the respondents such as gender, age, educational level, faculty of university, department, working experience in company and hours of using computer per day. The second part contains questions in regard to risk factors which could contribute to software adoption.
The RAQ in the second part contains 38 questions which consists of 8 hardware, 18 software, 7 organization and 5 human questions. The attributes of questionnaire on this research are presented in Table II. Examples as follows:
Hardware risk aspect involves availability of hardware devices, speed of computer processors, and capacity of storage devices.
Software risk aspect involves the functionality of software, the capability of software to be transferred from one environment to another and, ability of software in data recovery.
Organization risk aspect involves management of software maintenance team, policies in software training, and procedure of software maintenance. Human risk aspect involves personal skills and
knowledge, attitude toward software adoption, and personal adaptation.
[image:3.595.318.549.205.477.2]Five points of Likert scale are provided for each risk in the questionnaire: critical, serious, moderate, minor, and negligible, which ‘1’ represent negligible and ‘5’ represent critical. Each risk is written which may affect on software adoption. Whereby risk is ranked closer to critical, it contributes that the users more likely decline to use software.
Table II Attributes of the RAQ construction. Risk aspect Attributes
1. Hardware Availability Speed Reliability Versatility Storage 2. Software Functionality
Reliability Usability Efficiency Maintainability Portability
3. Organization Organizational policy
4. Human Human behavior [7]
Personnel conduct form factor [7]
Human internal weakness [7]
C. Development of Risk Assessment Model
For the developing and evaluating the risk assessment
model, a set of questions relating the four risks is prepared. An electronic industrial factory is identified. The respondents are software users with some experience on using the application specific software in work environment.
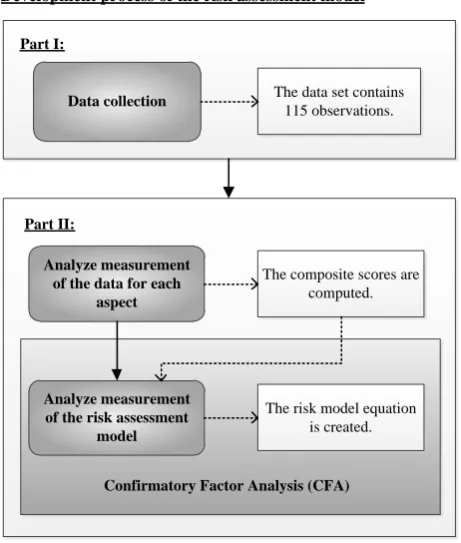
The risk assessment model is developed following steps as depicted in Figure 3. The first part is data collection from assessing the comprehensive questionnaires by software users. The second part is a data analysis process of the risk assessment model by using the confirmatory factor analysis (CFA). The results of the risk assessment model will be described in section IV.
The data set contains 115 observations.
Development process of the risk assessment model
Data collection Part I:
The composite scores are computed. Analyze measurement
of the data for each aspect
The risk model equation is created. Analyze measurement
of the risk assessment model Part II:
Confirmatory Factor Analysis (CFA)
Figure 3 Overview of development process for the risk assessment model
1) Data collection
Using the questionnaire, the data is collected either online or by hard copy. Two hundred respondents are invited by email and 115 (57.5%) respondents complete the questionnaire.
2) Data analysis
The data set from 115 observations is used to analyze the measurement model. Correlation analysis is performed on all data. The CFA procedure is conducted by using LISREL software as statistical tool.
The first step; each question from the RAQ in the second part is analyzed for factor loading [4]. Then the composite scores are computed by using a linear combination of the factor score (FS) [8]. This method is used to build the composite score equation of hardware(
r
hw), software(r
sw), organization(r
og)and human(r
hm). In this research, the computed composite scores are called the risk values in equation (1). [image:3.595.49.283.495.737.2]model by using a confirmatory factor analysis (CFA). This CFA method is used to test how well the data fits the risk assessment model. The fit statistics [9] i.e. Chi-square (χ²), Goodness of Fit Index (GFI), Adjusted Goodness of Fit Index (AGFI), Root Mean Square Residual (RMR), and Root Mean Square Error of Approximation (RMSEA) are used as the criteria to determine if the data fits the model, and they show how well the model fits.
Lastly, this CFA method provides a formula of the risk assessment model by using the factor score (FS) [8]. The coefficients of the model are represented by the weight values of hardware(
w
hw), software(w
sw), organization(w
og) and human(w
hm)aspects in equation (1).In order tobetter to understand the method for creating the risk assessment model equation, Algorithm 1 presents the implementation procedure in this research as follows.
D. Determination of Risk Level
Risk Level (RL) is used to determine the effects of risks on the project(Rp
)
. The Rpresult is derived from the equation (1). As the result, the risk value Rpwill be normalized as shown in equation (2):min
max min
100
p
p
R R
Normalize R
R R
(2) Where,
p
R is the risk value derived from equation (1).
min
R is minimum of the risk value.
max
R is maximum of the risk value.
[image:4.595.301.546.278.728.2]The Normalized Rp (NRV) provides the value of the assessed software project as a percentage. The NRV for a project with lower risk (no risk) of declining to use software will be closer to 0 percent, and the NRV for a project with higher risk of declining to use software will be closer to 100 percent.
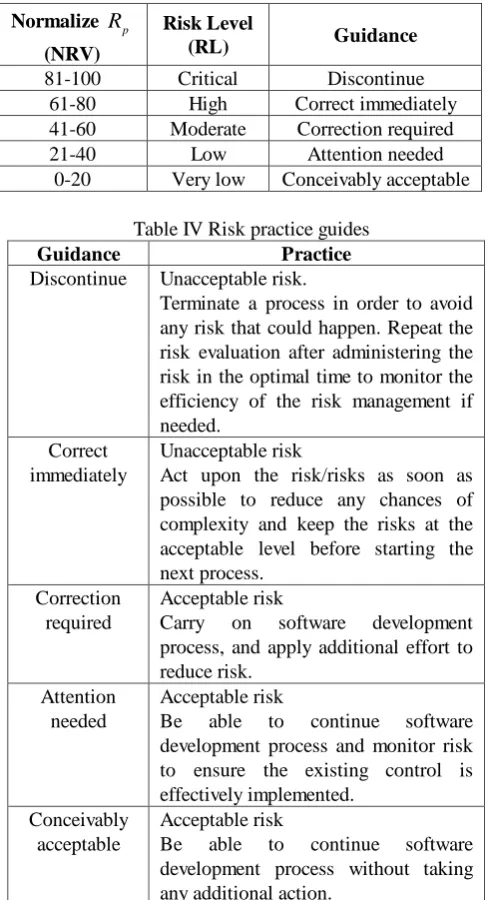
Table III Risk Level definition Normalize Rp
(NRV)
Risk Level
(RL) Guidance
81-100 Critical Discontinue
61-80 High Correct immediately
41-60 Moderate Correction required
21-40 Low Attention needed
0-20 Very low Conceivably acceptable Table IV Risk practice guides
Guidance Practice
Discontinue Unacceptable risk.
Terminate a process in order to avoid any risk that could happen. Repeat the risk evaluation after administering the risk in the optimal time to monitor the efficiency of the risk management if needed.
Correct immediately
Unacceptable risk
Act upon the risk/risks as soon as possible to reduce any chances of complexity and keep the risks at the acceptable level before starting the next process.
Correction required
Acceptable risk
Carry on software development process, and apply additional effort to reduce risk.
Attention needed
Acceptable risk
Be able to continue software development process and monitor risk to ensure the existing control is effectively implemented.
Conceivably acceptable
Acceptable risk
Be able to continue software development process without taking any additional action.
In decision-making process, the risk assessor considers risk level of a software project and indicates whether the software will be adopted or not by the NRV value. The NRV Algorithm 1
Input:
The data set from respondents The correlation coefficient of the data The factor score (FS) of each question The composite scores
r
hw,
r
sw,
r
og,
r
hm The factor score (FS) of each aspect Output:The risk assessment model equation Rp
1. Performing correlation analysis to obtain correlation coefficient of the data.
2. Using the correlation coefficient as input of factor analysis for each question, obtain the factor score (FS) of each question.
3. Use a linear combination of the factor scores (FS) to calculate the composite score equations, obtain the risk values of
r
hw,
r
sw,
r
ogandr
hm in equation (1)4. Using
r
hw,
r
sw,
r
ogandr
hm as the input of confirmatory factor analysis (CFA), obtains the output results of the fit statistics and the factor analysis parameters i.e. factor score (FS) of each aspect.5. Based on the obtained factor scores, use principle of a linear combination with the factor scores to get the weight values of
w
hw,
w
sw,
w
og,
w
hmin equation (1) 6. Obtain the risk assessment model equation as following( * ) ( * ) ( * ) ( * )
p hw hw sw sw og og hm hm
R w r w r w r w r
consists of five levels as shown in Table III. Guidance for each level of risk is provided in Table IV.
For example, “Software Project A” is assessed by the risk assessment model. The NRV value of 53 shows the risk level of the software project; as moderate level, this means “Software Project A” requires efforts to reduce risk. In moderate level, the margin of risk is an acceptable level for the software development process to carry on, however, the development team should put effort to reduce the risk. The risk assessor will make a decision based on this information.
IV. EVALUATION OF THE RISK ASSESSMENT MODEL A. Descriptive statistics
[image:5.595.303.554.140.548.2]The means, standard deviations, cronbach’s alpha and zero-order correlations among the four indicators of risk assessment model are shown in Table V. Organization aspect (OG) has the highest mean (3.645), while Hardware aspect (HW) has the lowest mean (0.950). Considering Cronbach’s alpha, all risk aspects model show high reliability coefficient. The Kaiser-Meyer-Olkin (KMO) value of 0.789 test for measuring sampling adequacy, and Bartlett's Test of Sphericity display significant results at p-value of 0.00. This verifies that there are inter-correlations among the variables. The KMO and Bartlett’s Test correlation of the risk assessment model are shown in Table VI.
Table V Means, SD, and zero-order correlation of 4 indicators of the risk assessment model.
Risk aspect 1 2 3 4
HW (0.857)
SW 0.710 (0.918)
OG 0.694 0.736 (0.863)
HM 0.405 0.591 0.539 (0.727)
Mean 0.950 3.211 3.645 2.186
SD 0.198 0.599 0.802 0.387
Cronbach's alphas are reported on the diagonal n = 115
p < 0.05
Table VI KMO and Bartlett’ Test correlation of the risk assessment model
Kaiser-Meyer-Olkin measurement of sampling adequacy.
KMO 0.789
Bartlett's Test of Sphericity
χ² 234.782 Degree of freedom (df) 6
p-value 0.000
B. Confirmatory Factor Analysis (CFA)
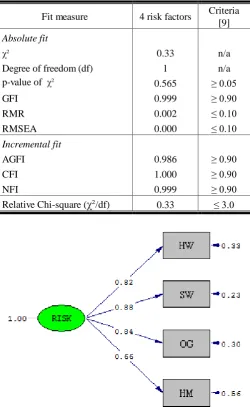
To assess the risk assessment model, the four risk aspects are analyzed. The result presented in Table VII indicates that the fit index values of the model meet the criteria [9] for both absolute and incremental fit. The risk assessment model with four aspects provide a good fit to the data [χ² = 0.33, df = 1,
p > 0.05; GFI = 0.999, CFI = 1.000, NFI = 0.999, RMR = 0.002, RMSEA = 0.000]. The fitted risk assessment model with four risk aspects is depicted in Figure 4 and the statistics from factor analysis of the risk assessment model are presented in Table VIII.
Table VII Goodness-of-Fit indicators of Risk model Fit measure 4 risk factors Criteria
[9]
Absolute fit
χ² 0.33 n/a
Degree of freedom (df) 1 n/a
p-value of χ² 0.565 ≥ 0.05
GFI 0.999 ≥ 0.90
RMR 0.002 ≤ 0.10
RMSEA 0.000 ≤ 0.10
Incremental fit
AGFI 0.986 ≥ 0.90
CFI 1.000 ≥ 0.90
NFI 0.999 ≥ 0.90
Relative Chi-square (
χ²
/df) 0.33 ≤ 3.0 [image:5.595.43.296.418.532.2]Figure 4 The fitted four risk aspects of the risk assessment model
Table VIII Confirmatory factor analysis results for risk assessment model
Aspect b(SE) 2
R
B t FSHW 0.162(0.016) 0.667 0.82 10.092 1.536 SW 0.526(0.046) 0.77 0.82 11.410 0.598 OG 0.673(0.063) 0.703 0.84 10.682 0.331 HM 0.256(0.034) 0.437 0.66 7.459 0.472
[image:5.595.40.551.616.698.2]good representatives in the risk assessment model.
After the CFA process has been done, a formula of the risk assessment model is created by using the factor score (FS) [8] in Table VIII. From equation (1), the coefficient of the risk assessment model represents hardware(
w
hw), software(w
sw), organization(w
og) and human(w
hm) aspects in equation (3) respectively.(1.536* ) (0.598* ) (0.331* ) (0.472* )
p hw sw og hm
R r r r r
(3)
The application of the risk assessment model is to predict if software will be adopted in a software project. The RAQ created is used to collect data from software users. In part of the data analysis, the equation (3) is used to compute the risk value (Rp
)
for the software project.V. CONCLUSION AND FUTURE WORK
This research proposes a risk assessment model for predicting software adoption in the organization and helping a manager to decide and assess the software project risk at an early phase. The risk assessment model is based on these four aspects including hardware, software, organization and human and is developed by using confirmatory factor analysis (CFA) as fundamental. The results from factor analysis have shown that the risk assessment model meets the good fit with four risk aspects. By using the factor score, the risk assessment model equation is created as shown in equation (3).
The future research includes the application of the risk assessment model equation (3) with the RAQ to assess software development project in the industrial factory. Moreover, the risk assessment model analysis may be included more number of risk aspects and cases.
ACKNOWLEDGMENT
The researcher would like to express the gratitude to the respondents for their support in the study. This research has been carried out in the electronic industrial factory in Thailand. Deepest special thanks to my advisor for helping and encouraging into this successful research.
REFERENCES
[1] F. Say-Wei and A. Muruganantham, "Software risk assessment model," in Management of Innovation and Technology, 2000. ICMIT 2000. Proceedings of the 2000 IEEE International Conference on, 2000, pp. 536-544 vol.2.
[2] V. Antinyan, M. Staron, W. Meding, A. Henriksson, J. Hansson, and A. Sandberg, "Defining Technical Risks in Software Development," in Software Measurement and the International Conference on Software Process and Product Measurement (IWSM-MENSURA), 2014 Joint Conference of the International Workshop on, 2014, pp. 66-71.
[3] F. C. W. Lo, F. Say-Wei, and J. A. Bauly, "Multiple regression models for electronic product success prediction," in
Management of Innovation and Technology, 2000. ICMIT 2000. Proceedings of the 2000 IEEE International Conference on, 2000, pp. 419-422 vol.1.
[4] R. B. Kline, "Principles and Practice of Structural Equation Modeling," T. D., Ed., ed. the United States of America: A Division of Guilford Publications, Inc., 2011.
[5] T. A. Brown, Confirmatory factor analysis for applied research, 1st ed. United States of America: A Division of Guilford Publications, Inc., 2006.
[6] Y. Y. Haimes, Risk modeling, assessment, and management. United States of America: A JOHN WILEY & SONS, INC., PUBLICATION, 2008.
[7] Z. Yanyan and X. Renzuo, "The Basic Research of Human Factor Analysis Based on Knowledge in Software Engineering," in
Computer Science and Software Engineering, 2008 International Conference on, 2008, pp. 1302-1305.
[8] M. Z. Christine DiStefano, Diana Mîndrilă. (2009, Understanding and Using Factor Score: Consideration for the Applied Researcher. Practical Assessment, Research & Evaluation 14,
11.
[9] W. C. B. Joseph F. Hair JR., Barry J. Babin, Rolph E. Anderson,