Abstract—In this paper we show how SAS Simulation Studio can be used to model various traffic light junctions. A traffic light is modeled using a Server Block together with a Flow Control Block. The Server Block is used to generate the cycle length of the traffic signal while the Flow Control Block regulates the red and green phases. Each traffic light junction is then modeled as a queuing system where vehicles arrive at the traffic light during a red or green phase. We assume a vehicle arrives at random but the time it takes to pass the junction will depend on its arrival status, for example, a vehicle arriving and stopping during a red phase with a queue in front will take a longer time to pass the junction than one arriving during a green phase with no queue ahead. This presents a more realistic picture of the simulation
Index Terms—SAS Simulation Studio, Signalized Intersection, Traffic Signal.
I. INTRODUCTION
RAFFIC congestion is the bane of modern city road users. With the ever growing number of vehicles on the road, traffic management has been playing catch up in their attempt to come up with satisfactory solutions to this problem. A number of researchers [1], [2], [3], [4] have also entered the fray to study and explore various techniques and approaches to address the problem. One such approach is simulation. Simulation has been widely used to investigate traffic flow and congestion problems [5], [6]. A number of researchers have used specialized simulation software packages like VISSIM [7], [8], CORSIM [9], SUMO [10], SIMTraffic [11], AIMSUN [12], MITSIM [13], FreeSim [14] and PARAMICS [15] to study and analyze traffic congestion and flow problems.
Many congestion situations occur at road intersections and the traffic light is installed at these junctions to promote orderly movement of vehicles and pedestrians as well as to prevent excessive delay to traffic. In theory this is fine but in practice it is a different matter. Road intersections have multiple sets of traffic signals and the timing of these signals need to be well coordinated to enable smooth and safe flow of traffic and reduce delay. Much work have been done on the optimal timing of traffic signal [16], [17], [18], [19], [20], [21]. Any slight deviation from the optimal timing often leads to massive congestions.
Soo K Leow is an Associate Professor in the Department of Information Systems at Sunway University (email : [email protected])
There are primarily three types of traffic signals : pre-timed, semi-actuated and actuated. Pre-timed signals have fixed-time red-green cycles to alternate the flow of traffic in opposing or different directions. In practice, the fixed cycle timing is determined based on historical data. Semi-actuated and actuated signals have sensors to detect approaching vehicles. Optimal timing of the signals is based on feedback of the traffic flow from the sensors. In this paper, we study traffic flow at road intersections and show how we can use a general purpose discrete-event simulation package, SAS Simulation Studio to model and analyze the traffic flow at different road intersections.
II. MODELING WITH SIMULATION STUDIO
Simulation Studio is a SAS software package that uses object-oriented discrete-event simulation to model and analyze systems. It has a user friendly graphical interface and uses base blocks to build the simulation model. Each block has well-defined and specialized functionalities and communicates with each other via ports. More detail information can be obtained from [22].
A. Modeling the traffic signal
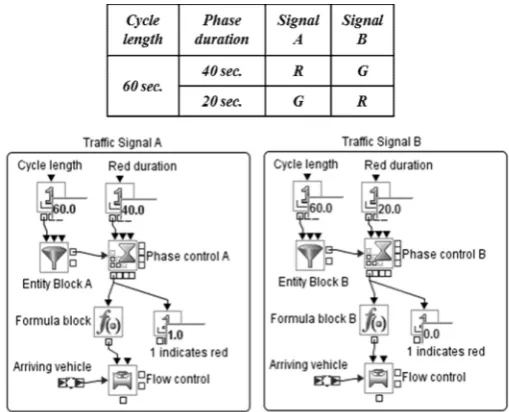
[image:1.595.329.532.538.742.2]We describe in detail here how the fixed-time traffic signal is modeled using a server block together with a flow control block and formula block. For simplicity, we model a traffic signal with only two phases, (red and green). Fig. 1 shows a traffic signal with a cycle time of 60 sec. consisting of a 40 sec. red phase and a 20 sec. green phase.
Fig. 1. Model of a Traffic Signal
Modeling Signalized Traffic Intersections Using
SAS Simulation Studio
Soo K Leow
Numeric block 1 and the Entity Block generate the cycle length of the traffic signal while the Flow Control Block and Formula Block regulate the red and green phases. The Entity Block generates a 60 sec. traffic signal cycle by generating an entity to enter the Server Block once every 60 sec. The Server Block serves the entity for a constant 40 sec. service time representing the duration of the red phase. The busy or idle state of the server represents the red or green phase of the signal. The Formula Block then passes the busy/idle state value of the server to the Flow Control Block which blocks (red phase) or allows (green phase) vehicles to pass through.
B. Modeling signalized road intersections
In this section, we describe how we model different types of signalized road intersections. There are two basic types of road intersections namely the 3-way intersection and the 4-way intersection. In order for traffic to flow in an orderly fashion at these intersections, well-coordinated traffic signal is a necessary condition but is not sufficient to optimize waiting time. How these traffic signals are coordinated will depend on the type of intersection, terrain, traffic volume and many other factors.
C. Basic 3-way intersection
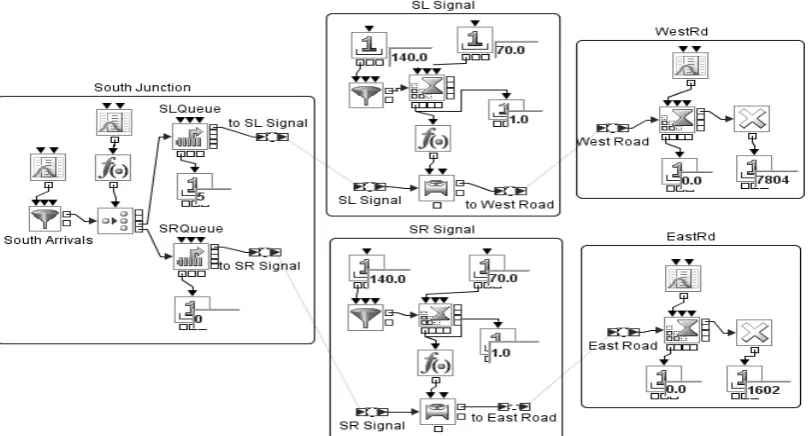
[image:2.595.305.560.464.670.2]Typically, the 3-way intersection has 4 sets of signal lights as shown in Fig. 2. Six traffic streams are identified in the figure, namely, SL coming from South Road turning left into West Road or SR, turning right into East Road; while ES is traffic stream from East Road proceeding straight through to West Road or EL, turning left into South Road and WS is traffic stream from West Road proceeding straight through to East Road without signal control and WR is traffic turning right into South Road.
Fig. 2. 3-way intersection
In simulating this intersection we assume the following:
S
= arrival rate of vehicles from South Road.W
= arrival rate of vehicles from West Road.E
= arrival rate of vehicles from East Road.SL
p
= probability of vehicle from South Road turning left.SL SR
p
p
1
= probability of vehicle from South Road turning right.WR
p
= probability of vehicle from West Road turning right.WR
WS
p
p
1
= probability of vehicle from West Road going straight.EL
p
= probability of vehicle from East Road turning left.EL ES
p
p
1
= probability of vehicle from East Road going straight.TC
= duration of cycle length of traffic signal (in sec.).SL
TR
= duration of red phase forSLstream.SL SL
TC
TR
TG
= duration of green phase for SLstream.
SR
TR
= duration of red phase forSRstream.SR SR
TC
TR
TG
= duration of green phase for SRstream.
WR
TR
= duration of red phase forWRstream.WR WR
TC
TR
TG
= duration of green phase for WRstream.
EL
TR
= duration of red phase forELstream.EL EL
TC
TR
TG
= duration of green phase for ELstream.
ES
TR
= duration of red phase forESstream.ES ES
TC
TR
TG
= duration of green phase for ESstream.
Coordination of the traffic signals in the timing plan in Simulation Studio is achieved by setting the appropriate start time in the Entity Block of the traffic signal. For example, Fig. 3 shows a timing plan for Traffic Signal A and B together with the simulation models of the traffic signals. In Signal A, the start time of Entity Block A is set at 0 while the start time of Entity Block B in Signal B is set at 40. With this setting, the timing of the red/green phases of the signals will be coordinated.
Fig. 3. Timing Plan for two Traffic Signals
[image:2.595.51.271.471.607.2]TABLE I
Signal Timing Plan of 3-Way Intersection
Phases SL SRTraffic StreamsWR EL ES
1 R R G R R
2 R R R G G
3 G G R R R
Fig. 4. Traffic streams in each phase of the signal timing plan of the 3-way intersection
D. Modeling 3-way intersection in Simulation Studio
In this section, we describe how the 3-way junction is modeled in Simulation Studio. Fig. 5 shows the simulation model of the South Road junction in Simulation Studio. Arrivals are generated in the compound block labeled South Junction and a Formula Block and a Switch Block are used
to divert vehicles to turn left to theSLsignal light or to turn right to theSRsignal light based on the probabilities
p
SLorSR
p
. The compound blocks labeled SL Signal and SRSignal simulate the SL and SR traffic lights respectively. Vehicles leaving the SL and SR Signal blocks exit to the WestRd and EastRd blocks respectively.
Fig. 6 shows the simulation model of the West Road junction. Arrivals are generated in the compound block labeled West Junction. The compound block labeled WR
Signal simulates the WR traffic light. Vehicles leaving the
WRSignal block proceeds to SouthRd.
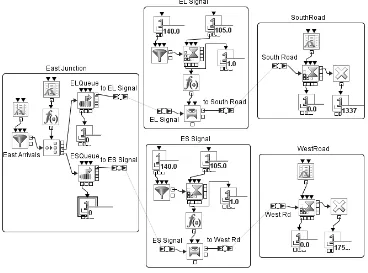
Fig. 7 shows the simulation model of the East Road Junction in Simulation Studio. Arrivals are generated in the compound block labeled East Junction and a Formula Block and a Switch Block are used to divert vehicles to turn left to the EL signal light or to proceed straight to the ES signal light based on the probabilities
p
EL orp
ES. The compound blocks labeledELSignal andESSignal simulate theELandES traffic lights respectively. Vehicles leaving the EL and
[image:3.595.97.503.365.583.2]ES Signal blocks exit to the SouthRoad and WestRoad blocks respectively.
[image:3.595.101.491.625.767.2]Fig. 5: Simulation Model of South Road junction of a 3-way intersection in Simulation Studio
Fig. 7. Simulation Model of East Road junction of a 3-way intersection in Simulation Studio
E. Basic 4-way intersection
[image:4.595.56.283.431.636.2]Typically the 4-way intersection has 6 sets of signal lights and 9 traffic streams as shown in Fig. 8
Fig. 8. 4-way intersection.
In the simulation model, traffic streams from all four roads turning left (SL, WL, NL, EL) are not be controlled by traffic signals. Similar to the 3-way junction, we let
S,
W,
Nand
E represent the vehicle arrival rates of the South,West, North and East roads respectively. A vehicle from any particular road will be diverted to the “left”, straight” or
“right” stream according to the probability distribution chosen.
[image:4.595.314.539.474.569.2]There are various different signal timing plans in a 4-way intersection but a typical plan at a large and busy intersection is at any particular time only one road is operating the green phase while the other three are in the red phases. TABLE II shows such a timing plan.
TABLE II
Signal Timing Plan of 4-Way Intersection
Phases SS SR WS WR NS NR ES ERTraffic Streams
1 G G R R R R R R
2 R R G G R R R R
3 R R R R G G R R
4 R R R R R R G G
F. Modeling 4-way intersection in Simulation Studio.
Fig. 9 shows the simulation model of the South Road junction of the 4-way intersection in Simulation Studio. Arrivals are generated in the compound block labeled South Junction and a Formula Block and a Switch Block are used to divert vehicles to theSL,SSandSRstreams based on the probabilities
p
SL,p
SSorp
SR. The compound blocks labeled SS Signal and SR Signal simulate the SS and SRFig. 9. Simulation Model of South Road junction of a 4-way intersection in Simulation Studio
III. CASE STUDY AND SIMULATION RESULTS A. Sunway University 3-way intersection case study
As a case study, we use the 3-way intersection of the entry road into Sunway University. The simulations were carried out for 2 peak periods (7.30 – 9.30 am and 5.00 – 7.00 pm) during a whole day. TABLE III shows the timing plan used from for the morning and evening peak periods.
TABLE III
Signal Timing Plan of 3-Way Intersection (Sunway)
Time(sec) SL SR WR ES EL
Morning Peak
70 R R G R R
35 R R R G G
35 G G R R R
Evening Peak
35 R R G R R
35 R R R G G
70 G G R R R
TABLE IV gives the mean interarrival times (in sec.) of vehicles arriving at the junctions used in the simulations for both peak periods. We have also assumed that the headway time distribution of vehicles turning left or right to have an exponential distribution with a mean of 2 sec. We have observed that 80% of vehicles from South Road turn left to West Road and this was implemented in the simulation.
TABLE IV.
Mean interarrival times used in simulation Mean interarrival time
(exponential) Morning
Peak EveningPeak
South Road 21 7.7
West Road 22 33
East Road (straight thru) 7.2 3.9 East Road (left turn) 21 20
B. Simulation results
Simulation of the Sunway University 3-way intersection for both peak periods with the current signal timing plan was carried out with 10 replications. TABLE V shows average queue length and average waiting time for each of the traffic streams. These results are consistent with observed data. We also simulated the intersection with a different signal timing plan which allows a longer green phase to the SL and EL
traffic streams. The timing plan is shown in TABLE VI. The simulation was also carried out for 10 replications and the results are shown in TABLE VII.
TABLE V.
Average Queue Length and Waiting Time for current timing plan.
Morning Evening Morning Evening Traffic stream Queue Length Waiting Time
EL 1.58 6.69 33.25 134.37
ES 3.41 19.05 24.56 74.28
SL 5.34 3.04 158.00 29.34
SR 4.41 1.20 324.28 57.24
WR 6.11 5.35 134.39 176.91
TABLE VI.
New Signal Timing Plan of 3-Way Intersection (Sunway)
Time(sec) SL SR WR ES EL
Morning Peak
35 G R G R R
35 R R R G G
35 G R R G G
35 G G R R G
Evening Peak
35 G R G R R
35 R R R G G
TABLE VII.
Average Queue Length and Waiting Time for new timing plan
Morning Evening Morning Evening Traffic stream Queue Length Waiting Time
EL 0.50 0.51 10.45 10.25
ES 3.40 18.03 24.54 70.67
SL 0.44 0.96 13.10 9.30
SR 4.74 1.18 346.36 55.36
WR 6.38 5.00 141.37 166.96
From the results in TABLE V and VII we can see that the average queue length and waiting times forELandSLtraffic streams are considerably reduced for the new timing plan while the values for the other 3 streams remain the same.
IV. CONCLUSION
In this paper, we have used SAS Simulation Studio, a non specialized simulation software to model and simulate signalized traffic intersections. A case study is also presented and the results obtained are consistent with observed data. This showed that the model can be used as basic units to build more complex models of signalized traffic systems. In the near future, a wider case study consisting of a complex road and signalized traffic system around the university will be investigated.
REFERENCES
[1] Jain, V., A. Sharma, and L. Subramanian. “Road traffic congestion in the developing world.” In Proceedings of the 2nd ACM Symposium on Computing for Development, 2012.
[2] Kiunsi, R. B. “A Review of Traffic Congestion in Dar es Salaam City from the Physical Planning Perspective.” Journal of Sustainable Development, 6 (2): 94-103. 2013.
[3] Lecue, F., A. Schumann and M. L. Sbodio. “Applying Semantic Web Technologies for Diagnosing Road Traffic Congestions” In Proceedings Part II of the 11th International Semantic Web Conference, Boston, MA, USA, November 11-15, 2012.
[4] Xu, Y., Y. Wu, J. Xu, D. Ni, G. Wu, L. Sun. “A Queue-length-based Detection Scheme for Urban Traffic Congestion by VANETs.” In Proceedings of IEEE Seventh International Conference on Networking, Architecture and Storage. 2012.
[5] Vedagiri, P. and S. Daydar. “Simulating Median Side Bus Lanes in Indian Traffic Conditions.” In Proceedings of the International simulation conference of India, IIT Bombay, 02-04 February 2012. [6] Wen, W. “A dynamic and automatic traffic light control expert
system for solving the road congestion problem.” Expert Systems with Applications 34 (2008) 2370–2381. 2008.
[7] Chang, H., Y. Wang, and P. A. Ioannou. “The Use of Microscopic Traffic Simulation Model for Traffic Control Systems.” In Proceedings of the 2007 International Symposium in Information Technology Convergence. 120-124.
[8] Lu, X., and Z. Liu. “Traffic simulation of Beijing West railway station North area.” Journal of Industrial Engineering and Management, 2013, 6(1), 336-345.
[9] Owen, E. L., Y. Zhang, and L. Rao. “Traffic Flow Simulation using CORSIM.” In Proceeding of the 2000 Winter Simulation Conference, Edited by J. A. Joines, R. R. Barton, K. Kang, and P. A. Fishwick.
[10] Krajzewicz, D., E. Brockfeld, J. Mika., J. Ringel, C. Rössel, W. Tuchscheerer, P. Wagner, and R. Woesler. “Simulation of modern Traffic Lights Control Systems using the open source Traffic Simulation SUMO. InProceedings of the 3rd Industrial Simulation
Conference, EUROSIS-ETI, Edited by J. Krüger, A. Lisounkin, and
G. Schreck, 299 – 302. 2005.
[11] Cheng, D., Z. Z. Tian, and H. Liu. “Implementing Actuated Signal-Controlled Intersection Capacity Analysis with Pedestrians.” Transportation Research Record. Journal of the Transportation Research Board. No.2071. 125 – 130. 2008.
[12] Barceló, J., and J. Casas. “ Dynamic Network Simulation with AIMSUN.”, In Proceedings of the International Symposium on Transport Simulation. Yokohama Japan. 2002.
[13] Ben-Akiva, M., Cortes, A. Davol, H. Koutsopoulos, and T. Toledo. “Micro-Simulation of Urban Networks”, In Selected Proceedings of the 9th World Conference on Transport Research. 2003.
[14] Miller, J., and E. Horowitz. “FreeSim – A Free Real-Time Freeway Traffic Simulator.” In Proceedings of IEEE 10th Intelligent Transportation Systems Conference, October 2007.
[15] Ettema, D., G. Tamminga, H. Timmermans, T. Arentze. “A micro-simulation model system of departure time using a perception updating model under travel time uncertainty.” Transportation Research Part A 39 (2005) 325–344.
[16] Miller, A. “A computer-controlled system for traffic networks.” In Proceedings of International Symposium on the Theory of Road Traffic Flow, London, UK, 1963.
[17] Wannige, C. T., and D. U. J. Sonnadara. “Adaptive Neuro-Fussy Traffic Signal Control for Multiple Junctions.” In Proceedings of IEEE International Conference on Industrial and Information Systems (ICIIS), 4 (2009) 262-267.
[18] Howell, W. C. “Simulation Optimization of Traffic Light Signal Timings via Perturbation Analysis.” PhD Thesis. Applied Mathematics and Scientific Computation Program, University of Maryland, College Park, U.S.A. 2006.
[19] Hewage, N. K., and J. W. Ruwanpura. “Optimization of Traffic Signal Light Timing using simulation.” In Proceedings of the 2004 Winter Simulation Conference, Edited by R. G. Ingalls, M. D. Rossetti, J. S. Smith, and B. A. Peters.
[20] Black, C. G., and H Yusuf. “On Modelling and Optimizing Traffic Flow at a Busy Road Junction.”Thammasat Int. J. Sc. Tech.Vol 5, No. 3 September-December. 2000.
[21] Udoh, N. S. and E. J. Ekpenyong. “Analysis of Traffic Flow at Signalized Junctions in Uyo Metropolis.” Studies in Mathematical
Sciences.Vol. 5, No. 2, 2012. 72-89.


![TABLE VII.[11] Cheng, D., Z. Z. Tian, and H. Liu. “Implementing Actuated Signal-Controlled Intersection Capacity Analysis with Pedestrians.”](https://thumb-us.123doks.com/thumbv2/123dok_us/472052.545415/6.595.44.291.62.197/implementing-actuated-signal-controlled-intersection-capacity-analysis-pedestrians.webp)