Accepted Manuscript
Ranking Universities Based on Performance Evaluation by a Hybrid MCDM Model
Hung-Yi Wu, Jui-Kuei Chen, I-Shuo Chen, Hsin-Hui Zhuo
PII: S0263-2241(12)00088-7
DOI: 10.1016/j.measurement.2012.02.009
Reference: MEASUR 1840
To appear in: Measurement
Received Date: 5 November 2011 Revised Date: 19 January 2012 Accepted Date: 11 February 2012
Please cite this article as: H-Y. Wu, J-K. Chen, I-S. Chen, H-H. Zhuo, Ranking Universities Based on Performance Evaluation by a Hybrid MCDM Model, Measurement (2012), doi: 10.1016/j.measurement.2012.02.009
Ranking Universities Based on Performance Evaluation by a
Hybrid MCDM Model
Hung-Yi Wu
Department of Business Administration National Chiayi University
No.580, Xinmin Rd., Chiayi City 60054, Taiwan +886-5-2732838
Jui-Kuei Chen
Graduate Institute of Futures Studies Tamkang University
4F, No. 20, Lane 22, WenZhou St., Taipei, 10648, Taiwan +886-912272961
I-Shuo Chen (Corresponding Author) School of Business
Trinity College Dublin College Green, Dublin 2, Ireland
+353-871183597 ch655244@yahoo.com.tw
Hsin-Hui Zhuo
Department of Business and Entrepreneurial Management Kainan University
Highlights
We weight the performance indices based on the official performance evaluation structure of TWAEA.> We apply a hybrid multiple-criteria decision-making (MCDM) model.> We also compare the official rankings of the 12 private universities with our results.> We endeavor to help universities optimize their performances with efficiency.>
Ranking Universities Based on Performance Evaluation by a
Hybrid MCDM Model
Hung-Yi Wu
Department of Business Administration, National Chiayi University
Jui-Kuei Chen
Graduate Institute of Futures Studies, Tamkang University
I-Shuo Chen* (Corresponding Author)
School of Business, Trinity College Dublin
College Green, Dublin 2, Ireland
+353-871183597; ch655244@yahoo.com.tw
Hsin-Hui Zhuo
Department of Business and Entrepreneurial Management, Kainan University
Abstract
The aims of this study are to weight the performance evaluation indices for higher
education based on the official performance evaluation structure developed by the Taiwan
Assessment and Evaluation Association (TWAEA) and to rank 12 private universities
listed by the Ministry of Education as a case study. We apply a hybrid multiple-criteria
decision-making (MCDM) model to accomplish these objectives. Specifically, we utilize
the analytic hierarchy process (AHP) to accomplish the first aim, but we adopt the
VlseKriterijumska Optimizacija I Kompromisno Resenje (VIKOR) method for the second
aim by utilizing the AHP outcome. We also compare the official rankings of the 12 private
universities with our ranking of the same universities. Our study endeavors to help
universities optimize their performances with efficiency. In addition, the results of this
study could provide a reference point for other universities and related educational
institutions in their efforts to conduct evaluations, improve their performances and form
educational policies.
VlseKriterijumska Optimizacija I Kompromisno Resenje (VIKOR); Multiple-Criteria
Ranking Universities Based on Performance Evaluation by a
Hybrid MCDM Model
1. Introduction
Educational institutions play a critical role in national and global development. They
support global development strategies by providing the highly qualified manpower and
research necessary for further growth (AI-Turki & Duffuaa, 2003). Among the different
levels of education, higher education is especially conducive to fostering high-tech talent,
which is the key factor in increasing national quality and the main path to improving a
nation’s competitiveness (Fairweather, 2000; Meek, 2000). Thus, higher education has a
great impact on the development of a nation’s competitive advantage (Dill, 1997; Dill &
Teixeira, 2000).
During the past ten years, private universities have played crucial roles in developing
the education system and increasing opportunities for employment. Specifically, in 2006,
approximately 66% of all college students were studying at private universities. Currently,
the number of universities is increasing. Previous estimates have suggested that 162
universities existed in Taiwan in 2006 (Ministry of Education, 2006), and this number is
still increasing today. Unfortunately, a certain imbalance exists between the quality of
universities and the number of universities in general. In particular, the overall qualities of
the teaching process, the faculty, and the universities’ development have not improved
significantly (Ministry of Education, 2006). Given the societal pressure for radical changes
in Taiwanese higher education, the improvement of the educational system has become a
critical issue for the government, the universities, and the researchers (Department of
Higher Education, 2004).
Because the importance of performance evaluation and improvement has received
increasing emphasis as of late, the official mechanism used to evaluate Taiwanese
universities plays a key role in guiding the development of and the government’s financial
world, we found that most nations contain comprehensive mechanisms for evaluating
universities, with the evaluation results serving as a reference point for decisions to choose
a university, hire employees, and provide financial support for students, entrepreneurs, and
citizens (Department of Higher Education, 2004). These mechanisms can also help
universities develop better research and teaching processes (Barnabè & Riccaboni, 2007).
However, there is neither a convincing evaluation mechanism nor ranking standard for
Taiwanese higher education, as all of the evaluation indices appear to be equal. As a result,
no university can provide the highest quality of faculty, curriculum, and teaching because
of limited resources.
Because Taiwan has joined the WTO and experienced recent drops in the birth rate,
Taiwanese universities are losing their competitive advantages relative to universities in
the Occident and Asia (Chen, 2005). Therefore, it is necessary to construct a useful
performance evaluation mechanism that can provide precise information for both
universities and related educational institutions. Doing so can effectively improve the
performance, decision making, and adaptability of Taiwanese universities. Thus, creating a
performance evaluation mechanism can fulfill the aim of this study. In addition, private
universities are encountering their largest revenue challenges because of reduced student
enrollment and retention as well as the aforementioned domestic and international sources
of pressure. With the increasing competition, students are looking for a quality and
economic educational environment; therefore, private universities must improve their
performances (Liu & Liu, 2010). In this regard, we compare our private university
rankings, which were based on the proposed performance evaluation mechanism, with the
official rankings of the Taiwanese Ministry of Education. Such a comparison may provide
private universities with necessary and effective references because these universities can
consider not only the differences in the two rankings but also the importance of the
evaluation indices when searching for ways to improve their performances.
To accomplish our goals, we utilized a hybrid multiple-criteria decision-making
VlseKriterijumska Optimizacija I Kompromisno Resenje (VIKOR) method. We adopted
this model because it considers numerous evaluation indices and alternatives. Specifically,
the AHP is used to explore the relative weights of the evaluation indices, and the VIKOR
method is utilized to rank the performance of each private university with respect to the
relative weight of each evaluation index. Both the AHP (Barbarosoglu & Yazgac, 1997;
Goh, 1997; Dong et al., 2010) and the VIKOR method (Chang & Hsu, 2009; Kuo & Liang,
2011; San Cristóbal, 2011) have been utilized in prior research concerned with weighting
and selecting issues, and the reliabilities of both methods have also been verified.
The rest of this paper is organized as follows. In Section 2, we discuss the
performance evaluation mechanisms in higher education. In Section 3, we propose a hybrid
MCDM model. In Section 4, we conduct an empirical study. Finally, we provide our
concluding remarks in the final section.
2. Performance Evaluation in Higher Education
Because the world’s universities are ushering in a new age of anxiety and higher
education in not of its last stability (Clark, 1998), continiously improving university’s
performance in accordance with precise conceptual frameworks is thus critical (Amiz,
2010). Specifically, performance evaluations must be based on a set of objectives that are
linked to the mission and the vision of the future. In addition, these evaluations must
define the customers, the unique requirements, and the level of satisfaction that the
organization needs to achieve. This mechanism should not only equally evaluate both
internal quality improvement and external benchmarks but should also evaluate factors
that can be improved (AI-Turki & Duffuaa, 2003). Furthermore, prior studies have
confirmed that key performance indices constitute the most comprehensive objectives in
all organizations and that these indices can assist a manager with attain his or her goals.
Given their importance, key performance indices are significant factors in promoting
quality improvement and goal fulfillment (Amiz, 2010).
evaluation mechanism in accordance with key performance indices exists, then any
improvement in the quality and performance of a university will be short-lived and
limited in scope (Amiz, 2010). Thus, the key performance indices are one of the principal
steps in evaluating the performances of universities. Numerous studies have also
suggested that key performance indices are critical to performance improvement (Birch,
1977; Shavelson et al., 1987; Windham, 1988; Johnes & Taylor, 1990; Cave et al., 1991;
Borden, 1994; Dolence & Norris, 1994; Boatright, 1995; Avkiran, 2001; Hsieh, 2004;
Strand, 2004; Sydman, 2003) and improved decision making in universities (Amiz,
2010).
Recently, a number of university categories have been developed to help define the
characteristics and to aid the future development of universities. Unfortunately,
categorization without clear and convincing standards results in numerous arguments and
conflicts, especially with respect to financial support, in the educational field. Without a
set of solid and comprehensive performance evaluation metrics, the governments and
education-related institutes that provide financial support to universities will find it
difficult to make fair decisions. As a result, universities will have less opportunity to
comprehensively improve their performances and thereby gain financial support from
external sources. Thus, a useful performance evaluation mechanism that can adequately
provide precise information to universities and education-related institutes is needed.
Hence, to accomplish our aim, we must first explore a set of key performance
indices. Currently, two major professional institutes evaluate the performances of
universities in Taiwan. One institute is the Taiwan Assessment and Evaluation
Association (TWAEA) and the other is the Higher Education Evaluation & Accreditation
Council of Taiwan (HEEACT). Because the TWAEA is a service unit that has been
officially authorized by the Ministry of Education to evaluate the performances of
Taiwanese universities, the performance evaluation indices proposed by the TWAEA are
3. A Hybrid MCDM Model
3.1. Analytic Hierarchy Process (AHP)
Proposed by Thomas L. Saaty in 1971, the analytic hierarchy process (AHP) is a
multiple-criteria decision-making method that is normally applied to overcome problems
in uncertain conditions or to consider several evaluation criteria during the
decision-making process. The MCDM model aims to provide a decision maker with a
precise reference for decision making and to reduce the risk of making the wrong
decision. By decomposing the decision problem into a hierarchy of more comprehensible
sub-problems, each problem can be evaluated independently, which reduces the potential
for error. The elements of the hierarchy can relate to any aspect of the decision problem,
such as tangible or intangible, carefully measured or roughly estimated, well understood
or poorly understood; that is, the elements can relate to anything that applies to the
decision at hand. This hierarchy has been utilized in several fields (Saaty, 1980) that
require one to choose among multiple alternatives and explore the weights of several
evaluation indices, such as business (Angelou & Economides, 2009), industry (Chen &
Wang, 2010), and healthcare (Liberatore & Nydick, 2008).
In the past, scholars have found that the AHP is effectively utilized in 13 major
conditions: setting priorities, generating a set of alternatives, choosing a best policy
among multiple alternatives, determining requirements, allocating resources, predicting
outcomes, measuring performances, designing systems, ensuring system stability,
optimizing processes, planning, resolving conflict, and assessing risk (Saaty, 1980). In
addition, the AHP has been found to be useful in more recent conditions, including
reducing the influence of global climate change (Berrittella et al., 2007), quantifying the
quality of software systems (McCaffrey, 2005), choosing university faculty (Grandzol,
2005), deciding the location of offshore manufacturing plants (Walailak & McCarthy,
2002), evaluating the risk in conducting cross-country petroleum pipelines (Dey, 2003),
and managing U.S. watersheds (de Steiguer et al., 2003).
matrix. The ratio scale can typically be categorized into 5 subscales based on different
levels of importance: Equal importance, Somewhat more important, More important, Much
more important, and Absolutely more important. Furthermore, 4 subscales exist within
each level of importance between and above the 5 major subscales. Therefore, a total of
nine subscales exist. The ratio values from 1 to 9 are given to each subscale, as Table 1
shows.
Insert Table 1 about here
The calculation steps of the AHP are presented as follows (Saaty, 1990; Wu et al.,
2009):
Step 1. Establish the pair-wise comparison matrix A by using the ratio scale in Table 1.
Step 2. Let C1, C2, , and Cn denote the set of elements, although aij represents a
quantified judgment on a pair of elements Ci, Cj. It yields an n-by-n matrix A as follows:
1 2
C C Cn
A
aij 1
2
n
C
C
C
12 1
2 12
1 2
1 1
1
1 1
1
n
n
n n
a a
a a
a a
(1)
where aij =1 and aij = 1
ij
a , i, j =1,2…,n.
In matrix A, the problem lies in assigning to the n elements C1, C2…Cna set of
numerical weights W1, W2, , Wn that reflect the recorded judgments. If A is a
consistency matrix, then the relations between weights Wi and judgments aij are given by
j ij i
W a
W (for i, j = 1, 2, 3… n). Saaty (Saaty, 1990) suggested that the largest eigenvalue
1
n j
m a x i j
i j
W a
W
(2)
If A is a consistency matrix, then eigenvector X can be calculated by
(Am a xI X) 0 (3)
Saaty proposed utilizing the consistency index (C.I.) and random index (R.I.) verify
the consistency of the comparison matrix (consistency ratio, C.R.). C.I. and C.R. are
defined as follows (Saaty, 1990):
. . 1
max n
C I n
(4)
. .
. . . .
I R
I C R
C (5)
where the R.I. represents the average consistency index (i.e., the random index). Saaty
(1977) computed the R.I. as the average consistency of square matrices coming from
various orders n, which he filled with random entries. The average consistency values of
these matrices are given by Saaty and Vargas (1991), as shown in Table 2. If the C.R<0.1,
then the estimate is accepted; otherwise, a new comparison matrix is solicited until C.R
<0.1.
Insert Table 2 about here
3.2 VlseKriterijumska Optimizacija I Kompromisno Resenje (VIKOR)
The VIKOR method was developed by Opricovic and Tzeng (2004). This method is
based on the compromise programming utilized in multi-criteria decision making (MCDM).
We assume that each alternative is evaluated according to a separate criterion function, and
we could utilize the compromise ranking method by comparing the measure of closeness to
the ideal alternative (Tzeng et al., 2005). The multicriteria measure for the compromise
in a compromise programming method (Zeleny, 1982). The numerous alternatives are
represented as . For each alternative , the rating of the th aspect is denoted
as (i.e., is the value of th criterion function for the alternative ), and n is the
number of criteria (Tzeng et al., 2005). The development of the VIKOR method started
with the form of , which is shown as follows (Opricovic & Tzeng, 2004):
,
1/
, 1
| |
,
| |
p p n
i ij
P j i
i i i
f f
L w
f f
j1,2,...,m 1 p (6)In the VIKOR method, (represent as followed) and (represent as
followed) are used to formulate the ranking measure. gains a solution with a
maximum group utility, and gains a solution with a mix individual regret of the
“opponent”. The compromise solution is a solution that most closely resembles the
ideal , and the compromise denotes an agreement established by mutual concessions;
the compromise solution is shown in Figure 1 by and
(Opricovic & Tzeng, 2004).
Insert Figure 1 about here
The VIKOR calculation steps are five-fold and are shown as follows (Opricovic &
Tzeng, 2004; Tzeng et al., 2005; Opricovic & Tzeng, 2007):
Step 1. Decide the best and the worst values of all of the criterion functions
. If the th function represents a benefit, then the following equations result:
,
Step 2. Calculate the values and where by utilizing the equations
(7)
and (8)
importance of each criterion.
Step 3. Calculate the values , by the equations
, (9)
In equation 9, is introduced as the weight of the strategy with the maximum group
utility. Here, = 0.5.
Step 4. Calculate the alternatives ranking, which are sorted by the values S, R and Q in
decreasing order. The results are the three ranking lists.
Step 5. Calculate a compromise solution in which the alternative (d) is ranked the best by
the measure Q (min) if it satisfies the following two conditions:
1. , which is called an acceptable advantage.
In this equation, is the alternative with the second position in the ranking list according
to . J is the number of alternatives.
2. The decision-making process demonstrates acceptable stability. Alternative d must also
be ranked the best by S and/or R. This solution is stable in a decision-making process,
which could consist of “voting by majority rule” (when > 0.5 is needed), “by
consensus” 0.5, or “with veto” ( < 0.5). Here, is the weight of the
decision-making strategy with the max group utility.
If conditions are not fully satisfied, then a set of compromise solutions is proposed, as
shown by the following two alternatives:
1. Alternatives and are used only if condition 2 is not satisfied.
2. Alternatives ; are used if condition 1 is not satisfied. is determined
by the equation for Max .
The best alternative, ranked by Q, is the one with the minimum value of Q; the main
ranking result is the compromise ranking list of alternatives and the compromise solution
Ranking obtained by the VIKOR method needs to utilize different values of the
criteria weights and analyze the impact of the criteria weights on the proposed compromise
solution. We determine the weight stability intervals by using the methodology cited in
Opricovic (1998). The compromise solution gained with the initial weights ( , i = )
will be replaced if the value of a weight is missing from the stability interval. The analysis
of the weight stability intervals for a single criterion is utilized for all criterion functions
with the initial values of the weights. By doing so, the stability of the preferences in a
gained compromise solution may be analyzed using the VIKOR program (Opricovic &
Tzeng, 2004).
VIKOR is a tool that benefits MCDM in situations where the decision maker is
unstable at the beginning of the system’s design. In addition, decision makers accept the
compromise solution because it provides a maximum group utility, which is represented by
Min Q, and a minimum individual regret, which is represented by Min R (Tzeng et al.,
2002).
4. An Empirical Study
4.1 Research structure and sampling
The goals of this study are to evaluate the initial weights of a university's official
evaluation indices, to rank 12 private universities based on their weighted performance
evaluation, and to compare the result with the formal ranking established by the Ministry
of Education. Before exploring the goals, we first construct the research structure. The
Taiwan Assessment and Evaluation Association (TWAEA) that produces the evaluation
indices for each university originally had a quantitative and a qualitative part. For the
sake of consistency, we focus only on the quantitative part. Based on the quantitative part
(TWAEA, 2004), the research structure of this study is further developed (see Figure 2).
The official definitions for the evaluation indices are provided in Table 3 for the
Administration category (A) and Table 4 for the Professional category (P) (TWAEA,
Insert Figure 2 about here
Insert Table 3 about here
Insert Table 4 about here
We sent a questionnaire to a group comprising 54 senior experts on October, 2006
and received the feedback by December, 2006. All of the senior experts served on an
evaluation committee of higher education that had been officially listed by TWAEA. Of
the 54 questionnaires, 9 were used in this study for a total response rate of 16.67%. The
demographic information is summarized in Table 5. All of the respondents were male.
Half (77.78%) of the respondents were over 51 years old, with the second most between
41-50 years old (22.22%). Approximately 88.89% of the respondents worked over 21
years and approximately 11.11% served between 11-20 years. All (100%) of the
respondents had reached the doctorate level. All (100%) of the respondents worked as
academics. Their weightings utilized the ratio scale given in Table 1 with respect to the
importance of the evaluation categories, dimensions, criteria, and indices.
Insert Table 5 about here
4.2 Weighting performance evaluation indices by using the AHP
Based on the questionnaires, in this section, we apply the AHP to compute the weight
of each performance evaluation category, dimension, criterion, and index. The overall
results and the ranking of the evaluation indices are summarized in Table 6. The resulting
consistency of the comparison matrix (consistency ratio, C.R.) reveals the reliability of this
study.
dimensions include 6 in Administration (A): Teaching Resources (AT),
Internationalization (AI), Extension Education Service (AE), Discipline and Guidance
(AD), General Education (AG), and Administrative Support (AA). Three dimensions
belong to Professional (P): Faculty (PF), Teaching (PT), and Research (PR). The top
three relative weights of the dimensions are Faculty (PF) (0.2317), Teaching (PT)
(0.1949), and Research (PR) (0.1548). Because the local weight of Professional (P) is
0.5815 and the local weight of Administration (A) is 0.4185, the weight of Professional
(P) is higher, and the relative weights of the top three evaluation dimensions among the
nine evaluation dimensions all included Professional (P).
The pros and cons of the universities’ operational performances are highly related to
their Faculty (PF). Relevant factors include the teacher’s qualification structure,
teacher-student ratio, the instructor’s expertise and adaptability at teaching subjects, the
full-time teacher’s academic experiences, and the instructor’s ability to multitask between
teaching and researching. Teaching (PT) is also likely to affect operational performances
through the following factors: the classification and development conditions in each
department, the teaching evaluation results and specific application conditions, and the
results and performances generated by upgrading the teaching quality. With respect to
Research (PR), the results applied to the social and industrial sectors. Research resulted
in a degree of innovation and contributions toward academic research and the
examination mechanism used in various exhibitions, creations, competitions and other
organizing conditions. These three dimensions played an important role in the operational
performances of the universities. Therefore, our senior experts emphasized these
dimensions.
In addition, a total of 27 evaluation criteria on the fourth level are related to the
university evaluation indices in this study. Among them, the top five evaluation criteria
are as follows: Teacher-student ratio (PF2) (0.0988), Ratio of foreign faculty classes (PF3)
(0.0710), Credits of general education course (AG1) (0.0680), Full-time faculty (PF1)
Among these five evaluation criteria, Ratio of foreign faculty classes (PF3),
Teacher-student ratio (PF2), and Full-time faculty (PF1) are all included in Faculty (PF).
The Ratio of foreign faculty classes (PF3) focuses on the Ratio of full-time foreign
faculty classes. The Teacher-student ratio (PF2) includes the Weighted ratio of the
faculty to students (PF2.1) and the Ratio of faculty to students (PF2.2). The Full-time and
part-time faculty (PF1) include the Ratio of full-time assistant professors to all full-time
faculty (PF1.1), the Ratio of full-time professors to all full-time faculty (PF1.2), the Ratio
of full-time faculty with doctoral degrees to all full-time faculty (PF1.3), and the Ratio of
full-time to part-time faculty (PF1.4). The fourth evaluation criteria include the following
factors: the teacher’s qualification structure, the teacher-student ratio, the implementation
status of the teacher’s qualification improvement plans and the future growth plan. In
addition, the fourth evaluation criteria encompass the number of teachers and students,
the academic background of the teachers, age, the distribution of the years spent on
teaching, and the ratio of foreign teachers in the school. Thus, the senior experts propose
that Faculty (PF) plays an extremely important role in the operational performances of
the universities. Because only the Credits of general education course (AG1) of General
Education (AG) are found in the third level of the evaluation dimension, its local weight
is 1. The relative weight of AG1 tends to be high, but it ranks third among the evaluation
criteria. This ranking indicates that the credit proportion of the courses in the schools will
affect the learning quality and the overall operational performances of the universities.
With a fifth-place ranking, the Status of the students (PT2) includes the Registration rate
of the new students (PT2.1), the Graduation rate of the students (PT2.2), and the Dropout
rate of the students (PT2.3). The senior experts consider these factors important to the
operational performances of the universities.
In addition, a total of 64 evaluation indices exist at the fifth level of this study. The
top ten relative weights in order are as follows: Ratio of full-time foreign faculty to all
faculty (PF3.1) (0.0710), Ratio of faculty to students (PF2.2) (0.0499), Weighted ratio of
full-time and part-time faculty to total students (PT4.1) (0.0317), Size of school area
(AT3.1) (0.0288), Percentage of general education credits (broad definition) (AG1.1)
(0.0273), Ratio of students to administrative manpower (AA1.2) (0.0271), Average
number of research rooms for full-time assistant professors (AA2.1) (0.0258),
Registration rate of new students (PT2.1) (0.0257), and Number of activities in
employment consulting (AD3.1) (0.0242). The C.I. value of the evaluation indices is 0.03.
As the C.R. value is smaller than 0.1, these weight indices are consistent.
Upon joining the World Trade Organization (WTO), Taiwan had to upgrade the
quality of its university education system because of the intense competition from various
countries. Because the Ratio of full-time foreign faculty and all faculty (PF3.1) is the
most important evaluation index among the indices assessed by the senior experts, all
universities should actively increase the number of foreign teachers in their faculties to
promote domestic and overseas knowledge exchange among students and to enhance the
university’s international education standards. As the Ratio of faculty to students (PF2.2)
and the Weighted ratio of faculty to students (PF2.1) both have a strong relationship with
the quality of education, the senior experts listed these two ratios as important evaluation
indices. In addition, the Size of the school area (AT3.1) is also regarded as an important
evaluation index because the application space (e.g., the total space of classrooms,
research rooms, and laboratories) and the distribution conditions will indirectly affect the
quality of education and the quality of instruction.
The Ratio of students to administrative manpower (AA1.2) exerts a significant
impact on the updating speed of the department’s website information, the ability to
handle inquiries of department-related information, the attitudes and quality of the
administrative staff, and the communication among the teachers, students, and the
university’s operations. The Number of activities in employment consulting (AD3.1) is
particularly important for the students and the university. These activities include
employment consulting lectures, campus job fairs and tools to process the conditions of
understanding of the job market and help them find jobs more smoothly.
Among all of the evaluation indices, the first-ranked Ratio of full-time foreign
faculty and all faculty (PF3.1), the third-ranked Size of school area (AT3.1), and the
tenth-ranked Number of activities in employment consulting (AD3.1) have a local weight
of 1. As a result, these indices tend to have high overall weights. The Ratio of foreign
faculty classes (PF3) in the fourth level ranked second among the relative weights, and
the Ratio of full-time foreign faculty and all faculties (PF3.1) is included in the foreign
class proportion. Therefore, we argue that an increase in the Ratio of foreign faculty
classes can improve the exchange of domestic and overseas knowledge among the
students and upgrade the education quality of the universities. Thus, the senior experts
consider these evaluation indices to be important. However, the Employment Consulting
(AD3) ranks first among the local weights at the fourth level, and the Number of
activities in employment consulting (AD3.1) ranks tenth among the evaluation indices.
These ratios pertain to the university’s ability to organize employment consulting lectures
and campus job fairs. The higher the frequency of these activities, the greater is the
impact on the students. Hence, the senior experts consider these ratios to be important
evaluation indices.
Insert Table 6 about here
4.3 Ranking the private universities by utilizing the VIKOR method
After identifying the relative weights of the performance evaluation indices, we rank
the private universities that are officially listed by the Ministry of Education in this
section. To maintain consistency with the official data, we only focus on the private
universities that are oriented towards literature, law, and business. We initially selected 13
private universities (i.e., THU, FJU, SCU, TKU, PCCU, PU, HFU, SHU, MCU, USC,
NHU, AU, and CJCU). Because our research focuses on the scope of social science,
private universities (e.g., HFU), as it existed outside of our scope. Therefore, we use a
total of 12 private universities in this study.
The original performance values of these 12 private universities were based on the
Ministry of Education’s evaluations of Taiwan’s public and private universities in the
year 2005 (as provided in Tables 1A-9A in Appendix A). We first summarize all of the
data and then standardized the different units of each evaluation index. In particular,
among the 64 evaluation indices, 8 indices (i.e., Percentage of student loan applications
(AD2.1), Ratio of full-time faculty and administrative manpower (AA1.1), Ratio of
student and administrative manpower (AA1.2), Ratio of full-time and part-time faculty
(PF1.4), Weighted ratio of faculty and students (PF2.1), Ratio of faculty and students
(PF2.2), Ratio of weekly hours of regular teaching of both full-time and part-time faculty
and total students (PT4.1), and Average number of weekly teaching hours for each
full-time faculty member (PT4.2)) show that smaller is better, whereas the rest of the
indices indicate that larger is better.
Next, we performed the VIKOR method by using the relative weights acquired from
the AHP in the previous section to calculate the weighted performance values of each
university. Afterwards, we executed the ranking process. In our study, v is set as 0.5 for
VIKOR; that is, the findings of the VIKOR method are in accordance with the voting
results by consensus. The rankings of the private universities based on the evaluation
dimensions in the Administration category (A) are integrated in Table 7. Table 8 shows
both the rankings based on the scope of social science and the overall rankings based on
both evaluation categories.
Insert Table 7 about here
Insert Table 8 about here
Teaching Resources (AT) dimension satisfies both rules, we found that PU is better than
the other private universities at providing their students with superior Teaching Resources
(AT) (e.g., the total space and distribution conditions of classrooms, laboratories, books,
journals and other resources that would satisfy the students’ and teachers’ needs). In
addition, because the Internationalization (AI) dimension only satisfies the second rule,
we found that THU and SCU are superior to the other universities in terms of their
Internationalization (AI) (e.g., the conditions in which foreign scholars come visit, the
participation rates of teachers in important international academic activities, and the
requirements for students to pass English tests). Because both rules are satisfied by the
Extension Education Service (AE), we found that PCCU is better than other private
universities at providing Extension Education Service (AE) (e.g., more community-based
promotion measures, different educational cooperation measures, and specific results).
Because Discipline and Guidance (AD) satisfy both rules, we found that MCU is
superior to other private universities at providing Discipline and Guidance (AD) (e.g.,
investment in manpower and funds to involve more students in work-study related
measures as well as close monitoring of graduate employment consultations, the
processing conditions, and the results of the graduate employment consultations).
Moreover, as General Education (AG) only satisfies the second rule, we found that MCU
and NHU are better than the other private universities at providing General Education
(AG) activities (e.g., General education planning, more keynote speeches, and training
camps). Lastly, because Administrative Support (AA) satisfies both rules, we found that
SHU is better than the other private universities in terms of its ability to provide
Administrative Support (AA) (e.g., the service attitudes and quality of the administrative
staff, the communications among teachers and students, and the higher degree of
information publicity).
In accordance with the ranking results of the Professional category (e.g., Faculty
(PF), Teaching (PT), and Research (PR)), because the Professional category only satisfies
(including education) than the other private universities. Then, based on the ranking
result of taken two categories altogether into consideration, since both rules are satisfied,
we found that TKU has the best overall operational performance among all of the private
universities studied in this paper.
Table 9 summarizes the rankings for each performance evaluation among the 12
private universities. Table 9 shows that, in terms of the Professional category (P) (e.g.,
faculty, teaching, and research) and the overall operational performance, the rankings of
THU, FJU, SCU, TKU, NHU, and PCCU remain the same. Two reasons may explain this
result. First, this ranking is due to the impact of the weighted evaluation produced by the
AHP. Specifically, the weight of the Professional category (P) (w=0.5815) is higher than
that of the Administration category (A) (w=0.4185). Second, the aforementioned 6
private universities primarily channeled their efforts into their profession (e.g., faculty,
teaching, and research) in the past. Thus, each private university could optimize its use of
school resources and, therefore, attain a better overall operational performance.
Insert Table 9 about here
4.4 Ranking comparison between research result and official report
The Ministry of Education’s evaluations of the officially listed private universities
were determined by an evaluation committee. This committee conducted a
comprehensive analysis of the schools’ quantitative indexes, qualitative indexes,
statistical tables utilized in the questionnaire, field study results, and so on. This study
adopted an AHP expert questionnaire approach to calculate the weight of each index,
used the VIKOR method to calculate the weight performances of each school, and ranked
the schools by grouping the 12 universities through a quartile deviation approach. A top
25% ranking (i.e., top-three ranking subjects) was considered a Good (G) performance. A
ranking between 15%~75% (i.e., 4~9 ranking subjects) was considered a Medium (M)
a Weak (W) performance. Table 10 compiles the evaluation performances of these 12
private schools and the results published by the Ministry of Education.
Insert Table 10 about here
From the results indicated in Table 10, we discovered that all six subjects of THU
and TKU in the Administrative (A) published by the Ministry of Education showed Good
(G) performances. The Professional (P) in the social science field, which included
education, also showed a Good (G) performance grade, which indicates that, regardless
of Administration (A) or Professional (P), TKU and THU provided the best instructional
resources and faculty members as well as better quality of instruction and environments
for students who wish to learn. Thus, based on the results of the evaluations conducted by
the Ministry of Education, these seven subjects were rated with a Good (G) performance
grade. Among these seven subjects, five subjects in SCU and FJU had also shown Good
(G) performances, but SCU should strengthen the school’s Internationalization (AI) and
General Education (AG), whereas FJU should strengthen the school’s Extension
Education Service (AE) and Administrative Support (AA) to achieve better ratings.
Based on the results of the evaluations conducted by the Ministry of Education, CJCU,
AU, NHU and USC did not show Good (G) ratings in Administration (A) and
Professional (P), which indicates that these schools had shown Weak (W) performances
and should therefore be watchful.
From the research findings, only Teaching Resources (AT) of TKU showed a Weak
(W) performance (i.e., lowest 25% ranking) in the performance evaluation of
Administrative (A). Its performances in the other subjects were rated Medium (M). In
Professional (P), the subjects that showed Good (G) performances (top 25% ranking)
were Faculty (PF), Teaching (PT) and Research (PR). In Professional (P), FJU showed
Good (G) performances in Faculty (PF), Teaching (PT) and Research (PR), but Weak (W)
the remaining subjects. Thus, FJU needs to strengthen its Discipline and Guidance. With
respect to Administrative (A), SCU showed Good (G) performances in three subjects:
Internationalization (AI), Extension Education Service (AE) and Administrative Support
(AA). In the other subjects, SCU showed Medium (M) performances.
In Table 10, the evaluation results in Administrative (A) from two schools were
found to have a great impact on Teaching Resources (AT), Discipline and Guidance (AD),
and General Education (AG). The gray-colored section showed a great difference in the
evaluation results in Administrative (A) between this study and the Ministry of Education.
The Ministry of Education rated the Discipline and Guidance (AD) of THU and FJU as
Good (G) performances, but this study rated the same areas as having shown Weak (W)
performances. The Ministry of Education rated the Teaching Resources (AT) of TKU as
a Good (G) performance, but this study rated these performances as Weak (W). The
Ministry of Education rated the Teaching Resources (AT) of AU as Weak (W), but we
found a Good (G) performance in this study. In Professional (P), seven schools (FJU,
TKU, PU, MCU, USC, AU and CJCU) assessed by this study and the Ministry of
Education were consistent (indicated in “italics”) and showed no significant differences.
A comparison of the evaluations performed by this study and those of the Ministry
of Education revealed several explanations for the different results. First, this study
analyzed the evaluation indices by calculating the AHP weight values with the aid of the
senior experts’ opinions. Doing so led to a discrepancy in the results between our study
and that of the Ministry of Education. Second, this study only evaluated the quantitative
evaluation indices, but the Ministry of Education evaluated both qualitative and
quantitative evaluation indices. Lastly, this study conducted VIKOR ranking results and
then compared them with the Ministry of Education’s results through a grade differential
method. However, the Ministry of Education only published its results without providing
detailed explanation on how to evaluate the results. Thus, we witnessed different
5. Conclusion and Remarks
This study adopted the quantitative evaluation indices developed by the Taiwan
Assessment and Evaluation Association (TWAEA) to establish a hierarchical structure.
The opinions from the various experts were compiled using the AHP to perform weight
analysis on the various evaluation indices. The relevant performance data from the 12
literature-, law- and business-oriented private universities were then added to the index
weights to discover the values of the comprehensive weight performances at each school.
In the end, we conducted an empirical analysis by using the VIKOR method. The
important research conclusions, practical management implications, and suggestions for
future research are summarized in the following sections.
5.1 Research conclusions
Because of the complexity and diversified viewpoints of higher education functions,
performance evaluations of higher education have always been a hot debate topic among
educators, managers, and policymakers. Thus, previous investigations of this subject
mostly stressed the significance of performance evaluations, methods, indices and modes.
Unlike previous scholars, this study utilized the overall content of the university
evaluation indices published by the Ministry of Education as basis of exploration. We
used MCDM to verify the mutual competition problems through a compromise deal of
the evaluation criteria and the program ranking method. After compilation, we listed the
empirical results of the study as follows.
First, from the weight results of the AHP analysis, Professional (P) was found to be
most important among the second-level dimensions (including two evaluation categories).
Faculty (PF) in the third level was an important evaluation dimension that affected the
evaluation results. Teacher-student ratio (PF2) in the fourth level (including 27 evaluation
criteria) was the most important criterion, and at the fifth level (including 64 evaluation
indices), Fantasy (PF) contained the three most important indices: Ratio of full-time
(0.0499), and Weighted ratio of faculty and students (PF2.1) (0.0489). Hence, poor
overall teacher qualifications have a high impact on the students, as higher education
institutions are important premises for nurturing knowledge innovation and management.
Universities need to recruit teachers who can cultivate the research abilities of new
generations. Therefore, the higher education experts considered teacher qualifications to
have a crucial impact on a school’s performance.
Second, this study conducted a comprehensive performance evaluation through the
university’s Administration (A) (e.g., Teaching Resources (AT), Internationalization (AI),
Extension Education Service (AE), Discipline and Guidance (AD), General Education
(AG), and Administrative Support (AA)), and Professional (P) (e.g., scope of social
science including the education). Among the 12 literature-, law-, and business-oriented
private universities, TKU ranked first. The seven evaluation dimensions from TKU
showed better performances on the evaluation results published by the Ministry of
Education, which indicated that the performances from TKU were excellent.
Third, universities that showed poor performances (NHU, AU and CJCU) should
strengthen Administration (A) (e.g., Teaching Resources (AT), Internationalization (AI),
Extension Education Service (AE), Discipline and Guidance (AD), General Education
(AG), and Administrative Support (AA)) and Professional (P) (e.g., Faculty (PF),
Teaching (PT) and Research (PR)). Schools that showed Weak (W) evaluations must do
their best to upgrade their performances despite their limited resources.
Fourth, the establishment of evaluation indices is core to evaluating a university.
Although there are different levels of index weights, they must be corrected sequentially
and continuously to continue the trend worldwide. This study used the AHP to calculate
the weights of various evaluation indices. In doing so, we provided students, industries,
and the public with a reference point for selecting universities, talents, or contributions to
educational industries. In addition, based on the index weight analysis, each university
should self-evaluate to identify its key evaluation indices and commit to full-scale
Furthermore, the empirical results of the weighted performance ranking in conjunction
with secondary information (including Administration (A) and Overall operation
performance) showed that the universities’ performances in some key evaluation indices
affect the ranking results. However, these evaluation results reflected the management
flaws of each university such that the evaluations helped each university to weight its
evaluation indices for reviewing and improving purposes. Thus, these universities
optimized their performances under limited resources.
Finally, this study discovered that, in the previous research on the impact of
evaluation indices on universities’ performance evaluations, some evaluation indices
lacked weighted distributions, which caused difficulties in their overall evaluations.
However, many indices existed for evaluating the universities’ performances, and it was
necessary to list the relative weights of each index to allow the universities to understand
the key evaluation indices that affected their performances. These universities would then
provide the best teachers, courses and educational quality that they could muster given
their limited resources for the students. In doing so, they created a good learning
environment, helped maintain the universities’ educational standards, improved the
operational performances and finally, helped upgrade the quality of higher education. As
many past studies did not take the weights of the evaluation indices into consideration,
this study has established the comprehensive, quantitative, weighted evaluation indices
for all university affairs and established a perfect university evaluation model with the
objective of evaluating the competitive niches that are dominated by domestic
universities and colleges.
5.2 Practical management implications
Based on the process and results of this study, we offer the following management
implications for the government agencies and university administrators who wish to take
countermeasures.
started to deal with university evaluation work in 1975. The implementation generated
different opinions on the evaluation mechanism. Generally, most people supported the
functions of university evaluation, but many of those who held opposite views had
criticized from the perspective of the evaluation processing units, evaluation methods and
the credibility of the evaluation results. In 1997, the government organized a
“Comprehensive University Evaluation,” which specified the characteristics, advantages
and disadvantages of each university. The evaluation system gradually took shape, but
the lack of a management and supervision mechanism rendered the system just another
form of description. Not until the Ministry of Education had commissioned TWAEA to
conduct the “University Evaluation” in 2004 did the evaluation indices become set.
However, the indices still lacked a weight ratio. As the evaluation indices on the
performance of each aspect tended to be different, the evaluation committee had to grade
the evaluation indices to set up a fair evaluation system. Hence, this study established the
weighted evaluation indices, the sequence of the evaluation indices through the AHP
structure and an expert questionnaire. The goal of our study was to provide the students
of each university with the best educational quality, despite limited resources. Thus, the
purpose was to provide the universities and relevant education units with the evaluation
system as an important reference point for implementing performance evaluation systems
in the future.
Second, in each period since 1975, Taiwanese universities have developed different
evaluation methods or indices. In the developed countries, the university evaluation
results, regardless of ranking or reports, are published on certain websites. Although our
education evaluation system has constantly improved, we fear that publicizing the school
ranking results would generate many disputes. Thus, the results are published in grade
form instead. In this study, we collected the secondary information by adding the rank in
the VIKOR sequence method of the MCDM model upon evaluating the performances of
the 12 literature-, law- and business-oriented private universities. Although the
generate different results, they were unable to provide the educational institutions or
school administrators with a reference source.
Finally, universities are able to self-evaluate by using the varied, weighted
evaluation indices complied by this study. They can then make their own plans based on
the external evaluation criteria. For example, a university administrator may execute the
evaluation activities, gather and analyze the relevant data, write and publish the
self-evaluation reports, and conduct self-examination to induce improvements. These
strategies would be useful for evaluating organizational performances or for realizing
self-improvement.
5.3 Suggestions for Future Researches
This study referred to the university evaluation indices from the TWAEA to
construct the hierarchy of relationships. We developed various weighted evaluation
indices by utilizing the questionnaire analysis performed by senior education experts.
Because of the number of evaluation indices, the TWAEA did not set up a weight ratio
for the evaluation indices. We suggest that future research conduct in-depth exploration
through the use of the weighted evaluation indices obtained from this study. These
studies may add a fuzzy theory (e.g., Fuzzy AHP) or use other analytical methods to
build the weighted evaluation indices and compare the weights with the research findings
of this study.
In addition, we collected the secondary information in the empirical section of this
study from the Ministry of Education’s evaluation of 12 private universities in the year
2005. Future research may add qualitative evaluation indices (e.g., examine the
self-evaluation process or develop the characteristics and goals) into the performance
evaluation mechanism presented in this study.
Moreover, because the completion time of this study was quite long, the
performance data used are unfortunately no longer the most current (i.e., 2005). It is
have changed as time passed due to the fact that the 12 private universities would have
contributed different levels of effort into performance improvement in accordance with
their development direction and organizational resources. Future research is therefore
encouraged to utilize the latest performance data to investigate the potential performance
change of these 12 private universities over the past 6 years.
Lastly, because globalization creates fierce competition among universities
nationally, private universities can no longer just compete with each other but with
national universities, i.e., those owned by Taiwanese government, have fewer financial
concerns while undertaking performance improvement. To accurately reflect the real
performance situations of both private universities and Taiwanese higher educational
institutions, future research is recommended to take national universities into
[image:32.842.68.783.76.514.2]
Appendix A
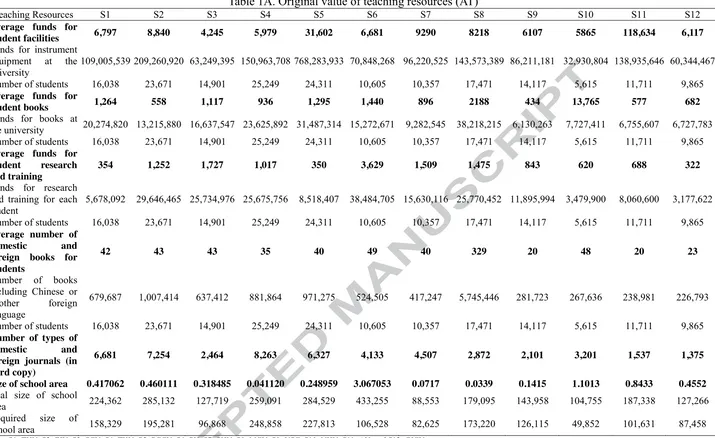
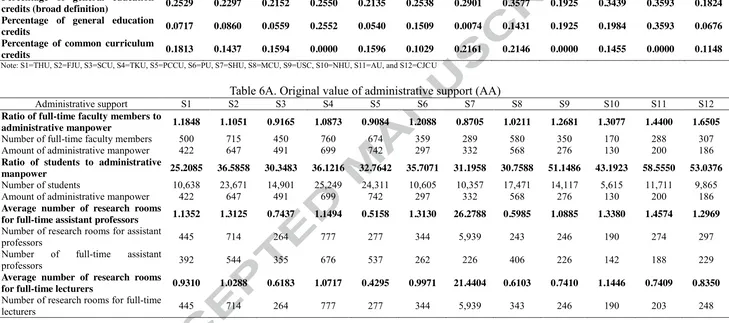
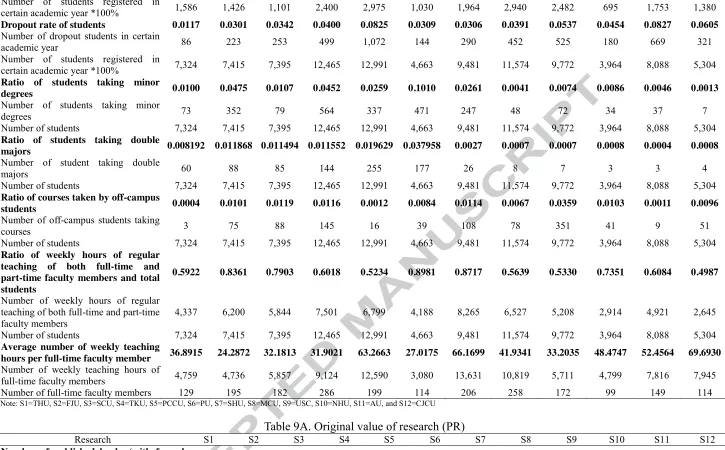
Table 1A. Original value of teaching resources (AT)
Teaching Resources S1 S2 S3 S4 S5 S6 S7 S8 S9 S10 S11 S12
Average funds for
student facilities 6,797 8,840 4,245 5,979 31,602 6,681 9290 8218 6107 5865 118,634 6,117
Funds for instrument equipment at the
university 109,005,539 209,260,920 63,249,395 150,963,708 768,283,933 70,848,268 96,220,525 143,573,389 86,211,181 32,930,804 138,935,646 60,344,467 Number of students 16,038 23,671 14,901 25,249 24,311 10,605 10,357 17,471 14,117 5,615 11,711 9,865
Average funds for
student books 1,264 558 1,117 936 1,295 1,440 896 2188 434 13,765 577 682
Funds for books at
the university 20,274,820 13,215,880 16,637,547 23,625,892 31,487,314 15,272,671 9,282,545 38,218,215 6,130,263 7,727,411 6,755,607 6,727,783 Number of students 16,038 23,671 14,901 25,249 24,311 10,605 10,357 17,471 14,117 5,615 11,711 9,865
Average funds for student research and training
354 1,252 1,727 1,017 350 3,629 1,509 1,475 843 620 688 322
Funds for research and training for each
student 5,678,092 29,646,465 25,734,976 25,675,756 8,518,407 38,484,705 15,630,116 25,770,452 11,895,994 3,479,900 8,060,600 3,177,622 Number of students 16,038 23,671 14,901 25,249 24,311 10,605 10,357 17,471 14,117 5,615 11,711 9,865
Average number of domestic and foreign books for students
42 43 43 35 40 49 40 329 20 48 20 23
Number of books including Chinese or another foreign language
679,687 1,007,414 637,412 881,864 971,275 524,505 417,247 5,745,446 281,723 267,636 238,981 226,793
Number of students 16,038 23,671 14,901 25,249 24,311 10,605 10,357 17,471 14,117 5,615 11,711 9,865
Number of types of domestic and foreign journals (in hard copy)
6,681 7,254 2,464 8,263 6,327 4,133 4,507 2,872 2,101 3,201 1,537 1,375
Size of school area 0.417062 0.460111 0.318485 0.041120 0.248959 3.067053 0.0717 0.0339 0.1415 1.1013 0.8433 0.4552
Real size of school
area 224,362 285,132 127,719 259,091 284,529 433,255 88,553 179,095 143,958 104,755 187,338 127,266 Required size of
Table 2A. Original value of internationalization (AI)
Internationalization S1 S2 S3 S4 S5 S6 S7 S8 S9 S10 S11 S12
Ratio of foreign students 0.0014 0.0022 0.0020 0.0023 0.0021 0.0029 0.0041 0.0143 0.0011 0.0084 0.0000 0.0001
Number of accepted foreign students 23 53 30 57 51 31 42 249 15 47 0 1
Total students *100% 16,038 23,671 14,901 25,249 24,311 10,605 10,357 17,471 14,117 5,615 11,711 9,865
Ratio of foreign faculty members 0.0940 0.0601 0.0533 0.0566 0.0757 0.0474 0.0173 0.1000 0.0686 0.0294 0.0417 0.0326
Number of foreign faculty members 47 43 24 43 51 17 5 58 24 5 12 10
Number of full-time faculty members 500 715 450 760 674 359 289 580 350 170 288 307
Ratio of courses taught in English 0.0624 0.0176 0.0525 0.0726 0.0121 0.0661 0.0078 0.1958 0.0568 0.0461 0.0363 0.0406
Number of courses taught in English 263 108 266 495 95 295 19 566 268 85 135 144
Total courses *100% 4,214 6,127 5,067 6,814 7,837 4,465 2,435 2,891 4,718 1,843 3,721 3,550
Ratio of students with General English
Proficiency Test in mid-level certificates 0.0297 0.0433 0.0766 0.0060 0.0144 0.0220 0.0385 0.0085 0.0281 0.0087 0.0086 0.0258
Number of students who passed General English
Proficiency Test in mid-level 477 1,026 1,141 151 350 233 399 148 397 49 101 255
Total students*100% 16,038 23,671 14,901 25,249 24,311 10,605 10,357 17,471 14,117 5,615 11,711 9,865
Average number of accepted journal papers per
full-time faculty member(SCI、SSCI、AHCI) 0.3120 0.2392 0.1067 0.3789 0.1202 0.2228 0.0588 0.1500 0.1171 0.2000 0.0486 0.1726
Number of accepted journal papers produced by
full-time faculty members (SCI, SSCI, and AHCI) 156 171 48 288 81 80 17 87 41 34 14 53
Number of full-time faculty members 500 715 450 760 674 359 289 580 350 170 288 307
Number of international conference papers per full-time faculty member (Restricted by conferences that have external announcement of calls for papers and formal review process)
0.3520 0.2098 0.1733 0.4987 0.1751 0.3398 0.1696 0.1810 0.2457 0.2588 0.1771 0.2866
Number of conference papers of full-time faculty members (Restricted by conferences that have external announcement of calls for papers and formal review process)
176 150 78 379 118 122 49 105 86 44 51 88
Number of full-time faculty members 500 715 450 760 674 359 289 580 350 170 288 307
Number of international cooperation
projects/research 9 8 2 3 0 3 0 380,000 86 0 0 1
Number of international cooperation
projects/research (including Mainland China) 9 8 2 3 0 3 0 380,000 86 0 0 1
Note: S1=THU, S2=FJU, S3=SCU, S4=TKU, S5=PCCU, S6=PU, S7=SHU, S8=MCU, S9=USC, S10=NHU, S11=AU, and S12=CJCU
Amount of income of
extension education 95,003,59331,408,636 110,011,351104,782,723605,246,400 29,382,793 39,551,387 19,725,599 86,411,317 9,036,192 43,753,311 16,356,608
Amount of income of promotion
education 95,003,59331,408,636 110,011,351104,782,723605,246,400 29,382,793 39,551,387 19,725,599 86,411,317 9,036,192 43,753,311 16,356,608
Average income of extension education for each full-time faculty member
190,007 43,928 244,470 14,188 897,992 81,846 136,856 34,010 246,889 53,154 151,921 53,279
Amount of income of extension
education 95,003,59331,408,636 110,011,35110,782,723 605,246,400 29,382,793 39,551,387 19,725,599 86,411,317 9,036,192 43,753,311 16,356,608 Number of full-time faculty
members 500 715 450 760 674 359 289 580 350 170 288 307
Ratio of full-time faculty members to part-time faculty members of extension education
0.4186 2.3834 0.3478 1.0894 0.0839 1.5701 0.2189 2.0385 0.5588 1.7703 0.6039 0.6918
Number of full-time faculty members for extension
education 445 460 56 134 138 168 109 265 171 131 93 211
Number of part-time faculty members for extension
education 1,063 193 161 123 1,645 107 498 130 306 74 154 305
Ratio of extension education hours and regular education hours
1.0619 1.1024 3.1458 2.1862 7.2652 1.0588 0.6000 0.8720 1.4956 1.5392 3.0423 1.9061
Number of hours for opened
extension education classes 27,254 27,639 46,640 47,013 153,281 11,029 12,172 12,456 17,529 9,748 27,591 17,376 Number of teaching hours for
regular education 25,666 25,071 14,826 21,504 21,098 10,417 20,287 14,284 11,720 6,333 9,069 9,116
[image:34.842.73.786.82.376.2]Note: S1=THU, S2=FJU, S3=SCU, S4=TKU, S5=PCCU, S6=PU, S7=SHU, S8=MCU, S9=USC, S10=NHU, S11=AU, and S12=CJCU
Table 4A. Original value of discipline and guidance (AD)
Discipline and guidance S1 S2 S3 S4 S5 S6 S7 S8 S9 S10 S11 S12
Average number of clubs joined by
each student 0.6859 0.4647 0.5939 0.6989 0.8823 0.6982 0.4459 1.8695 0.3560 0.7020 0.2508 0.4562
Number of clubs joined by the
students 11,000 11,000 8,850 17,646 21,449 7,404 4,618 32,662 5,025 3,942 2,937 4,500
Number of students 16,038 23,671 14,901 25,249 24,311 10,605 10,357 17,471 14,117 5,615 11,711 9,865
Average hours of part-time jobs per