Measuring the Structural and Conceptual Similarity
of Folktales using Plot Graphs
Victoria Anugrah Lestari and Ruli Manurung Faculty of Computer Science, Universitas Indonesia
Depok 16424, West Java, Indonesia
[email protected], [email protected]
Abstract
This paper presents an approach to or-ganizing folktales based on a data struc-ture called a plot graph, which captures the narrative flow of events in a folktale. The similarity between two folktales can be computed as the structural similarity between their corresponding plot graphs. This is performed using the well-known Needleman-Wunsch algorithm. To test the efficacy of this approach, experiments are carried out using a small collection of 24 folktales grouped into 5 categories based on the Aarne-Thompson index. The best result is obtained by combining the pro-posed structural-based similarity measure with a more conventional bag of words vector space model, where 19 out of the 24 folktales (79.16%) yield higher aver-age similarity with folktales within their respective categories as opposed to across categories.
1 Introduction
Folktales are prevalent in almost all cultures, and are a rich and valuable part of our cultural heritage. They serve as a valuable resource for many studies into our history, sociology, and language. Analysis and classification has typically been done by folk-lorists, with one of the most well-known methods being the Aarne-Thompson index (Uther, 2004), which organizes folktales around the concept of motifs and themes. Folktales that are deemed to be similar based on such concepts are grouped to-gether.
Recently, a significant amount of research has been conducted on the application of natural lan-guage processing and computational linguistics to automatically organize folktale data (Karsdorp and van den Bosch, 2013; Lobo and de Matos,
2010; Nguyen et al., 2012; Nguyen et al., 2013). Most of these approaches use the bag of words model, which measures similarity based on the number of shared features, namely words. This paper proposes a method that also takes into ac-count the structural similarity between the se-quences of events found in folktales.
The goal of our work is to develop a data struc-ture that can be utilized to capstruc-ture the strucstruc-ture of events, relations, and entities of a folktale. For that purpose, we propose a data structure known as aplot graphbased on the work of McIntyre and Lapata (2010). The purpose of the plot graph is to record the plot movers and preserve the sequence of events in folktales. The similarity between two plot graphs can be compared by first measur-ing the similarity between words in correspondmeasur-ing vertices. The similarity between words is mea-sured using the Wu-Palmer method of WordNet-based lexical semantic similarity (Wu and Palmer, 1994). The vertices in the plot graphs are aligned using the Needleman-Wunsch algorithm (Needle-man and Wunsch, 1970).
The outline of the paper is as follows. An overview of related work is presented in Section 2, followed by discussion of the proposed plot graph data structure in Section 3 and how to measure the similarity of plot graphs in Section 4. Finally, Sec-tion 5 provides details of experimental results and Section 6 offers our conclusion and suggestions for future work.
2 Related Work
The Aarne-Thompson index or classification sys-tem (Uther, 2004) is a widely adopted and stan-dardized index used by many folklorists. It was first developed by Antti Aarne in 1910, revised by Stith Thompson in 1928 and 1961, and by Hans-J¨org Uther in 2004. The system identifies a folktale through its motifs and structural patterns rather than the particular details of its characters
actions.
In recent years, there has been a significant amount of research in trying to automatically or-ganize folktale data using standardized indices such as the Aarne-Thompson index. In the work of Karsdorp and van den Bosch (2013), motifs in a folktale are identified using the Labeled-LDA (La-tent Dirichlet Allocation), which represents motifs as distribution over words. A training model is built utilizing TF-IDF (term frequency ×inverse document frequency) weights as the attributes of each folktale. In the work of Lobo and de Matos (2010), a fairy tale corpus is partitioned into se-mantically related clusters using Latent Semantic Mapping. The model is built by first construct-ing a term-document matrix and then applyconstruct-ing the singular value decomposition (SVD) matrix fac-torization followed by dimensionality reduction (achieved by rank reduction) to obtain a lower di-mensional space that maps documents in a con-ceptual space. Finally, the works of (Nguyen et al., 2012; Nguyen et al., 2013) employ a super-vised classification approach using a labeled cor-pus and various linguistic features. The former uses the SVM classifier whereas the latter employs learning-to-rank strategies.
One thing to note is that all of these existing approaches measure the similarity between folk-tales based on the degree of overlapping features that are typically derived from the co-occurrence of specific words or phrases. In other words, most of these approaches tend to view folktales using an approach that is known as the bag of words model. However, this approach fails to recognize the com-plex structure of a narrative found within a folk-tale, which involves plot movers and sequences of events. Since folktales are narratives, which nec-essarily convey a sequence of events, we argue that this narrative flow of events can possibly represent the underlying characteristic of a folktale better than bag of words methods. Furthermore, this may coincide well with the Aarne-Thompson index, as it is known that Antti Aarne focused on the mor-phology, or structure, of the folktale. We provide an illustrative example in Section 3.
In terms of cognitive models of similarity, we can say that the existing approaches adopt a more feature-based similarity model (Tversky, 1977), whereas we argue in favor of an approach that also takes into account structural similarity (Gentner, 1983).
In trying to formulate a model that takes into ac-count the structural nature of narratives, one work that is of special interest is McIntyre and Lapata (2010), which develops a plot graph for the pur-pose of story generation. The graph captures the plot of a story by storing each entity in a vertex and each action in another vertex. Through genetic algorithm techniques, the plot graph experiences mutation and crossover with another plot graph, resulting in a new, randomized graph to generate a new story. Although the end task is significantly different, i.e. the generation of new stories, the ap-proach to modelling plot structure is one that we adopt.
Our approach, which we will now describe in Sections 3 and 4, differs from the aforementioned works of Lobo and de Matos (2010; Nguyen et al. (2012; Nguyen et al. (2013; Karsdorp and van den Bosch (2013) in that it does not adopt a bag of words approach to capture the motif of a folk-tale. Rather, we build the plot graph based on the work of McIntyre and Lapata (2010), although with some modifications.
3 Structural similarity and plot graphs Based on work in the area of cognitive sci-ence (Love, 2000), we propose two factors that must be considered when modelling human per-ception of similarity: structural similarity and conceptual similarity. Structural similarity mea-sures the degree of isomorphism between com-plex objects. Conceptual similarity is a measure of relatedness between two corresponding concepts, assuming that the entities in the complex objects have been appropriately mapped.
the similarities of the folktales.
3.1 Definition of a plot graph
We define the plot of a folktale as a sequence of events consisting of the following parts:
Action – The main word, usually a verb, that drives the course of events in a sentence. A sen-tence may have more than one action.
Child– A word related to an action based on its dependency relation. An action may have zero to many children.
Entity– An actor or object contained in the event. A sentence may have more than one entity.
The plot graph represents the sequence of events and the entities involved in a folktale. Thus, two plot graphs can be compared to yield a similar-ity score. In our experiments, we use the depen-dency parser (de Marneffe and Manning, 2008) and coreference resolution tool (Lee et al., 2013) found in Stanford CoreNLP library1. Our algo-rithm processes one sentence at a time. A sentence is parsed, and its coreferences are resolved. The actions, children, and entities are identified to be stored in the plot graph.
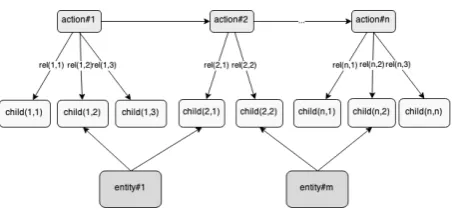
More formally, a plot graph is a directed acyclic graph representing a folktale that has been decom-posed into actions, children, and entities. A plot graph is more predictable than a regular graph be-cause it has a pattern, a start, and an end. Formally, a plot graph Gis defined as an ordered six-tuple (V1, V2, V3, E1, E2, E3) with the following speci-fication:
• V1is a set of vertices that represent actions in the folktale. V1 may haven elements, with
n ≥ 1. An element of V1 is called action vertex.
• V2 is a set of vertices that represent children (words related to actions) in the folktale. V2 may havek elements, with k ≥ 1. An ele-ment ofV2is calledchild vertex.
• V3is a set of vertices that represent entities in the folktale. V3 may havem elements, with
m ≥ 1. An element of V3 is called entity vertex.
• E1is a set of edges that links exactly two ele-ments ofV1.E1may haven−1elements. An element ofE1 is calledaction–action edge. 1http://nlp.stanford.edu/software/
corenlp.shtml
• E2 is a set of edges that links an element of
V1 and an element ofV2. E2may have up to
n×kelements. An element ofE2 is called action-child edge.
• E3 is a set of edges that links an element of
V2 and an element ofV3. E3may have up to
[image:3.595.308.535.225.334.2]m×kelements. An element ofE3 is called entity–child vertex.
Figure 1 provides an illustration of the schema of a plot graph.
Figure 1: Schema of a plot graph
Note that there are some differences between our plot graphs as defined above with the plot graphs of McIntyre and Lapata (2010), where our plot graph is not an entity-based graph and that a vertex only contains a single event or entity.
3.2 Construction process
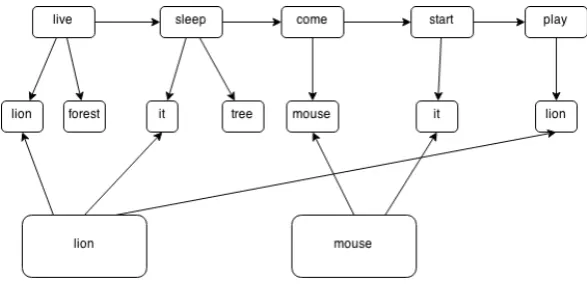
The construction of a plot graph is shown in the following example. Consider the first paragraph of the short folktale “A Friend in Need Is a Friend Indeed”:
Once upon a time there lived a lion in a for-est. One day after a heavy meal, it was sleep-ing under a tree. After a while, there came a mouse and it started to play on the lion.
With the dependency parser, we extract the de-pendency relations between the words in the folk-tale and identify the verbs, if there are any, as the actions. A dependency relation takes the form of relation(word1, word2), where word1 is the gover-norand word2 is thedependent. The above para-graph yields the following relations:
prep in(lived-6, forest-11)
npadvmod(sleeping-10, day-2) prep after(sleeping-10, meal-6) nsubj(sleeping-10, it-8)
aux(sleeping-10, was-9)
prep under(sleeping-10, tree-13)
prep after(came-6, while-3) expl(came-6, there-5) dobj(came-6, mouse-8) conj and(came-6, started-11)
nsubj(started-11, it-10) xcomp(started-11, play-13)
aux(play-13, to-12) prep on(play-13, lion-16)
First, observing that the governors of the re-lations nsubj (nominal subject), expl (expletive “there”), and aux (auxiliary) are best identified as the actions of the folktale, the action words ”lived”, ”sleeping”, ”came”, ”start”, and ”play” are obtained, and are used to form the action ver-tices.
Next, the words that are related to the actions (namely, the dependent of the relation) are ob-tained and identified as the children. These are used to form the child vertices, after first removing words such as ”once”, ”there”, and ”was”. Finally, coreference resolution is used to detect anaphoric references between the entities. Entity vertices are formed and linked to the child vertices. Entities that only occur once in the sentence are not in-cluded in the entity vertices. Thus, there are only two entities that are identified in this example, namely ”the lion” in sentence 1, and ”the mouse” in sentence 3. The resulting plot graph can be seen in Figure 2.
4 Similarity Measurement
The similarity between two plot graphs is repre-sented by a score in the interval [0,1]. A score of 0 denotes that the plot graphs are completely dis-similar, while a score of 1 denotes that the plot graphs are identical. To measure the similarity be-tween plot graphs, first we align the action vertex sequences of the respective plot graphs.
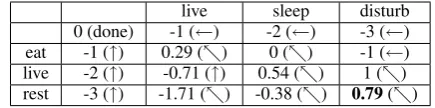
[image:4.595.306.524.62.116.2]live sleep disturb 0 (done) -1 (←) -2 (←) -3 (←) eat -1 (↑) 0.29 (-) 0 (-) -1 (←) live -2 (↑) -0.71 (↑) 0.54 (-) 1 (-) rest -3 (↑) -1.71 (-) -0.38 (-) 0.79(-)
Table 1: The final state of alignment matrix
Strictly speaking, computing a structural simi-larity mapping between two such complex expres-sions is an instance of the NP-hard graph isomor-phism problem. However, if we observe the defi-nition of the plot graph, we can see that it is mostly linear in structure: the sequence of event vertices forms the spine of the graph, and it is this sequence that most determines the plot. Thus, we can reduce the problem of mapping two plot graphs to a linear case of sequence matching, for which much more efficient algorithms are known.
We use the Needleman-Wunsch algorithm to obtain the maximum score of the optimal align-ment. As a variation of the edit distance mea-surement, the Needleman-Wunsch algorithm uses a dynamic programming approach to fill two ma-trices: the alignment matrix and the trace-back matrix (Needleman and Wunsch, 1970).
In this work, we use the Wu-Palmer similar-ity measurement for the scoring matrix (Wu and Palmer, 1994). If a vertex is aligned with a gap instead of another vertex, we give a gap penalty. Then we compute the word similarity between two corresponding action vertices of the respective plot graphs. We also compute the word similarity between two corresponding child vertices.
The following example shows how the Needleman-Wunsch algorithm is used to align folktales. Suppose we have two plot graphs. The first has the action vertices containing the words “live”, “sleep”, and “disturb”. The second has the action vertices containing the words “eat”, “live”, and “rest”. We build the scoring matrix using the Wu-Palmer similarity measurement and determine the gap penalty to be -1. After filling the alignment matrix and the trace-back matrix according to the algorithm, we obtain the final conditions of both matrices as shown in Tables 1.
Figure 2: Plot graph representation of “A Friend in Need is a Friend Indeed”
sim(p1, p2) =α×
n X
i=1
sim(a1i, a2i)
+Xg+β× n X
i=1
sim(c1i, c2i)
(1) with:
p1= the first plot graph
p2= the second plot graph
α= coefficient for action vertex similarity
β= coefficient for child vertex similarity
(a1i, a2i) = ordered pair of action vertices from
the alignment ofp1andp2
g= gap penalty
(c1i, c2i)= ordered pair of child vertices from the
alignment ofp1andp2
n= alignment length ofp1andp2
To obtain a similarity score between 0 and 1, we normalize the score from Equation (1) with a feature scaling equation, as seen in Equation (2).
x0 = x−min(x) max(x)−min(x)
max(x) =max(length(s1), length(s2))
min(x) =max(x)×g
(2)
with:
x0 = transformed score x= the previous score
s1= the first sequence
s2= the second sequence
g= gap penalty
Given two plot graphs, p1 andp2, each having lengthn, the maximum similarity score isn. For
each alignment of action vertices, the score is 1, leading to the maximum score,n×1 =n. On the other hand, the minimum score is obtained when a plot graph with lengthnis compared to an empty plot graph (without vertices), where each action vertex is aligned with a gap. Therefore, the mini-mum score isn×g.
5 Experiments
5.1 Parameter tuning
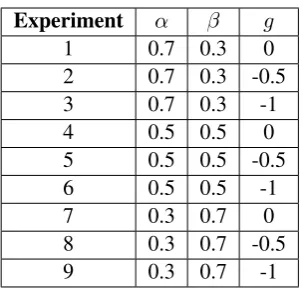
The coefficientsαandβdetermine the relative im-portance to be placed on the similarity of the ac-tions as opposed to the corresponding entities in-volved in the actions, whereasg determines how much the similarity measure is willing to tolerate skips or swaps in the action sequences. To em-pirically determine the best values for these three values, a small experiment using 6 short folktales from an online collection of simple short stories2 is conducted. Each folktale is manually modified into 5 different paraphrases through word substi-tution, sentence structure changes, and insertion or deletion of words or sentences. We experiment with 3 differentαandβvalues and 3 gap penalty values for a total of 9 combinations, as can be seen in Table 2. With this scheme, we expect to see the behavior of the system when we put more weight on action vertex similarity, equal weight on both action similarity and child similarity, and more weight on child vertex similarity.
After extracting plot graphs from each folktale and their 5 paraphrases, we do a complete pair-wise comparison between all plot graphs. We then average the similarity between each folktale and its 5 paraphrases, and separately we average the 2http://www.english-for-students.com/
Experiment α β g
1 0.7 0.3 0
2 0.7 0.3 -0.5
3 0.7 0.3 -1
4 0.5 0.5 0
5 0.5 0.5 -0.5
6 0.5 0.5 -1
7 0.3 0.7 0
8 0.3 0.7 -0.5
[image:6.595.106.258.59.204.2]9 0.3 0.7 -1
Table 2: Parameter variation for fine-tuning exper-iment
similarity between different folktales. We seek the parameter combination that maximizes the former value, because the paraphrases are essentially dif-ferent ways of retelling the same folktale, whilst minimizing the latter value, because the similar-ity between genuinely different folktales should be low. In other words, we seek to find the parame-ter combination that maximizes the difference be-tween these two values, as it leads to the strongest discriminatory power.
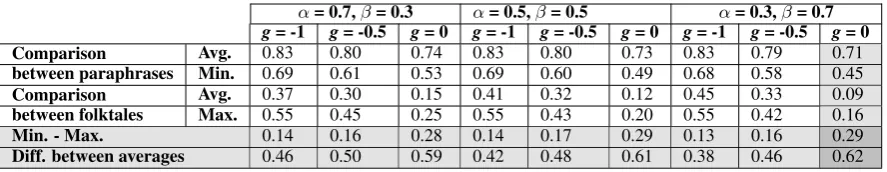
Table 3 shows the lowest similarity scores of comparison between paraphrases, the highest sim-ilarity scores of comparison between folktales, and the average scores of both comparisons.
Based on this empirical study, the values α = 0.3,β = 0.7, andg= 0 are determined as the best parameters. It is interesting to note that the param-eters that maximize perceived similarity are those that place more weight on the similarity of corre-sponding child nodes, i.e. the entities that are as-sociated with the actions. We believe this may be a reflection of how humans are sensitive to higher order matches, i.e. when not only elements from one analog map to elements in the other analog, but also when their respective parents and/or chil-dren are also in correspondence (Love, 2000). In other words, analogs are perceived as similar when they have a common relational structure (Gentner, 1983).
5.2 Comparison to bag of words
Having concluded the parameter tuning experi-ment, we move on to our main experiment that seeks to observe the efficacy of plot graphs as a representation of folktales. We compare it to a representative bag of words method, and also a
combination where the average between both sim-ilarities is used. For this experiment, we use 24 folktales from the Fairy Books of Andrew Lang, available under Project Gutenberg3. We classify the folktales into 5 groups according to the Aarne-Thompson index. The groups are as follows:
• Supernatural Adversaries — Bluebeard; Hansel and Gretel; Jack and the Beanstalk; Rapunzel; The Twelve Dancing Princesses.
• Supernatural or Enchanted Relatives — Beauty and the Beast; Brother and Sister; East of the Sun, West of the Moon; Snow White and Rose Red; The Bushy Bride; The Six Swans; The Sleeping Beauty.
• Supernatural Helpers— Cinderella; Don-key Skin; Puss in Boots; Rumpelstiltskin; The Goose Girl; The Story of Sigurd.
• Magic Objects — Aladdin and the Won-derful Lamp; Fortunatus and His Purse; The Golden Goose; The Magic Ring.
• Other Stories of the Supernatural— Little Thumb; The Princess and the Pea.
Note that it does not matter if the groups are unequal in size, since we are only analyzing the similarity scores of folktales between groups and within groups.
As before, the 24 folktales are automatically converted into plot graphs, and a pairwise compar-ison between all the plot graphs is conducted using the similarity measure described in Section 4. The longest of these folktales, Beauty and the Beast, yields 1,208 action vertices, 2,229 child vertices, and 694 entity vertices, whereas the shortest folk-tale, Jack and the Beanstalk, yields 633 action ver-tices, 1,260 child verver-tices, and 497 entity vertices. For the bag of words comparison, the folktales are first converted into vectors of words. Each component of the vector is the term frequency (TF) of the word in the folktale. We compare the vectors with each other using the cosine similarity measure:
α= 0.7,β= 0.3 α= 0.5,β= 0.5 α= 0.3,β= 0.7
g= -1 g= -0.5 g= 0 g= -1 g= -0.5 g= 0 g= -1 g= -0.5 g= 0
Avg. 0.83 0.80 0.74 0.83 0.80 0.73 0.83 0.79 0.71
Comparison
between paraphrases Min. 0.69 0.61 0.53 0.69 0.60 0.49 0.68 0.58 0.45
Avg. 0.37 0.30 0.15 0.41 0.32 0.12 0.45 0.33 0.09
Comparison
between folktales Max. 0.55 0.45 0.25 0.55 0.43 0.20 0.55 0.42 0.16
Min. - Max. 0.14 0.16 0.28 0.14 0.17 0.29 0.13 0.16 0.29
[image:7.595.78.522.61.147.2]Diff. between averages 0.46 0.50 0.59 0.42 0.48 0.61 0.38 0.46 0.62
Table 3: Results of parameter tuning
cos(6 A ~~B) = A~·B~
||A~||||B~|| (3)
withA~ andB~ denoting vectors of words.
The experiment is done under the expectation that the average similarity scores between folk-tales within a group are higher than the average similarity scores between folktales across the dif-ferent groups. In other words, “Aladdin and the Wonderful Lamp” should have a higher similarity score to “The Magic Ring”, since both of them be-long to theMagic Objectsgroup, than to “Beauty and the Beast”, which belongs to the Supernatu-ral or Enchanted Relatives.
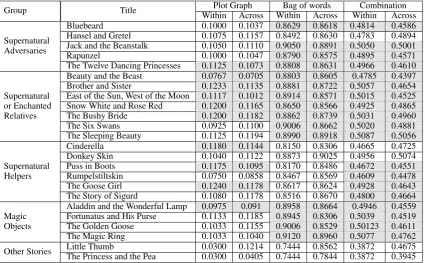
When using the plot graph-based similarity scores, out of the 24 folktales, only 10 folk-tales (41.67%) yield higher average scores within their respective groups than when compared to folktales across groups. When using the bag of words comparison method, 14 folktales (58.33%) yield higher scores in the “within group” compari-son. However, the combination experiment yields the best result, with 19 folktales (79.16%) yield-ing higher scores in the “within group” compar-ison. The details of the experiment result can be seen in Table 4. The shaded cells show in-stances of folktales that yield a higher score for the “within group” comparison as opposed to the “across group” comparison. Note that no such instances are found in the last group, which can probably be explained due to it being the catch-all “Other stories” group.
The proposed plot graph similarity does not per-form as well as the bag of words approach. Upon further inspection of the data, we note that most instances that do not fit our expectation occurs due to limitations in the automatic plot graph con-struction method that we have implemented rather than the theoretical model itself. We note sev-eral problems. The way the plot graph is con-structed based on the Stanford dependency parser can cause the system to judge two semantically
identical sentences with different syntactic struc-tures as different. For example, the sentence “If I am hungry, I will eat” will generate a plot graph consisting of action vertices hungryfollowed by
eat, whereas the sentence “I will eat if I am hun-gry” will generate a plot graph eat followed by
hungry4. Similarly, two semantically similar but structurally different sentences can generate sig-nificantly different plot graphs and, therefore, pro-duce a lower similarity score. For example, the sentence “The lion is very hungry” will generate a plot graph with an action vertexhungry and a child vertexlion, whereas the sentence “The lion has an extreme hunger” will generate a plot graph with an action vertexhaveand child verticeslion
andhunger. When the plot graphs are compared, the action verticeshungryandhavewill be com-pared, yielding a low similarity score.
Nevertheless, the best scenario is obtained when the similarity score of two folktales is the aver-age of their plot graph similarity and bag of words cosine similarity. This suggests that the informa-tion in the two representainforma-tions is complementary, and that both structural and feature-based similar-ity models may play a role in organizing folktales.
6 Summary
In this paper we have proposed a data structure called a plot graph to represent folktales. This plot graph maintains the sequence of events in the folk-tale by preserving the words and their relations to each other. The aim is to facilitate a similar-ity measure that takes into account both structural and conceptual similarity, as humans are sensitive to higher order relational matching.
Group Title WithinPlot GraphAcross WithinBag of wordsAcross WithinCombinationAcross
Supernatural Adversaries
Bluebeard 0.1000 0.1037 0.8629 0.8618 0.4814 0.4586
Hansel and Gretel 0.1075 0.1157 0.8492 0.8630 0.4783 0.4894 Jack and the Beanstalk 0.1050 0.1110 0.9050 0.8891 0.5050 0.5001
Rapunzel 0.1000 0.1047 0.8790 0.8575 0.4895 0.4571
The Twelve Dancing Princesses 0.1125 0.1073 0.8808 0.8631 0.4966 0.4610
Supernatural or Enchanted Relatives
Beauty and the Beast 0.0767 0.0705 0.8803 0.8605 0.4785 0.4397 Brother and Sister 0.1233 0.1135 0.8881 0.8722 0.5057 0.4654 East of the Sun, West of the Moon 0.1117 0.1012 0.8914 0.8571 0.5015 0.4525 Snow White and Rose Red 0.1200 0.1165 0.8650 0.8566 0.4925 0.4865 The Bushy Bride 0.1200 0.1182 0.8862 0.8739 0.5031 0.4960 The Six Swans 0.0925 0.1100 0.9006 0.8662 0.5020 0.4881 The Sleeping Beauty 0.1125 0.1194 0.8990 0.8918 0.5087 0.5056
Supernatural Helpers
Cinderella 0.1180 0.1144 0.8150 0.8306 0.4665 0.4725
Donkey Skin 0.1040 0.1122 0.8873 0.9025 0.4956 0.5074 Puss in Boots 0.1175 0.1095 0.8170 0.8486 0.4672 0.4551 Rumpelstiltskin 0.0750 0.0858 0.8467 0.8569 0.4609 0.4478 The Goose Girl 0.1240 0.1178 0.8617 0.8624 0.4928 0.4643 The Story of Sigurd 0.1080 0.1178 0.8516 0.8670 0.4800 0.4664 Magic
Objects
[image:8.595.88.514.62.325.2]Aladdin and the Wonderful Lamp 0.0975 0.091 0.8958 0.8664 0.4946 0.4559 Fortunatus and His Purse 0.1133 0.1185 0.8945 0.8306 0.5039 0.4519 The Golden Goose 0.1033 0.1155 0.9006 0.8529 0.50123 0.4611 The Magic Ring 0.1033 0.1040 0.9120 0.8960 0.5077 0.4762 Other Stories Little ThumbThe Princess and the Pea 0.03000.0300 0.12140.0405 0.74440.7444 0.85620.7844 0.38720.3872 0.46750.3945
Table 4: Experimental Results
information in the two representations is comple-mentary, and that both structural and feature-based similarity models play a role in organizing folk-tales.
An analysis of the experimental results reveal that the parsed dependency relations are still too sensitive towards syntactic variations, thus more work must be carried out to reliably produce plot graphs that are able to abstract away from these variations and to represent the structural properties of the narrative in a more consistent fashion. For future work, one approach that can be explored is the use of frame vertices using Semantic Role La-beling techniques (Gildea and Jurafsky, 2002), as this can further abstract away from syntactic vari-ations.
Finally, it would also be interesting to see how to incorporate manually richly-annotated narra-tives, e.g. (Elson and McKeown, 2010).
References
Marie-Catherine de Marneffe and Christopher D. Man-ning. 2008. The stanford typed dependencies
repre-sentation. InProceedings of the workshop on
Cross-Framework and Cross-Domain Parser Evaluation, pages 1–8, Manchester, UK.
David K. Elson and Kathleen R. McKeown. 2010. Building a bank of semantically encoded narratives. In Nicoletta Calzolari (Conference Chair), Khalid
Choukri, Bente Maegaard, Joseph Mariani, Jan Odijk, Stelios Piperidis, Mike Rosner, and Daniel
Tapias, editors,Proceedings of the Seventh
Interna-tional Conference on Language Resources and Eval-uation (LREC’10), Valletta, Malta. European Lan-guage Resources Association (ELRA).
Dedre Gentner. 1983. Structure-mapping: A
theo-retical framework for analogy. Cognitive Science,
7(2):155–170.
Daniel Gildea and Daniel Jurafsky. 2002. Automatic
labeling of semantic roles. Computational
Linguis-tics, 28(3):245–288.
Folgert Karsdorp and Antal van den Bosch. 2013. Identifying motifs in folktales using topic models. In Proceedings of the 22nd Annual Belgian-Dutch Conference on Machine Learning, pages 41–49, Nij-megen, Netherlands.
Heeyoung Lee, Angel Chang, Yves Peirsman, Nathanael Chambers, Mihai Surdeanu, and Dan Ju-rafsky. 2013. Deterministic coreference resolu-tion based on entity-centric, precision-ranked rules.
Computational Linguistics, 39(4):885–916.
Paula Cristina Vaz Lobo and David Martins de Matos. 2010. Fairy tale corpus organization using latent semantic mapping and an item-to-item top-n
rec-ommendation algorithm. In Proceedings of the
2010 Language Resources and Evaluation Confer-ence (LREC 2010), Valletta, Malta.
Bradley C. Love. 2000. A computational level
the-ory of similarity. InProceedings of the 22nd
Neil McIntyre and Mirella Lapata. 2010. Plot induc-tion and evoluinduc-tionary search for story generainduc-tion. In
Proceedings of the 48th Annual Meeting of the Asso-ciation for Computational Linguistics, pages 1562– 1572, Uppsala, Sweden. Association for Computa-tional Linguistics.
Saul B. Needleman and Christian D. Wunsch. 1970. A general method applicable to the search for simi-larities in the amino acid sequence of two proteins.
Journal of Molecular Biology, 48:443–453. Dong Nguyen, Dolf Trieschnigg, Theo Meder, and
Mari¨et Theune. 2012. Automatic classification of
folk narrative genres. InProceedings of KONVENS
2012 (LThist 2012 workshop), pages 378–382, Vi-enna, Austria.
Dong Nguyen, Dolf Trieschnigg, and Mari¨et Theune. 2013. Folktale classification using learning to rank. InProceedings of the 35th European Conference on IR Research (ECIR 2013), pages 195–206, Moscow, Russia.
Amos Tversky. 1977. Features of similarity.
Psycho-logical Review, 84(4):327–352.
Hans-J¨org Uther. 2004. The Types of
Interna-tional Folktales: A Classification and Bibliography. Academia Scientiarum Fennica, Helsinki, Finland. Zhibiao Wu and Martha Palmer. 1994. Verb semantics
and lexical selection. In Proceedings of the 32nd