CSIRO Data61 at the WNUT Geo Shared Task
Gaya Jayasinghe, Brian Jin, James McHugh, Bella Robinson, Stephen Wan CSIRO Data61
Australia
Abstract
In this paper, we describe CSIRO Data61’s participation in the Geolocation shared task at the Workshop for Noisy User-generated Text. Our approach was to use ensemble methods to cap-italise on four component methods: heuristics based on metadata, a label propagation method, timezone text classifiers, and an information retrieval approach. The ensembles we explored focused on examining the role of language technologies in geolocation prediction and also in examining the use of hard voting and cascading ensemble methods. Based on the accuracy of city-level predictions, our systems were the best performing submissions at this year’s shared task. Furthermore, when estimating the latitude and longitude of a user, our median error dis-tance was accurate to within 30 kilometers.
1 Introduction
Social media platforms present an attractive source of real-time and large volume data for analysts. Publicly available data from these platforms can provide insights that shape our understanding of a number of different topics, such as early signals on the outbreaks of diseases (for example, see Robinson et al. (2015)), natural disasters such as earthquakes and fires (Yin et al., 2012), or the mental health of populations as represented by online data (Larsen et al., 2015).
For analytics where aggregated data is used to provide insights, geographical information is important. For example, responses to early signals of disease outbreaks or natural disasters are more effective with geolocation metadata. Geographical information could be used at different granularities, such as com-paring rural and city mental health. However, most social media platforms do not provide geographical metadata. For example, it is reported that less than 3% of Twitter data has geo-coordinates provided (Jurgens et al., 2015), even though the platform supports geolocation metadata. Other platforms, such as public discussion forums and blogs often do not have geolocation capabilities. There is thus a need to develop approaches to automatically determine location information for social media content.
As part of the 2016 Workshop on Noisy User-generated Text, a shared task to infer geolocation for Twitter posts and users was organised (Han et al., 2016).1 The goal was twofold: (i) for an English Twitter post, infer the city location; and (2) for a Twitter user (authoring mainly English Tweets), infer the user’s base city.
In this paper, we describe the approach of the CSIRO Data61 team to this shared task. We adopted an ensemble approach combining four complementary methods for predicting geolocation.
The shared task results revealed that our system was placed first for accuracy for city location. As we optimised for city location, we narrowly missed out on first place for the median accuracy when predicting latitude and longitude coordinates.
2 Preparing Data
In this section, we describe the collection and preparation of the shared task data and addition geospatial resources used by some of the component methods.
1http://noisy-text.github.io/2016/geo-shared-task.html
2.1 Shared Task Data
Starting with the data release from the shared task organisers, our first task was to download the training and validation sets as JSON2 objects from the Twitter Application Programming Interface (API). The JSON data includes the text of the Twitter post and the profile information for the Twitter users, as well as associated metadata. At the time of collection, not all the data was available as some users had elected to remove or change the privacy settings of accounts and/or content. We were able to collect 9,472,450 training tweets (73.84% of the data set) and 783,492 distinct users (78.35% of the data set).
The data was then loaded into a database so that queries could be used, as needed by each of the different approaches. The primary table of the database was designed with each Twitter post as a record. Queries could then retrieve the different JSON metadata fields for a given post. As this also contains identifiers for the Twitter user who authored the post, we could retrieve the posts for given Twitter user.
2.2 A GeoNames Mirror
Some of our approaches require a service to map from locations to the corresponding latitude and lon-gitude coordinates. Such translations are provided by web services such as GeoNames3. We created a local version of the GeoNames service and indexed it with Apache Solr, which allows spatial indexing allowing queries such as “find places within X km”, as well as place name searches. We refer to this resource as the GeoNames Solr Mirror. We also loaded GeoNames data into a PostgreSQL database with the PostGIS extension in order to map city labels to time zones using the “point within polygon” function.
2.3 A Mapping from Shared Task City Labels to Geonames
We created mappings between the 3363 shared task labels found in the training and validation data sets and their corresponding GeoNames cities. In most cases, this was done automatically by using the first section of the label as the query to our GeoNames Solr Mirror. With this approach, we mapped most shared task labels to a GeoNames location within 100km of the gold label coordinates. Only 11 shared task labels could not be mapped automatically, which we created manually.
2.4 A Mapping from Twitter Time zones to the “TZ” resource
Twitter uses a non-standard string format for time zone, making it difficult to link to other geospatial resources such as the publicly available time zone resource,TZ, which provides time zone boundaries.4 To utilize this resource, we obtained mappings from Twitter time zones to the TZ resource. As the Twitter format is very similar to those the Ruby on Rails (RoR) tool, we started with existing RoR to TZ resources.5 Missing mappings were then added manually. The mappings and the TZ resource were stored in a Postgres/PostGIS database.
3 Our Approaches to Geolocation
Our approach to the shared task was to use ensemble approaches, as the strengths of each component approach can offset the weakness of any individual approach. This was inspired by arguments about the strengths of combining social network methods with natural language processing methods (Jurgens et al. (2015), Rahimi et al. (2015)), and by work by Han and Cook (2013), who combined text classifiers and metadata approaches. Here, we explore a larger set of component methods: (i) use of heuristics based on metadata, (ii) a social network inference method, (iii) an information retrieval method, and (iv) a text classification method. We will now briefly describe these in more detail.
3.1 Metadata Methods
We used five methods based on Twitter metadata inspired by approaches described in Schulz et al. (2013). For all approaches, a list of candidate shared task labels was produced. We ranked shared task labels
2JavaScript Object Notation 3http://www.geonames.org/
4http://efele.net/maps/tz/world/
based on the prior probability of observing them in the training data. The most probable shared task label was then chosen as the city prediction, with GeoNames Solr Mirror providing the relevant latitude and longitude coordinates.
3.1.1 Metadata Text-to-Gazetteer
This method looks at the Twitter post text for mentions of place names. The text was tokenised and stopwords, punctuation sequences and URLs were removed. All remaining tokens were used as search input to our GeoNames Solr Mirror. Potential matching GeoNames places were then mapped to candidate shared task labels.
3.1.2 Metadata Location-to-Gazetteer
This method uses the location text field found in the user profile section of the Twitter post. This is a free-text field that may be left blank. We first checked if the location is a set of coordinates, for example “-6.156277, 106.57207”. For these, we mapped the coordinates to a candidate city using the GeoNames Solr Mirror, which provides the closest city location within 50km of the coordinates. For all other cases, the location text was treated similarly to text in the Metadata Text-to-Gazetteer method.
3.1.3 Metadata Time Zone
In this approach, we utilised the time zone information in the user’s profile, which takes a value from a finite set specified by Twitter. We mapped any time zone information to the equivalent TZ time zones (there may be more than one). For each TZ time zone, we issued a database query to find cities within the time zone boundaries. This provided a list of candidate cities.
For example, if the user has “Sydney” as their Twitter time zone setting, this was mapped to the “Australia/Sydney” TZ time zone, which contains a number of candidate shared task labels: e.g.,north shore-02-au,canberra-01-au,sydney-02-au.
3.1.4 Metadata UTC (Coordinated Universal Time)
This method utilises the UTC offset setting that is automatically generated by Twitter based on user’s time zone setting; it is not set directly by the user. This method defines a geographical area from which candidate cities are generated. For example, the UTC offset value 32400 (GMT+09:00) mapped to the Twitter time zones: Seoul, Osaka, Sapporo, Tokyo and Yakutsk. These were then converted into TZ time zones which are used to produce a list of candidate cities.
3.1.5 Metadata Application
Metadata for each Twitter post indicates the application used to create the content, for example “Twitter for iPhone” and “Twitter for Android”. We note that some apps are more popular in some countries than others. We thus used the training data to create probability distributions of countries for each possible application value, allowing country-level predictions to be made. Given a prediction for the country, we then generated list of candidate cities. As this metadata is always present, this method always provides a location prediction.
3.1.6 Metadata URL IP-Lookup
This method uses the Uniform Resource Locators (URLs) found in either the Twitter post text itself or in the user profile. We assumed that people are likely to include URLs hosted in their home country. After excluding URLs that refer to worldwide services with no specific host country (such as Facebook, Instagram and YouTube)6, we then converted URLs to Internet Protocol (IP) addresses. These can be used to look up the host country using the public domain resource, the IP2Location LITE database7. This allowed a list of host countries to be predicted, from which we generated a list of candidate cities.
3.1.7 Metadata Location-Based Service (LBS) Links
We implemented a second URL-based approach (unrelated to the prior method) to capitalise on links geolocation-centric web applications, or a Location-Based Service (LBS). LBSs have been shown to provide high precision estimates of location (Schulz et al., 2013). Using the training set, we identified the LBSs which commonly occurred: FourSquare8, Swarm9, Path10, Facebook11and Instagram12.
We first extracted the URL from metadata. If no tweet URLs were found in the post text, then URLs found in the user’s profile data were also considered. For Facebook and Instagram URLs, we mined the links to create queries for the respective platform Application Programming Interfaces (APIs). For the others, we scraped metadata from the target page of the link for geographic coordinates, using code specific to each LBS platform. We then used the GeoNames SOLR Mirror to retrieve a city which could then be mapped to a shared task label.
For Facebook links, we are interested in Pages, representing public entities, or Events. These are often publicly accessible and may have geolocation information attached. We can identify if a node is a Facebook Event or Page by checking whether it conforms to the following Facebook URL templates.13 For those templates that resulted in public (HTML) content, we extracted the relevant location latitude and longitude metadata.
For Instagram links, we mined the target webpage JSON for an Instagram-specific location identifier. This identifier could then be mapped to the web page for a location (using a prescribed URL pattern), providing latitude and longitude metadata.14
3.1.8 Metadata Combination
We also defined an ensemble using just metadata approaches. All techniques were executed individually with each producing a list of candidate cities. Each city was given a manual weighting depending on the method that produced it, using the following manual weighting scheme based on experiments with the validation set: (i) Metadata Location-based Service Links: 10; (ii) Metadata Text-to-Gazetteer: 6; (iii) Metadata Location-to-Gazetteer : 5; (iv) Metadata Time Zone: 3; (v) others: 1. The weighted candidate lists from each method were then combined, and weightings for cities appearing in more than one list were added together. The city with the maximum final weighting was selected.
3.2 Label Propagation Approaches
We implemented a label propagation-like method based on the work of Jurgens et al. (2015) and inspired by Jurgens’ publicly available code15. In this work, social media networks are defined using Twitter post interactions, specificallymentionswithin the Twitter post to other Twitter users (often with the pattern @screen name). A relationship between two Twitter users was only included in the network if both users mentioned each other (edges were bidirectional).
In this shared task, however, one constraint was to only use the network information induced from the shared task data, which led to small networks when using bidirectional edges. Following (Rahimi et al., 2015), we thus used unidirectional edges. Furthermore, we also included interaction edges based on replies, again adding unidirectional edges (User X replies to User Y). Once the network was constructed, edge direction was then ignored.
Using these definitions, we transformed the Twitter post data into a network, which we stored in a database as a series of relationships between asourceandtargetTwitter user. Each Twitter post contains
8https://foursquare.com 9https://www.swarmapp.com 10https://path.com
11https://www.facebook.com 12https://www.instagram.com
13URLs for Events typically take the form,https://www.facebook.com/Events/Event_ID, whereas Pages are either of the form, https://www.facebook.com/Page_UNIQUE_IDENTIFIERor https://www.facebook. com/Page-NAME-Page_ID. The latter is used when the Page has not been designated a unique identifier (only the most popular pages are given these).
an author screen name as metadata. For links based on mentions, we extracted mentioned authors screen name in metadata. For reply links, we found the metadata about the post that triggered the reply and extracted the author screen name. For predictions on the test set, although the Twitter user identifiers were hashed, the metadata still existed to create a mention and reply network which could be linked to the networks derived from the training and validation sets.
Our label propagation method used a single iteration, and inferred the location of a Twitter user based on the neighbours in the graph. Issuing the appropriate database queries provided the neighbours for a user using the network. For all neighbours, we computed the majority city. For the users sharing the majority city, we calculated the average latitude and longitude. In situations where there was a tie for the majority city, we randomly selected a city.
We applied two variants of this approach that differed in the depth of the neighbourhood. For a single “hop” (which we refer to as the1-hop label propagationmethod), we looked at the immediate neighbours of a user. For hop depth of 2, (which we refer to as the2-hop label propagationmethod), we recursively retrieved the neighbours of the neighbours and treated these as if they were 1-hop neighbours. We then applied the 1-hop method to the Twitter user in question.
We evaluated these approaches on a network based on the training data and using the validation set as our gold standard. The 1-hop method performed well, with an accuracy of 62%. The accuracy of
the2-hopmethod was approximately 31%. However, the1-hopnetwork only covered 16% of validation
set while 2-hopcovered 66%. We note that increasing the hop depth beyond 2 hops did not increase coverage substantially. The two variants thus introduce a trade-off between coverage and accuracy, which we exploit in the ensemble methods.
3.3 Information Retrieval Approaches
We employed an information retrieval approach based on the premise that a Twitter post is likely to originate from the same location as the majority of similar tweets in the training dataset. This hinges, of course, on the definition of similarity. For example, consider content in the formI’m at place X in city Y
and alsoI am in place X, city Y: that is, Twitter posts with similar mentions. For such posts, we assume that they occur in the same location. We now describe method to capture such similarity efficiently.
To retrieve Twitter posts with similar text, we index the training data using the Apache Solr search engine. Twitter post text is indexed using hash signatures that can capture similarity. Such approaches have been used in information retrieval to detect near duplicates (Broder, 1997). One benefit of using hash signatures in the index is that we avoid pairwise comparisons of documents.
Specifically, we used the following procedure. We first preprocessed the text of the Twitter post to normalise for case and then tokenised the text. We then generated a MinHash signature of 100 integers for each token in the normalised Twitter post, as described in Broder (1997). Finally, we divided the MinHash signature into 25 bands to produce locality sensitive hashes (LSHs) (Leskovec et al., 2014). The locality sensitive hashes were indexed. For a given Twitter post, we transformed it into an LSH, and retrieved the top 10 search results in our Solr search engine.
Any@mentions were also specifically indexed, again using an Apache Solr search engine. For a given Twitter post, we retrieved the top 10 search results having similar mentions.
For each set of search results, we then retrieved the associated shared task labels for these results and obtained a probability estimated for each label, computed as the frequency normalised by the number of retrieved search results. The label with the highest probability from either method was then selected as the prediction. We refer to this approach as theInformation Retrievalmethod.
3.4 Text Classification Approach
centroid latitude and longitude for the cluster.16
At training time, we iterated through the list of unique time zones found in the training set. For each subset of data sharing a time zone, we trained a classifier, using a modified version of the Pigeo. We first preprocessed and tokenised the Twitter post text in the training set using the CMU Twokenizer tool17 (Gimpel et al., 2011).
The system then performs k-means clustering on the Twitter posts for a given time zone. We used k= 200for this work. This provides a cluster identifier that can be used as a label for each Twitter post. This label is associated to the median latitude and longitude for the cluster.
We use the cluster labels to train a logistic regression classifier, using the default feature set (unigrams with TFIDF weights) and parameters of the Pigeo system, with minor changes (i) to handle time zone models, and (ii) to use our own geospatial resources.
After training, this resulted in approximately 300 classifiers. To apply the time zone text classifiers, our approach identifies the timezone of the Twitter post to be classified and then uses the relevant classi-fication model to predict latitude and longitude. We use our geospatial resources to then map the latitude and longitude to a shared task label.
4 Producing Twitter Post and User Predictions
The approaches described in the preceding section are generally oriented toward producing a prediction for the Twitter post. The exceptions are the label propagation methods, which predict user locations.
We applied heuristics to allow each component method to work for either scenario. For the label progation methods, to predictions for a Twitter post, we simply applied the predicted location of the user. For all other methods, to produce predictions for a user, we retrieved the Twitter posts authored by that user in the test set and computed a shared task label for the post.18 Then, for all posts, the majority label was found and chosen as the label prediction for the user. We calculated the mean latitude and longitude from those posts sharing the majority label to compute the coordinates for the user.
5 Submitted Ensembles
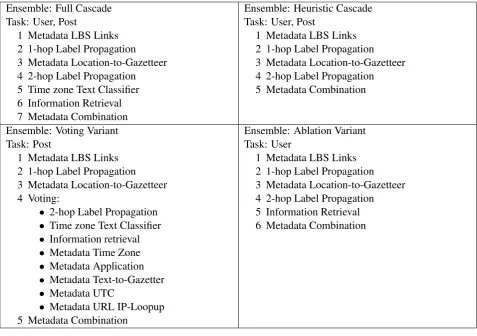
We submitted three ensemble approaches for each of the two variants of the shared task (the first focusing on Twitter posts, the second on Twitter users). These are listed in Table 1. We now describe each of these.
5.1 Ensembles for Twitter Post Geolocation
The Full Cascade19 system was a cascade of components. Components were ordered based on their
accuracy at predicting the city location in the validation set, with the best performing systems occurering earlier. We note that earlier components also have the benefit of providing only high-quality predictions or none at all. That is, they err on the side of precision.
TheHeuristic Cascade20system only includes methods based on the Metadata of the Twitter post, and also the label propagation (which only propagates location metadata). These were again ordered based on their accuracy on the validation set.
TheVoting Variant21system used a mixture of cascades and voting methods to combine the component methods. We started with a cascade of the high precision heuristic and label propagation methods. We then used a voting mechanism for the other methods. Finally, for any Twitter posts that were left unlabelled, we used the Combined Metadata approach to provide a prediction. The voting mechanism was such that there had to be more than one vote for a city prediction, and there could be no ties.
16The full Pigeo system also combines the text classification approach with a label propagation approach, however this functionality was not available in the version that was downloaded.
17https://github.com/brendano/ark-tweet-nlp/blob/master/src/cmu/arktweetnlp/
Twokenize.java
18For the text classification approach, there was a slight variation which was to use a label generated from the latitude and longitude coordinates, accurate to 1 decimal place.
Ensemble: Full Cascade Task: User, Post
1 Metadata LBS Links 2 1-hop Label Propagation 3 Metadata Location-to-Gazetteer 4 2-hop Label Propagation 5 Time zone Text Classifier 6 Information Retrieval 7 Metadata Combination
Ensemble: Heuristic Cascade Task: User, Post
1 Metadata LBS Links 2 1-hop Label Propagation 3 Metadata Location-to-Gazetteer 4 2-hop Label Propagation 5 Metadata Combination
Ensemble: Voting Variant Task: Post
1 Metadata LBS Links 2 1-hop Label Propagation 3 Metadata Location-to-Gazetteer 4 Voting:
• 2-hop Label Propagation • Time zone Text Classifier • Information retrieval • Metadata Time Zone • Metadata Application • Metadata Text-to-Gazetter • Metadata UTC
• Metadata URL IP-Loopup 5 Metadata Combination
Ensemble: Ablation Variant Task: User
[image:7.595.72.550.61.397.2]1 Metadata LBS Links 2 1-hop Label Propagation 3 Metadata Location-to-Gazetteer 4 2-hop Label Propagation 5 Information Retrieval 6 Metadata Combination
Table 1: Ensembles submitted.
5.2 Ensembles for Twitter User Geolocation
We submitted 3 systems to the Twitter user variant of the shared task. The Full Cascade and Voting Variant systems were as described above, except that, for each component, the version that produced user-level predictions was used.22 The Ablation Variant23 system uses all (user prediction) approaches in the Full Cascade except the time zone text classification approach.
6 Results
In Table 2, we report the official evaluation results for the Twitter post variant of the shared task.24 The two metrics reported are the classification accuracy (for a city-level label), and the median error distance. For accuracy, the higher the score, the better. For the median error distance, the aim is to minimise this score. We also list the maximum, mean and minimum scores.
Based on the accuracy, our Full Cascade submission was the best performing system submitted. In fact, our three systems come in the top 3 ranks. In terms of median error distance, our Full Cascade submission is the second best system. Our other two submissions come in 3rd and 4th place. All three submissions do better than the mean.
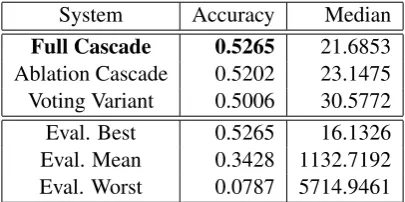
In Table 2, we report the official evaluation results for the Twitter user variant of the shared task in the same format as above. In terms of the accuracy metric, our Full Cascade submission was the best performing system and our three systems again come in the top 3 ranks. The systems come in 3rd, 4th and 6th place when examining median error distance. All three submissions do better than the mean.
22These were csiro.1.user and csiro.3.user respectively in the shared task results. 23This is csiro.2.user in the shared task results.
System Accuracy Median
Full Cascade 0.4362 74.6866
[image:8.595.70.278.62.164.2]Heuristic Cascade 0.4217 183.7280 Voting Variant 0.4195 226.3125 Eval. Best 0.4362 69.4985 Eval. Mean 0.2755 1836.8786 Eval. Worst 0.0778 5848.3488 Table 2: Evaluation results for Twitter posts.
System Accuracy Median
Full Cascade 0.5265 21.6853
Ablation Cascade 0.5202 23.1475 Voting Variant 0.5006 30.5772 Eval. Best 0.5265 16.1326 Eval. Mean 0.3428 1132.7192 Eval. Worst 0.0787 5714.9461
Table 3: Evaluation results for Twitter users.
7 Discussion
Our variants were chosen to explore two questions: (i) what is the contribution of language technology approaches; (ii) can voting approaches help when no clear cascade ordering is apparent. We describe some early insights from the published evaluation results.
We find that language technologies, at least in their current implementations here, had a small effect on accuracy. This is evidenced by the small drop in performance between the Full Cascade and the Heuristic Cascade, where, in the latter, the two language technology approaches, the time zone text classifier and the information retrieval approach, have been removed.
We note, however, that the time zone text classifier had the ability, where it was applicable, to minimise the median error distance. Indeed, omitting this classifier worsens the median error distance, as can be seen in Table 2, where the Heuristic Cascade (without language technology) has a higher mean error distance than the Full Cascade (with language technology).
Our implementation of the voting mechanism could not out-perform our cascades with manual or-derings of components. We note that our components do not always expose a ranked list of candidate locations, and so only a hard voting is possible.
In future work, we will explore alternative ways to harness language technologies. This might include an exploration of ambiguous cases where a Twitter post is about events that do not coincide with the Twitter user’s location.
We would also like to examine approaches that utilise the probability of predictions in producing the final location estimate. We note that our systems did well when measuring performance with accuracy, which may be because we optimised our cascade for this metric. We may have obtained a different ordering had we use the median error distance. In future work, we will explore this interaction further.
8 Conclusion
We described the submitted CSIRO Data61 systems in the Geolocation shared task at the Workshop for Noisy User-generated Text. Based on the accuracy at the predicting the city of a Twitter post or user, our systems were the best performing submissions. For estimating the latitude and longitude of a user, our median error distance was accurate to within 30 kilometers. Our approach was to use ensemble methods to capitalise on four component methods: heuristics based on metadata, a label propagation method, time zone text classifiers, and an information retrieval approaches.
Acknowledgements
[image:8.595.322.525.63.164.2]References
Andrei Z. Broder. 1997. On the resemblance and containment of documents. InProceedings of the Compression and Complexity of Sequences 1997, pages 21–29. IEEE.
Kevin Gimpel, Nathan Schneider, Brendan O’Connor, Dipanjan Das, Daniel Mills, Jacob Eisenstein, Michael Heil-man, Dani Yogatama, Jeffrey Flanigan, and Noah A. Smith. 2011. Part-of-speech tagging for twitter: Annota-tion, features, and experiments. InProceedings of the 49th Annual Meeting of the Association for Computational Linguistics: Human Language Technologies: Short Papers - Volume 2, HLT ’11, pages 42–47, Stroudsburg, PA, USA. Association for Computational Linguistics.
Bo Han and Paul Cook. 2013. A stacking-based approach to twitter user geolocation prediction. InIn Proceedings of the 51st Annual Meeting of the Association for Computational Linguistics (ACL 2013): System Demonstra-tions, pages 7–12.
Bo Han, Afshin Rahimi, Leon Derczynski, and Timothy Baldwin. 2016. Twitter geolocation prediction shared task of the 2016 workshop on noisy user-generated text. InProceedings of the 2nd Workshop on Noisy User-generated Text (W-NUT 2016), Osaka Japan.
David Jurgens, Tyler Finethy, James McCorriston, Yi Tian Xu, and Derek Ruths. 2015. Geolocation prediction in twitter using social networks: A critical analysis and review of current practice. InProceedings of the Ninth International Conference on Web and Social Media, ICWSM 2015, University of Oxford, Oxford, UK, May 26-29, 2015, pages 188–197.
Mark E. Larsen, Tjeerd W. Boonstra, Philip J. Batterham, Bridianne O’Dea, Cecile Paris, and Helen Christensen. 2015. We Feel: Mapping Emotion on Twitter. IEEE Journal of Biomedical and Health Informatics, 19(4):1246– 1252.
Jure Leskovec, Anand Rajaraman, and Jeffrey David Ullman. 2014. Mining of massive datasets. Cambridge University Press.
Jalal Mahmud, Jeffrey Nichols, and Clemens Drews. 2012. Where is this tweet from? inferring home locations of twitter users. In John G. Breslin, Nicole B. Ellison, James G. Shanahan, and Zeynep Tufekci, editors,ICWSM. The AAAI Press.
Afshin Rahimi, Trevor Cohn, and Timothy Baldwin. 2015. Twitter user geolocation using a unified text and network prediction model. InProceedings of the 53rd Annual Meeting of the Association for Computational Linguistics and the 7th International Joint Conference on Natural Language Processing (Volume 2: Short Pa-pers), pages 630–636, Beijing, China, July. Association for Computational Linguistics.
Afshin Rahimi, Trevor Cohn, and Timothy Baldwin. 2016. pigeo: A python geotagging tool. InProceedings of ACL-2016 System Demonstrations, pages 127–132, Berlin, Germany, August. Association for Computational Linguistics.
Bella Robinson, Ross Sparks, Robert Power, and [email protected]/MIS.2012.6, Title = Using So-cial Media to Enhance Emergency Situation Awareness, Author = Jie Yin and Andrew Lampert and Mark Cameron and Bella Robinson and Robert Power, Journal = IEEE Intelligent Systems, Year = 2012, Number = 6, Pages = 52-59, Volume = 27, Address = Los Alamitos, CA, USA, Doi = http://doi.ieeecomputersociety.org/10.1109/MIS.2012.6, ISSN = 1541-1672, Owner = wan049, Publisher = IEEE Computer Society, Timestamp = 2016.08.22 Cameron. 2015. Social Media Monitoring for Health Indicators. pages 1862–1868.
Axel Schulz, Aristotelis Hadjakos, Heiko Paulheim, Johannes Nachtwey, and Max Mhlhuser. 2013. A multi-indicator approach for geolocalization of tweets. InInternational AAAI Conference on Web and Social Media. Jie Yin, Andrew Lampert, Mark Cameron, Bella Robinson, and Robert Power. 2012. Using social media to