Hybrid Decision Tree and Naïve Bayes Classifier for
Predicting Study Period and Predicate of Student’s
Graduation
Nurul Renaningtias
Master of Information System
Universitas Diponegoro
Semarang, Indonesia
Jatmiko Endro Suseno
Department of Physics
Univeritas Diponegoro
Semarang, Indonesia
Rahmat Gernowo
Department of Physics
Univeritas Diponegoro
Semarang, Indonesia
ABSTRACT
One of the biggest challenges that faces by institutionsof the higher education is to improve the quality of the educational system. This problem can be solved by managing student data at institutionsof higher education to discover hidden patterns and knowledge by designing an information system. This study aims to designing an information system based on hybrid decision tree and naïve bayes classifier to predict the study period and predicate of graduated. The data are used in this research such as the Grade Point Average (GPA) from early 2 semesters, type of entrance examinations, origin of the high school, origin of the city, major in high school, gender, scholarship and relationship status amounting to 215 sets of data. The learning process is done by using hybrid of decision tree C4.5 algorithm and naive bayes classifier with data partition 70%, 80% and 90%. The results found that using a 90% data partition gives a higher accuracy score of 72.73% in predicting the study period and predicate of graduation predicate.
General Terms
Predicting study period and predicate of graduated
Keywords
Data mining, decision tree, naïve bayes classifier, NBTree, and student performance.
1.
INTRODUCTION
The use of data mining techniques in educational data becomes a useful strategic tool in dealing with difficult and crucial challenges to improve the quality of education by supporting higher education institutions in the decision making process [1]. Educational data mining (EDM) is a method to explore large data derived from educational data. EDM refers to techniques, tools, and research designed to automatically extract the meaning of large data repositories generated from learning activities in educational organizations [2][3].
Semi-automatic processes using statistical, mathematical, artificial intelligence, and machine learning techniques to extract and identify information stored in large databases are known as data mining [4]. Seen in Figure 1, all those involved in the education process in college can benefit by applying data mining [5]. Techniques in data mining that can be used to
process data in college is a classification technique. This technique is a learning technique to predict the class of an unknown object [6].
The data of students contained in the database university can be used to find valuable information such as the length of study period that will be taken by the students and the predicate of graduation obtained by the students when completing the study by building an information system to predict the study period and predicate of the students based on the student data which have already passed in the college database.The scientific method capable to prediction study period and predicate of graduted is hybrid decision tree and naïve bayes classifier.
Decision tree is a very powerful and well-known classification method. The decision tree method transforms a fact into a decision tree that represents the rule. Decision tree algorithm has a high degree of accuracy but has long computational time while naïve bayes have the best computing time to build a model. Naïve bayes classifier is a simple probability classification technique, which assumes that all attributes given in the dataset are independent of each other. Naïve bayes are able to classify and predict future values based on their previous values [7]. So in this study using hybrid decision tree and naïve bayes that can provide effective classification results to reduce computational time and better accuracy results than other algorithms [8].
Hybrid decision tree and naïve bayes aims to predict the study period of students who have two target variables which are according to whether the student is graduation on time or late. Then predicts the predicate of graduation students which have three target variables such as cum laude, very satisfactory and satisfactory. The prediction’s results can help in managing and evaluating quality so as to find solutions or policies in the learning evaluation process.
2.
RESEARCH METHODOLOGY
The research methodology used to solve the problem of predicting student performance is described as follow.
2.1
Decision Tree
Fig 1: Cycle of data mining implementation in educational system
large data sets into smaller record sets by applying a set of decision rules [9]. The decision tree uses a hierarchical structure for supervised learning. The process of the decision tree starts from the root node until the leaf node is done recursively. Each branch declares a condition to be met and at each end of the tree represents the class of a data. The decision tree consists of three parts such as root node, internal node and leaf node. The root node is the first node in the decision tree which have no incoming edges and one or more outgoing edges, an internal node is a middle node in the decision tree which have one incoming edge, and one or more outgoig edges, the leaf node is the last node in the decision tree structure which represents the final suggested class of a data object.
2.2
C4.5 Algorithm
The C4.5 algorithm is one of the modern algorithms used to perform data mining. Algorima C4.5 has advantages such as being able to handle attributes with discrete or continuous types and able to overcome missing data. The steps of C4.5 algorithm are as follows.
a. Determine the attribute that will be the root node and attribute that will be the next node. To select an attribute as a root, based on the highest gain ratio value of the attributes.
Gain S,A =Entropy S- Si S n
i=1
*Entropy Si ( 1 ) b. Before calculating the gain value of the attribute,
first calculate the entropy value.
Entropy S= - pi k
i=1
*log2 pi (2)
c. Calculate the split information.
SplitInfo S,A=- Si S c
t=1
log2Si
S (3) d. Calculate gain ratio
GainRatio S,A= Gain (S,A)
SplitInformation (S,A) (4)
2.3
Naïve Bayes Classifier
Naïve bayes classifier is considered to be potentially good at classifying documents compared to other classification methods in terms of accuracy and computational efficiency [10]. Naïve bayes classifier is a simple probability classification technique, which assumes that all attributes given in the dataset are independent of each other. Naïve bayes are able to classify and predict future values based on their previous values.
The naïve bayes algorithm has advantage of requiring short computational time while learning and improving classification performance by eliminating unsuitable attributes while the weaknesses of naïve bayes require considerable data to produce good results and poor accuracy compared to other classification algorithms in some dataset [11].
The naïve bayes equation that refer to the bayes theorem is described as follows.
PCiX =
P XCi P (Ci)
P(X) (5)
The steps of prediction with naïve bayes classifier are describes as follows.
a. A variable is a collection of data and labels associated with a class. Each data is represented by a vector of n-dimensional attributes X=X1,X2,..,Xn with n generated from data n attribute, respectively A1,A2,..,An.
b. If there are classes i, C1,C2,...,Cn, given an X data that would classify and predict X into the group having the highest posterior probability under condition X. This means that the classification naïve bayes predicts that X data belongs to the class if and only if the value of P(Ci) must be more than the value of P(Cj) to obtain the final result.
P(Ci)= (Ci,D )
|D|
( 5 ) d. If given a collection of data that has many attributes
then to reduce the calculation of P(X|Ci), naïve bayes assumes the creation of a conditional independent class then used equation 5.
PXCi = PxkCi =Px1Ci × n
k=1
… × PxnCi
( 6 ) e. P(X|Ci)P(Ci) is evaluated on each class Ci to predict
the classification of class X data labels using equation 6.
PXCi), P Ci > PXCj), P Cj , for 1 ≤j≤m,j ≠I ( 7 ) The class label for the predicted X data is class Ci if the value of P(X|Ci)P(Ci) is more than the value of P(X|Cj)P(Cj). Naïve bayes calculates the number of classes or labels contained in the data and then counts the same number of cases with the same class. Based on the results of the calculation, the next step is to multiply all the attributes contained in the same class. The result of multiplication of attributes in one class that has the highest value will show the predicted result of the calculation of naïve bayes.
2.4
Hybrid Decision Tree and Naïve Bayes
Classifier
Hybrid of the algorithms performs a grouping with naïve bayes on each leaf node of the built decision tree that integrates the advantages of both classification [12]. The algorithm uses the decision tree to classify training data each training data segment is represented by a leaf node on a decision tree and then builds a naïve bayes classification on each segment [13].
The hybrid of algorithms represents the learned knowledge in the form of a recursively constructed tree. For continuous attributes, the threshold is selected to limit the size of entropy. The algorithm estimates that the accuracy of naive bayes generalization on each leaf is higher than that of a single naive bayes classifier. This algorithm will build a decision tree with a node containing univariate split like the usual decision tree, but on leaf nodes contained naïve bayes classifier. This algorithm uses Bayes rules to find the probability of each class with the instance [13].
3.
DESIGN OF RESEARCH
3.1
Materials Research
The materials used in this research are the data of the students from Communication Study Program of Bengkulu University in the year between 2011 to 2013. The forms of materials are grade point average (GPA) from early 2 semesters, type of entrance examinations, origin of the high school, major in high school, origin of the city, gender, scholarship, status, study period and predicate student graduation amounting to 215 sets of data. The type of university entrance examination have sub attribute, such as SBMPTN (selection together entrance state universities), SNMPTN (national selection into state universities), PPA (selection of academic potential) and SPMU (admission selection independent path). These data are used in the training process as a dataset.
3.2
Research Procedures
[image:3.595.327.527.112.298.2]Research procedures of the system prediction of study period and predicate of graduate can be seen in Figure 2.
Fig 2: Research procedures
This research was designed using CRISP-DM model. The steps are as follows.
1. Data Cleanup and Integration
Data cleaning phase aims to eliminate noise or irrelevant data, then integration process aims to combine data from various databases into a new database.
2. Data Selection
At this stage data selection is done to reduce irrelevant and redundant data
3. Data Transformation
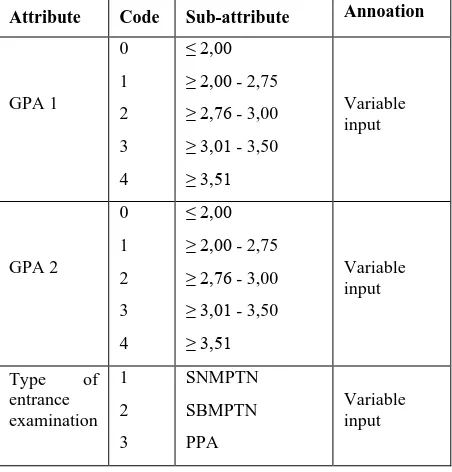
After the selection process is performed to obtain data that is eligible for predictability then change the data to the appropriate format, as shown in Table 1.
Table 1. Attributes used for training data
Attribute Code Sub-attribute Annoation
GPA 1
0 1 2 3 4
≤ 2,00 ≥ 2,00 - 2,75 ≥ 2,76 - 3,00 ≥ 3,01 - 3,50 ≥ 3,51
Variable input
GPA 2
0 1 2 3 4
≤ 2,00 ≥ 2,00 - 2,75 ≥ 2,76 - 3,00 ≥ 3,01 - 3,50 ≥ 3,51
Variable input
Type of entrance examination
1 2 3
SNMPTN SBMPTN PPA
[image:3.595.316.542.525.761.2]4 SPMU
Origin of the High School -
State Private
Variable input
Major in the High
School -
Sains Social Others
Variable input
Origin of the City -
Bengkulu Out of Bengkulu
Variable input Gender
- Male
Female
Variable input Scholarship
- Yes
No
Variable input Status
- Single Married
Variable input Study
Period - On time, ≤ 4 year Late, > 4 year
Variable target Predicate of
Graduated -
Cum laude Very Satisfactory Satisfactory
Variable target
4. Mining Process
This stage is done to form a model that can be used to fill the class label of new data that is not yet known as the class label. In this research, there are two class label which is study period and predicate of graduation. At this stage it uses hybrid of decision tree and naïve bayes classifier.
The leaf formed from the decision tree is a naïve bayes model that contains opportunities for each class and the probability of each attribute for each class. The attributes used for the prediction process can be seen in Table 1.
The mining process searches the value of entropy, information gain, split info and gain ratio to get the initial root of a decision tree. The process of calculating the search for entropy and gain values is done as this way equation 1-4 works. The attribute that has the highest gain ratio value will be the root of the decision tree. After getting root, the next process is to look for nodes that become internal node and leaf node. Calculations are performed as same as the calculation when looking for root node on a decision tree. Leaf nodes that have been formed contain naive bayes clasisifier. The result of hybrid decision tree and naïve bayes is used to predict the duration of the study and the predicate of graduatin of students in the form of rules formed from the mining process. 5. Pattern Evaluation
At this stage testing the model to calculate the performance obtained from the mining process. The method used in this evaluation and validation process uses confusion matrix. Confusion matrix is a table that contains the number of test
[image:4.595.54.281.71.450.2]records that are predicted correctly or incorrectly [14]. Performance model calculations in confusion matrix are based on True Positive (TP), True Negative (TN), False Positive (FP) and False Negative (FN) values. Table 2 shows the shape of the confusion matrix.
Table 2. Confusion matrix
Actual
Prediction
True False
True TP FN
False FP TN
The accuracy value describes how accurately the system can classify the data correctly. The accuracy value is the comparison between the correctly classified data with the whole data. The precision value describes the amount of positive category data classified correctly divided by the total data classified positively. Recall shows how many percent of positive category data are correctly classified by the system. The calculations can be seen in Formulas 8-10.
Accuracy = TP + TN
TP + TN + FP + FN (8)
Precission = TP
FP+TP (9)
Recall = TP
FN+TP (10)
4.
RESULTS AND DISCUSSIONS
The data used for the mining process is the data that has been done cleaning and transforming. The data cleaning process is done to remove incomplete data and transformation process is done to convert data to the appropriate format in order to make a prediction. The mining process is done using decision tree C.45 algorithm and hybrid of decision tree C4.5 algorithm naïve bayes classifier that produces the model or rule to predict the study period and the predicate of graduate. Atributte of the dataset used in this research can be seen in Figure 3.
4.1
Prediction of Study Period
There are two categories of classes data used in the study to make predictions on the study period, on time if the study period of students is less than or equal to four years and late if the study period of students is more than four years.
Table 3. Partition of data
Partition Class label 1 Class label 2
70% 150 65
80% 172 43
90% 193 22
[image:5.595.72.257.80.151.2]Based on 215 available data, performed data partition 70%, 80% and 90%. The result of partition can be seen in Table 3. Then, calculation process is done by using C.45 algorithm. The results shown in Table 4.
Table 4. The highest attribute value Parti
tion
Gain max
co de
Entro py
Inf. gain
Split info
Gain ratio
70% GPA 1
0 0 0.828 1.7911 0.046
1 0.721 2 0.930 3 0.949 4 0.928 80% GPA
2
0 0 0.0864 1.759 0.049
1 0.979
2 0.998 3 0.936 4 0.337 90% GPA
1
0 0 0.0934 1.743 0.053
1 0.650 2 0.907 3 0.967 4 0.872
C.45 algorithm calculations are performed until all the attributes have a class so that it will form a decision tree. Based on the decision tree, then generated rule in predicting the study period of students. The following rule of prediction of study period is shown in Table 5.
Table 5. Rule of prediction study period Rule of prediction study period
1. IF (GPA_2 == 0) THEN > 4 YEAR (ID = 1) 2. IF (GPA_2 == 1) THEN > 4 YEAR (ID = 2)
3. IF (GPA_2 == 2 AND ENTRANCE == PPA) THEN 4 YEAR (ID = 4)
4. IF (GPA_2 == 2 AND ENTRANCE == SNMPTN) THEN > 4 YEAR (ID = 5)
5. IF (GPA _2 == 2 AND ENTRANCE == SPMU) THEN > 4 YEAR (ID = 6)
6. IF (GPA _2 == 3 AND GENDER == MALE AND MAJOR == SAINS) THEN > 4 YEAR (ID = 9) 7. IF (GPA _2 == 3 AND GENDER == MALE AND
MAJOR == SOCIAL) THEN 4 YEAR (ID = 10) 8. IF (GPA _2 == 3 AND GENDER == MALE AND
MAJOR == OTHER) THEN 4 YEAR (ID = 11) 9. IF (GPA _2 == 3 AND GENDER == FEMALE AND
IP_1 == 1 ) THEN > 4 YEAR (ID = 13)
10. IF (GPA _2 == 3 AND GENDER == FEMALE AND IP_1 == 2) THEN > 4 YEAR (ID = 14)
11. IF (GPA _2 == 3 AND GENDER == FEMALE AND IP_1 == 3 AND MAJOR == SAINS) THEN 4 YEAR (ID = 16)
12. IF (GPA _2 == 3 AND GENDER == FEMALE AND IP_1 == 3 AND MAJOR == SOCIAL) THEN > 4 YEAR (ID = 17)
13. IF (GPA _2 == 3 AND GENDER == FEMALE AND IP_1 == 3 AND MAJOR == OTHER) THEN > 4 YEAR (ID = 18)
14. IF (GPA _2 == 3 AND GENDER == FEMALE AND IP_1 == 4) THEN > 4 YEAR (ID = 19)
15. IF (GPA _2 == 4) THEN > 4 YEAR (ID = 20)
After the rule is formed then calculate the probability that exists in each rule using naïve bayes classifier algorithm with stages counting the number of classes or labels, calculate the number of cases equal to the same class, multiply all variables like equation 6 and choose the largest value of the calculation to serve as class like equation 7. The result of confusion matrix for this study shown in Table 6.
Table 6. Accuracy, Precision and Recall
Partition Accuracy Precision Recall
70% 60% 60.47% 74.29%
80% 65.12% 62.5% 86.96%
90% 72.73% 71.43% 83.33%
[image:5.595.53.285.217.551.2]4.2
Prediction of Gradute’s Predicate
In predicting the predicate of graduation students there are three categories of classes that is cum laude, very satisfactory and satisfactory. Stages to predict the graduation predicate equal to the study period. results pe The result of the hybrid decision tree c4.5 algorithm and naïve bayes classifier to predict graduation predicate can be seen in Table 7, 8, 9, and 10.Table 7. Partition of data
Partition Class label 1 Class label 2
70% 150 65
80% 172 43
90% 193 22
[image:5.595.325.520.647.717.2]Table 8. The highest attribute value Parti
tion
Gain max
co de
Entro py
Inf. gain
Split info
Gain ratio
70% GPA 1
0 0 0.1729 1.7911 0.0965
1 0.353 2 0.515 3 0.757 4 0.947 80% GPA
2
0 0 0.1707 1.759 0.097
1 0.235
2 0.305 3 0.510 4 0.642 90% GPA
1
0 0 0.1841 1.743 0.105
1 0.206 2 0.305 3 0.499 4 0.617
C.45 algorithm calculations are performed until all the attributes have a class so that it will form a decision tree. Based on the decision tree, then generated rule in predicting the predicate of graduation. The following rule of prediction of graduate’s predicate is shown in Table 9.
Table 9. Rule of prediction predicate graduation Rule of prediction predicate graduation
1. IF (GPA_2 == 0) THEN VERY SATISFACTORY (ID = 1)
2. IF (GPA_2 == 1) THEN VERY SATISFACTORY (ID = 2)
3. IF (GPA_2 == 2) THEN VERY SATISFACTORY (ID = 3)
4. IF (GPA_2 == 3 AND CITY == BENGKULU AND SCHOLARSHIP == NO AND GENDER == MALE
AND GPA_1 == 1) THEN VERY
SATISFACTORY (ID = 8)
5. IF (GPA_2 == 3 AND CITY == BENGKULU AND SCHOLARSHIP == NO AND GENDER == MALE
AND GPA_1 == 2) THEN VERY
SATISFACTORY (ID = 9)
6. IF (GPA_2 == 3 AND CITY == BENGKULU AND SCHOLARSHIP == NO AND GENDER == MALE
AND GPA_1 == 3) THEN VERY
SATISFACTORY (ID = 10)
7. IF (GPA_2 == 3 AND CITY == BENGKULU AND SCHOLARSHIP == NO AND GENDER == MALE
AND GPA_1 == 4) THEN VERY
SATISFACTORY (ID = 11)
8. IF (GPA_2 == 3 AND CITY == BENGKULU AND SCHOLARSHIP == NO AND GENDER == FEMALE AND GPA_1 == 1) THEN CUM LAUDE (ID = 13) 9. IF (GPA_2 == 3 AND CITY == BENGKULU AND
SCHOLARSHIP == NO AND GENDER == FEMALE AND GPA_1 == 2) THEN CUM LAUDE (ID = 14) 10. IF (GPA_2 == 3 AND CITY == BENGKULU AND
SCHOLARSHIP == NO AND GENDER == FEMALE AND GPA_1 == 3) THEN CUM LAUDE (ID = 15) 11. IF (GPA_2 == 3 AND CITY == BENGKULU AND
SCHOLARSHIP == NO AND GENDER == FEMALE AND GPA_1 == 4 AND ENTRANCE == PPA) THEN VERY SATISFACTORY (ID = 17) 12. IF (GPA_2 == 3 AND CITY == BENGKULU AND
SCHOLARSHIP == NO AND GENDER == FEMALE
AND GPA_1 == AND ENTRANCE ==
SNMPTN) THEN CUM LAUDE (ID = 18)
13. IF (GPA_2 == 3 AND CITY == BENGKULU AND SCHOLARSHIP == NO AND GENDER == FEMALE AND GPA_1 == 4 AND ENTRANCE == SPMU) THEN CUM LAUDE (ID = 19)
14. IF (GPA_2 == 3 AND CITY == BENGKULU AND
SCHOLARSHIP == YA) THEN VERY
SATISFACTORY (ID = 20)
15. IF (GPA_2 == 3 AND CITY == LUAR BENGKULU) THEN VERY SATISFACTORY (ID = 21)
16. IF (GPA_2 == 4) THEN VERY SATISFACTORY (ID = 22)
After the rule is formed then calculate the probability that exists in each rule using naïve bayes classifier algorithm with stages counting the number of classes or labels, calculate the number of cases equal to the same class, multiply all variables like equation 6 and choose the largest value of the calculation to serve as class like equation 7. The accuracy of the predictions predicate of graduation students with the data partition of 70%, 80% and 90% of the total data is 83.02%, 76.74% and 72.73%.
5.
CONCLUSION
Based on the results of research conducted of hybrid decision tree algorithm C4.5 and naïve bayes classifier with data partition of 70%, 80% and 90%. Data partition of 70% gives accuracy result of 60% to predict the study period and 83.02% to predict predicate of graduation, data partition of 80% gives accuracy result of 65.12 % to predict the study period and 76.74 % to predict predicate of graduation, and data partition of 90% gives accuracy result of 72.73 % to predict the study period and the same accuracy to predicate of graduation. We found that the data partition of 90% have high accuracy value compared to others. So the hybrid decision tree algorithm C4.5 and naive bayes classifier can be applied in predicting the study period and predicate of graduate student based on the pattern or model of the student data that has passed.
6.
REFERENCES
[image:6.595.54.282.72.414.2]34 Knowledge using Data Mining Techniques. International
Conference on Integrated Information (IC-ININFO) 147, 390-397.
[2] Gautam, R., and Pahuja, D.A. 2014. Review on Educational Data Mining. International Journal of Science and Research (IJSR) 3(11), 2929-2932.
[3] Abu, A.S. 2015. Educational Data Mining and Student’s Performance Prediction. International Journal of Advanced Computer Science and Applications (IJACSA) 7 (5), 212-220.
[4] Turban, E., J.E. Aronson and T.P. Liang. 2005. Decision Support System and Intelligent Systems 7th ed. Pearson Education
[5] Dole, L., and Rajurkar, J. 2014. A Decision Support System for Predicting Student Performance. International Journal of Innovative Research in Computer and Communication Engineering 2(12), 7232-7237
[6] Han, J., Kamber, M., and Pei, J. 2011. Data Mining : Concept and Techniques. Third Edition
[7] Pandey, U.K. and Pal, S. 2011. Data Mining: A prediction of performer or underperformer using classification. International Journal of Computer Science and Information Technologies (IJCSIT) 2 (2), 686- 690
[8] Veeraswamy, A., Alias, A, S., and Kannan, E. 2013. An Implementation of Efficient Datamining Classification Algorithm using NBTree. International Journal of Computer Applications 67(12), 26-29.
[9] Berry, J.A.M., and Linoff, S.G. 2004. Data Mining Techniques For Marketing, Sales, Customer Relationship Management,”United States of America.
[10] Ting, S. L., Ip, W. H., and Tsang, A. H.C. 2011. Is Naive Bayes a Good Classifier for Document Classification?. International Journal of Software Engineering and Its Applications 5(3), 37-46.
[11] Jadhav, D.S., and Channe, P.H. 2016. Comparative study of kNN, Naïve Bayes and Decision Tree Classification Techniques. International Journal of Science and Research (IJSR) 5(1), 1842-1845.
[12] Kohavi, R. 1996. Scaling up the accuracy of NaiveBayes classifiers: a decision-tree hybrid. International Conference on Knowledge Discovery and Data Mining, 202–207.
[13] Jiang, L., and Li, C. 2011. Scaling Up the Accuracy of Decision Tree Classifiers : A Naïve Bayes Combination. Journal of Computers 6 (7), 1325- 1331.