P. Fiener, F. Wilken, E. Aldana-Jague, D. Deumlich, J.A. G´omez, G. Guzm´an, R.A. Hardy, J.N. Quinton, M. Sommer, K. Van Oost, R. Wexler
PII: S0169-555X(17)30539-1
DOI: doi:10.1016/j.geomorph.2017.12.031
Reference: GEOMOR 6272
To appear in: Geomorphology
Received date: 14 August 2017 Revised date: 22 December 2017 Accepted date: 22 December 2017
Please cite this article as: Fiener, P., Wilken, F., Aldana-Jague, E., Deumlich, D., G´omez, J.A., Guzm´an, G., Hardy, R.A., Quinton, J.N., Sommer, M., Van Oost, K., Wexler, R., Uncertainties in assessing tillage erosion – How appropriate are our measuring tech-niques?, Geomorphology(2018), doi:10.1016/j.geomorph.2017.12.031
ACCEPTED MANUSCRIPT
Uncertainties in assessing tillage erosion
–
how appropriate are our measuring techniques?
Fiener1* P., Wilken1,2 F., Aldana-Jague3 E., Deumlich2 D., Gómez4 J.A., Guzmán4 G., Hardy5 R.A.,
Quinton5 J.N., Sommer2,6 M., Van Oost3 K., Wexler1 R.,
1 Institute of Geography, University Augsburg, Augsburg, Germany
2 Institute of Soil Landscape Research, Leibniz-Centre for Agricultural Landscape Research ZALF e.V.,
Müncheberg, Germany
3 Georges Lemaître Centre for Earth and Climate Research (TECLIM), Université Catholique de Louvain,
Louvain-la-Neuve, Belgium
4 Institute for Sustainable Agriculture, Spanish National Research Council, Department of Agronomy,
Córdoba, Spain
5 Lancaster Environment Centre, Lancaster University, Lancaster, UK
6 Institute of Earth and Environmental Sciences, University of Potsdam, Germany
* Corresponding author:
Alter Postweg 118
D-86159 Augsburg
ACCEPTED MANUSCRIPT
Abstract
Tillage erosion on arable land is a very important process leading to a net downslope movement of
soil and soil constitutes. Tillage erosion rates are commonly in the same order of magnitude as water
erosion rates and can be even higher, especially under highly mechanized agricultural soil
management. Despite its prevalence and magnitude, tillage erosion is still understudied compared to
water erosion. The goal of this study was to bring together experts using different techniques to
determine tillage erosion and use the different results to discuss and quantify uncertainties associated
with tillage erosion measurements. The study was performed in northeastern Germany on a 10 m by
50 m plot with a mean slope of 8%. Tillage erosion was determined after two sequences of seven
tillage operations. Two different micro-tracers (magnetic iron oxide mixed with soil and fluorescent
sand) and one macro-tracer (passive radio-frequency identification transponders (RFIDs), size: 4 x 22
mm) were used to directly determine soil fluxes. Moreover, tillage induced changes in topography
were measured for the entire plot with two different terrestrial laser scanners and an unmanned aerial
system for structure from motion topography analysis. Based on these elevation differences,
corresponding soil fluxes were calculated. The mean translocation distance of all techniques was 0.57
m per tillage pass, with a relatively wide range of mean soil translocation distances ranging from 0.39
to 0.72 m per pass. A benchmark technique could not be identified as all used techniques have
individual error sources, which could not be quantified. However, the translocation distances of the
macro-tracers used were consistently smaller than the translocation distances of the micro-tracers
(mean difference = -26±12%), which questions the widely used assumption of non-selective soil
transport via tillage operations. This study points out that tillage erosion measurements, carried out
under almost optimal conditions, are subject to major uncertainties that are far from negligible.
Keywords
ACCEPTED MANUSCRIPT
1.
Introduction
Soil erosion, especially on arable land, is a major environmental threat (Pimentel, 2006; Montanarella
et al., 2016) negatively affecting on-site soil properties and leading to substantial off-site damage
(Pimentel and Burgess, 2013). Moreover, lateral soil fluxes due to soil erosion are important
modulators of biogeochemical cycles within soils (Quinton et al., 2010; Doetterl et al., 2016) and also
substantially affect carbon and nutrient cycling in inland waters (Battin et al., 2009; Tranvik et al.,
2009). Soil erosion is most commonly understood as a process driven by water and wind that
redistributes soil within the terrestrial environment and transfers it to water courses. However, since
the early 1990s there has been a growing awareness of tillage as another important agent of soil
erosion and redistribution (Lindstrom et al., 1990; Govers et al., 1993; Lobb et al., 1995). Tillage on
sloping land leads to a net downslope displacement of soil, even if upslope and downslope tillage
directions are alternated (Govers et al., 1999). The major difference between tillage and water or wind
erosion is: (i) that tillage erosion occurs on a regular basis and is not driven by rare extreme events;
and (ii) that soil is redistributed entirely within fields and hence the process does not lead to off-site
damage. Tillage erosion typically occurs on convex slopes while soil accumulation takes place in
concavities (Govers et al., 1999). Hence, tillage and water erosion tends to take place at different
landscape positions: tillage mobilizes soil from hilltops that are minimally affected by water erosion
to the thalwegs where the highest rates of water erosion occur (Govers et al., 1994).
Various authors have shown that tillage erosion rates on arable land are at least in the same order of
magnitude as water erosion rates (Li et al., 1999; Van Oost et al., 2006) and might be even higher than
water erosion rates in drier or less convective storm dominated areas (Sommer et al., 2008). Despite
its prevalence and magnitude, tillage erosion is still understudied compared to water erosion: a
Web-of-Knowledge search for articles including the topic ‘water erosion’ or ‘tillage erosion’ resulted in
roughly ten times more results for ‘water erosion’ (260 vs. 2222; May 2017).
There are a variety of techniques presented in the literature for determining tillage erosion rates.
ACCEPTED MANUSCRIPT
directly determine the movement of soil. For tracing methods, tracers are either added before
performing individual or a series of tillage operations, or are in-situ tracers (e.g., 137Cs, Van Oost et al.,
2006) used to estimate long-term (decades to centuries) erosion rates. Tracers added before tillage
experiments have the advantage that tillage erosion can be isolated from long-term erosion, which is
always a combination of different erosion processes. The added tracers can be subdivided into
macro-tracers (diameter > 2 mm) and micro-macro-tracers (< 2 mm diameter soil particles or solutes absorbed by
soil colloids; subsequently this size-related micro- and macro-tracer definition is used). Micro-tracers
are applied as solutes sprayed onto soil, e.g., sodium chloride solution (Barneveld et al., 2009), or
mixed with natural soil and applied in trenches within the experimental plots, e.g., magnetic particles
(Zhang and Li, 2011) or chloride (often as KCL) (Lobb et al., 1999). The recovery of the tracer after the
experiment is either performed via soil sampling and/or if possible (e.g., in case of magnetic tracers)
with instruments measuring in-situ concentrations as used by Guzmán et al. (2013) at plot scale (but
for water erosion). Typical macro-tracers are coloured stones (Turkelboom et al., 1997; Thapa et al.,
1999; Kietzer, 2007; Tiessen et al., 2007; Zhang and Li, 2011; Logsdon, 2013) and different types of
metal, mostly aluminium cubes (Lindstrom et al., 1990; Van Oost et al., 2000b; Van Muysen et al.,
2002; De Alba et al., 2006; Barneveld et al., 2009), which are often individually numbered. In addition,
approaches that attempt to mimic soil with the intention of more realistically simulating soil
movement have been used (e.g., coloured aggregates, Dupin et al., 2009). The main advantage of
these macro-tracers is that in most cases the movement of individual, numbered particles can be
tracked. The main disadvantage is the very time-consuming application and especially the recovery of
the particles from the tilled soil layer.
The most widely used in-situ tracer to determine tillage (or total) erosion is 137Cs resulting from atom
bomb testing in the 1950s and 1960s (Quine et al., 1994; Govers et al., 1996; Quine et al., 1996; Van
Oost et al., 2003; Heckrath et al., 2005; Kietzer, 2007). Tillage erosion rates are estimated by
comparing the 137Cs activities at different slope positions and soil depths with those of reference sites
ACCEPTED MANUSCRIPT
naturally occurring tracers, e.g., Jordanova et al. (2011) used the natural magnetism in different soil
horizons to determine tillage erosion and deposition due to different depths of these horizons. The
advantage of using these kinds of natural tracers is that they represent long-term (decades to
centuries) erosion. Apart from technical issues with these techniques, their major disadvantage is that
they do not only measure tillage erosion because the pattern of tracer redistribution results from the
combination of various erosion types (Van Oost et al., 2006).
Techniques to estimate tillage erosion from changes in topography vary widely regarding their spatial
and temporal resolution. In several studies, the slight step in topography introduced by tillage at the
upslope boundary allowed the translocation of soil material to be determined due to tillage at the
upslope end of experimental plots (Turkelboom et al., 1997; Kimaro et al., 2005). This so-called step
method has been combined with the installation of soil collecting trenches at the downslope end of
the experimental plots (Turkelboom et al., 1997; Kimaro et al., 2005). Another method for the
determination of elevation differences is the determination of the soil depth above a known reference
point buried below the tillage depth, e.g., a concrete block as in Sadowski and Sorge (2005).
Photogrammetry was used by Vandaele et al. (1996) to carry out a longer-term and larger-scale
estimate of tillage erosion. They determined temporal patterns of elevation differences using
sequential stereoscopic aerial photographs from the Belgium loess belt (1947-1996). Their findings
underlined the importance of tillage erosion in the region, with the most severe surface lowering
occurring on hilltops and on hillslope convexities (Vandaele et al., 1996). More recently,
high-resolution digital elevation models (DEMs) in combination with digital aerial photographs have
improved long-term analysis of landscape changes (Deumlich et al., 2014) and recent advances in
image acquisition and software have, over the past decades, made novel measurement techniques
for geomorphological change detection affordable. Terrestrial laser scanners (TLS) and unmanned
aerial systems (UAS) together with structure from motion (SfM) techniques have been utilized in
several morphological change detection studies. On arable land the majority of these studies have
ACCEPTED MANUSCRIPT
2015; UAS: Peter et al., 2014; Eltner et al., 2015; Vinci et al., 2015). A recent study by Pineux et al.
(2017) investigated spatial elevation changes at the catchment scale, utilizing multi-temporal DEMs of
difference (DoD) using UAS-based SfM (UAS/SfM). However, as with natural tracers, the changes in
topography result from a combination of erosion processes, which need to be unravelled for tillage
erosion to be studied.
The results of tillage erosion studies (e.g., summarized in Van Oost et al., 2006) have been used to
develop and parameterize a number of tillage erosion models of different complexity. The most widely
used is a diffusion-type approach developed by Govers et al. (1994) that simulates tillage erosion as a
function of local slope and a tillage transport coefficient ktill. The tillage transport coefficient
generalizes several parameters (e.g., tillage speed, implement shape, soil physical properties) and
needs to be determined experimentally (e.g., Van Muysen et al., 2000; Kosmas et al., 2001; Heckrath
et al., 2006) or calculated from empirical relationships based on experiments (Van Muysen and
Govers, 2002; Van Muysen et al., 2002). An overview of different ktill values for different soils, tillage
depths, tillage directions, implements and speeds as well as plough layer bulk density is given in Van
Oost et al. (2006). However, our knowledge of the changes in ktill for different tillage techniques is very
limited (De Alba et al., 2004, 2006), and data regarding reduced tillage are especially rare (Van Oost
et al., 2006). Apart from models using the diffusion-type approach (e.g., WaTEM-SEDEM or
SPEROS-C: Van Oost et al., 2000a; Van Rompaey et al., 2001; Fiener et al., 2015; Van Oost et al., 2005b) there
are other, more complex models taking a larger number of parameters into account, e.g., tillage
direction, on-field objects, or complex field boundary effects (TILDA: Quine and Zhang, 2004; CATT:
Vanwalleghem et al., 2010; TELEM: Vieira and Dabney, 2011).
All commonly used tillage erosion models are developed and tested against tillage erosion
measurements. To represent individual tillage management practices, these models need to be
parameterized using experimentally determined tillage erosion rates. As indicated above, there is still
a lack in knowledge regarding model parameters, especially for the large number of different tillage
ACCEPTED MANUSCRIPT
parameters to simulate tillage erosion, we first need more information regarding the comparability of
different methods to determine tillage erosion. Experimentation is critical for determining the
parameters used to drive tillage erosion models. Therefore, it is vital to understand how the
experimental technique deployed influences the derivation of the model parameters and how these
differences translate into uncertainty surrounding predictions of tillage erosion. Here for the first time
we directly compare a range of methodologies for determining tillage erosion simultaneously in the
field. In addition, the work contributes new knowledge on the redistribution of soil in reduced tillage
systems and the potential of new tracer methods and topographic change techniques to quantify
tillage erosion rates.
The main aims of the study are (i) to quantify and compare tillage-induced soil redistribution using
different tracers and high-resolution topography measurements, and (ii) to quantify potential
differences between tillage erosion measuring techniques and discuss corresponding uncertainties for
soil erosion modelling resulting from different model parameters derived from different measuring
techniques.
2.
Materials and Methods
2.1.
Test site and experimental design
The experimental site was located near the village of Polßen (53.157° North; 13.962° East) about
80 km northeast of Berlin, Germany. It represents the typical topography of previously glaciated,
hummocky ground moraines. The soils in this region are strongly affected by landscape position.
Extremely eroded Calcaric Regosols (IUSS, 2015) are often located at the hilltops, whereas moderately
to strongly eroded Luvisols can be found along the slope, and colluvial, partly groundwater-influenced
soils are located in closed depressions (Sommer et al., 2008; Gerke et al., 2010). The subcontinental
climate in the area is characterized by a mean annual precipitation of approximately 500 mm a-1 and
a mean annual air temperature of 8.9°C (CLINO-1981-2010 for the meteorological stations Gruenow
and Angermuende). The region is intensively used for agricultural production with large fields (>20 ha)
ACCEPTED MANUSCRIPT
The experiment was performed between 03/04/16 and 08/04/16 on a convex upslope, located within
a large (~50 ha) field where winter wheat had been planted in autumn. Overall, an area of 15 m x 85 m
was prepared with an inner plot of 10 m x 50 m where the tracers were placed (Fig. 1). To homogenize
the soil and bury the germinated wheat on the test field, the plot was firstly tilled (03/04/16) with a
mouldboard plough to a depth of 0.25 m and then smoothed with a roller. Subsequently, the time
after initial plot preparation is referred to as t0. For the (reduced) tillage erosion experiment, two
sequences of seven downslope tillage operations consisting of a combination of a cultivator and a
roller were applied on 04/04/16 and 06/04/16. Subsequently, the time after the first and second
tillage sequence is referred to as t1 and t2, respectively. The cultivator, a Tiger 4 AS (HORSCH
Maschinen GmbH; Germany), consisted of a series of disks, tines and a roller, and tilled the soil to a
depth of 0.15 m without inverting but disrupting and mixing the soil. The tillage width of the cultivator
was 5 m, requiring three parallel downslope operations for one cultivation of the plot. The tractor
speed during tillage was approximately 6 km h-1. The roller had a width of 7.5 m, hence only two passes
were necessary for rolling the plot.
To monitor potential bulk density changes between t0 and t2, it was measured at 20 locations within
the inner plot (centre of 5 x 5 m rasters) at two depths (0.06 to 0.12 m and 0.18 to 0.24 m, respectively)
using Kopecky cylinders with a diameter of 0.08 m (volume 3.0 x 10⁻⁴ m3; Table 1).
2.2.
Tracer techniques
2.2.1. Micro-tracers
Magnetic iron oxide mixed with soil: A total of 312 kg of soil were mixed by serial dilutions
with magnetic iron oxide (subsequently referred as magnetic tracer) to increase the average
background concentration of soil by two orders of magnitude following the protocol of Guzmán et al.
(2010). Magnetic iron oxide mainly binds to the fine particle fraction (clay and silt) of the soil. The
mixture was applied at t0 in two trenches of 5.0 m x 0.35 m x 0.15 m (width perpendicular to slope,
ACCEPTED MANUSCRIPT
magnetic susceptibility at the beginning of the trial and after every tillage sequence (t1 and t2) was
measured using a MS2 sensor and a MS2D field probe (Bartington Instruments, UK). The device
penetrates the soil and integrates the signal with depth (10% of the signal is associated to a depth of
response of 0.06 m). A 0.90 m x 2.50 m grid (X, Y) was set out, with a more dense measuring grid (Y
distance: 1.25 m) at areas close to the initial tagged trenches. In order to calibrate the signal of the
field probe and allow conversion of the volumetric magnetic susceptibility into the mass of tracer, a
total of 18 random locations (including originally untagged areas and trenches) were sampled before
and after the first seven tillage passes at different depths (0-0.05 m, 0.05-0.10 m, and 0.10-0.15 m).
Their magnetic susceptibility was determined using a MS2B laboratory meter (Bartington®) as
described by Guzmán et al. (2013, 2015). Additionally, samples below the tillage layer (interval
0.15-0.20 m) were taken and analysed in the laboratory to evaluate and calibrate the field probe.
Fluorescent sand: The fluorescent tracer is commercially-available (Partrac Ltd; UK) and
consists of natural quartz particles (D50 = 70 µm) coated with a green fluorescent pigment. A Panasonic
Lumix GH4 camera was used with an orange 490 nm long pass filter (Knight Optical; UK) to enhance
the contrast between the soil and the tracer. Images were taken during the night or under darkened
conditions using an external LED light source (wavelength = 450 nm) with diffusing plates to produce
the fluorescent response. An intensity-based method, similar to that of Hardy et al. (2016) was utilized
to analyse the amount of tracer in the images. The intensity-based method used the numeric pixel
values from the green colour channel in the camera and differentiates between the background
intensity of the soil and the fluorescent tracer. Therefore, a reduction of the tracer concentration and
corresponding soil flux can be derived. At t1 a trench (3.0 x 0.4 x 0.15 m; Fig. 1) was filled with the
fluorescent tracer particles and the intensity-based method used to determine the tracer
redistribution was used at t2. Therefore, the visible surface intensity was determined and the depth
distribution of the tracer was measured in five 1.0 m x 0.2 m x 0.15 m trenches downslope from the
ACCEPTED MANUSCRIPT
2.2.2. Macro-tracer
Passive radio-frequency identification transponder: Commercially-available passive radio
frequency identification (RFID; HID Global, Germany) transponders were used together with a newly
designed prototype detection antenna (diameter 0.2 m; TECTUS Transponder Technology, Germany)
to tag soil movement along the inner plot. RIFD transponders (n=250), grouted in glass cylinders (4
mm x 22 mm; density = 2.3-2.5 g cm-3), were inserted to a soil depth of 0.075 m (mid tillage depth)
along five rows (spacing of rows and along slope 2 and 1 m, respectively; Fig. 1). At t1 and t2 the RIFD
transponders were re-located with the detection antenna, and the new location of the transponders
was determined with a total station (TS 06 plus R1000; Leica, Germany). Individual horizontal
displacement distances of the RFID transponders were calculated, both along and perpendicular to
the slope and tillage direction.
2.3.
Topographical techniques
2.3.1. Flagstones
Concrete flagstones (n=12; 0.25 m x 0.25 m x 0.03 m) were buried at t0 at different slope positions to
a mean depth of 0.42 m (Fig. 1). To relocate the flagstones after the tillage sequences, 3M™ Full-Range
Markers (3MTM, US; 0.38 m diameter) were buried underneath the flagstones. The markers allow for
a precise relocation of the flagstones after the tillage sequences by using a 3M™ Dynatel™ Locator
(detection range of about 2.5 m). The change in soil depths above the flagstones at the tillage
sequences t1 and t2 were measured with a 0.8 m long soil probe (steel needle). Measurements at t1
and t2 were corrected for changes in bulk density and hence surface elevation (see below).
2.3.2. Terrestrial laser scanning
Two different impulse wave terrestrial laser scanners (TLSs), a Leica (Scanstation C10; Leica, Germany)
and a Faro (Focus 3D; FARO, US), were used during the experiment. The Leica TLS has a lower spatial
ACCEPTED MANUSCRIPT
maximum scanning range of ~50 m. The Leica scans were performed from two locations at the upper
and lower end of the plot, while the Faro scans were taken from eight locations (four on each side of
the plot; Fig. 1). An average resolution depending on the distance between scanner and soil surface
of 4.4 x 10³ and 175 x 103 points per m2 was achieved for the Leica and Faro scanner, respectively. Each
scan took about 60 min with the Leica and about 12 min per scan with the Faro.
To georeference the scans, ten static black and white targets were equally distributed along plot
borders (Fig. 1) and independently located for each time step (t0 – t2) with a total station (TS 06 plus
R1000; Leica, Germany). The reference coordinates were used to register the TLS data into a single
merged point cloud for t0, t1, and t2 using the Leica software Cyclone 9 (Leica, Germany). Digital
elevation models of different grid size resolutions of the merged point clouds were processed in
CloudCompare 2.6.2 (cloudcompare.org). Subsequently, DoDs were calculated using R for statistical
computing 3.2.2 (R Development Core Team, Austria) and ArcGIS 10.4.1 (ESRI, US).
2.3.3. UAS/SfM
DEMs for the time steps t0 and t2 were calculated using the UAS/SfM technique. Therefore, a hybrid
Sony α5000 camera with a 20.1 MP (5456 x 3064 pixel) resolution was mounted on a gyro-stabilised
gimbal to a multirotor UAS platform. The UAS was a custom built hexacopter with a double rotor setup
on three arms (RcTakeOff, Belgium). The images (t0: n=99 images; t2: n=88 images) were recorded
from a nadir angle with a 16 mm focal length, f 3.5-5.6 OSS (equivalent 24 mm) and an average flight
elevation of 15 m. The TLS black and white targets were also used for referencing the SfM approach.
SfM calculations were carried out using PhotoScan Professional version 1.0.4 (Agisoft; Russia) and for
further point cloud processing, the software CloudCompare 2.6.2 (cloudcompare.org) was used. The
average point cloud density of the inner plot is 75 x 103 points per m2.
2.3.4. Determining change in topography
To calculate spatially distributed erosion and deposition from the different TLSs and UAS/SfM based
ACCEPTED MANUSCRIPT
experiment. Therefore, the measured changes in bulk density (t0 and t2; Table 1) were used to correct
for the settling of the soil surface during the experiment. It was assumed that the increase in bulk
density happened solely in the tillage layer between t0 and t1 as complete disruption was reached
after seven tillage operations and soil loosened during the pre-experimental mouldboard ploughing
to a depth of 0.25 m had settled. To validate this assumption, the mean elevation change over the
entire area affected by tillage was detected using the LEICA TLS data. Between t0 to t1 the measured
mean elevation difference was -20 mm, while between t1 and t2 the measured mean elevation
difference was negligible (< 0.1 mm), indicating no change in bulk density after t1. With this analysis
in mind, we used the measured mean bulk density change from the 20 locations (Table 1) between t0
and t2 to correct for the higher mean elevation of the plot at time t0, which resulted from lower bulk
density after mouldboard ploughing. Overall, the initial DEM (t0) was lowered by -13.2 mm.
2.4.
Calculating downslope soil flux from tracer movement and topography changes
To derive soil translocation distances and translocation rates from the different measuring techniques,
two approaches were applied. First, the soil translocation distance was derived directly from the
measured translocation distance of the respective tracer. The underlying assumptions here are that
the translocation distance of the tracer represents the translocation distance of the tilled soil layer,
the transport distances of the tracer are normally distributed (and hence, the mean transport distance
adequately represents its movement), and the tracers are more or less homogenously moved
throughout the depth profile of the tillage layer. The distribution of the tracer movement was tested
with all tracers and any depth dependence was tested according to depth profiles of the fluorescent
tracer along the slope and point measurements of the magnetic tracer. For the RFIDs a mean or
median translocation distance in the inner plot was calculated from the movement of all recovered
individual RFIDs; non-recovered RFIDs were assumed to travel the mean distance determined from
those that were recovered. Due to the large number of RFIDs distributed over the inner plot (Fig. 1),
ACCEPTED MANUSCRIPT
movement at different slope positions could be determined between t0 and t1 as well as t1 and t2. In
the case of the micro-tracers, the mean or median translocation distance was derived from the
distribution of the measured tracer intensity (magnetic susceptibility and fluorescence) downslope
the application trenches. It is important to note that in the case of magnetic susceptibility the bulk
magnetic susceptibility of the plough layer is measured, while in case of fluorescence only the
distribution of particles on the soil surface was determined. Compared to the RFIDs, it was only
possible to determine tracer movements from one (fluorescent tracer) and two locations (magnetic
tracer) and one time step. Based on the translocation distance, a mean soil translocation rate was
calculated following Eq. (1), while using the measured mean bulk density (Table 1) and a mean tillage
depths of 0.15 m (Van Oost et al., 2006):
Qs = ρb∙d ∙ D (1)
where Qs is the rate of soil translocation (kg m-1); ρb is the soil bulk density (kg m-3); d is the tillage
translocation distance (m), and D is the tillage depth (m).
Second, based on 0.5 m x 0.5 m raster DEMs determined from the three different topographical
techniques, the average translocation distance and soil translocation rate was calculated. The tillage
translocation started at the upslope end of the plot where the plough was inserted to the soil (plot
length location of about -12.5 m; Fig. 1). The calculation follows the conservation of mass and routes
the soil movement (the slope is subdivided into 1 m segments) from the source area down to the
lowest increment. Hence, even without a change in topography (in-flux equals out-flux), e.g., at a
mid-slope location, the soil translocation rate and distance can be derived using Eqs. (1) and (2). The tillage
translocation distance (d; m) at each 1 m segment i was calculated as:
𝑑𝑖 = 𝑉𝑖
𝑊∙ 𝐷 (2)
where V is the volume of soil loss (m³) from the tillage implement insertion to segment i, D is the
ACCEPTED MANUSCRIPT
3.
Results
3.1.
Translocation of tracers
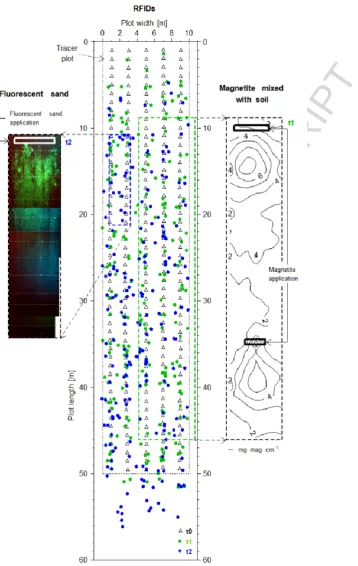
All the tracers showed a substantial downslope movement after 7 and 14 tillage passes (Fig. 2), with
a maximum movement of up to 18 m recorded for an individual RFID during one of the tillage
sequences. Across all the tracers, mean translocation distances per tillage pass had a substantial range
of 0.23 m to 0.71 m that depended on the tracer and slope position. Deriving a probability density
function of the mean tracer movement per tillage pass of all RFIDs between t0 and t1 (recovery rate
79%) as well as t1 and t2 (recovery rate 75%) indicates that a forward movement of RFIDs only
occurred parallel to the slope, while perpendicular to the slope the mean movement was close to zero
(Fig. 3). Hence, we subsequently only analysed the movement of tracers in the downslope direction.
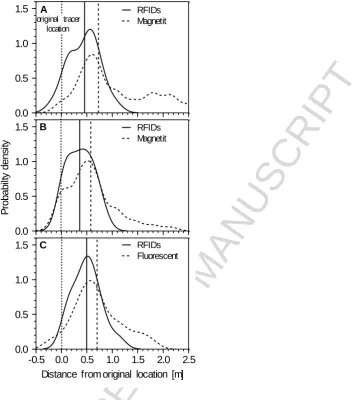
Comparing the movement of the RFIDs located around the micro-tracer trenches (maximum distance
upslope and downslope of application trench ≤ 5 m) with the movement of the magnetic tracer (two
trenches (Fig. 1); t0 to t1) and fluorescence tracer (one trench (Fig. 1); t1 to t2) indicates a substantial
difference in movement between the micro-tracer and the macro-tracer (Fig. 4; Table 2). In all cases
the micro-tracers exhibited a larger translocation distance, while their behaviour at different slope
positons was consistent, e.g., at the upper and lower trench of the magnetic tracer (Fig. 4A vs. Fig. 4B).
Larger transport distances were measured for all tracers on steeper slopes. The mean translocation
distance per tillage pass was 26 ± 12% less for the RFIDs compared to the micro-tracers (Table 2).
Measurements of the fluorescent tracer in five soil pits (0-0.15 m) downslope of the tracer application
trench at distances of 2.5, 5.0, 7.5, 10.0 and 12.5 m indicate some soil disturbance along the soil profile
(Fig. 5, Table 3) without an obvious systematic depth dependency. Hence, the surface luminescence
corresponds to the total movement of the tillage layer. The surface measurements of the fluorescent
tracer indicate that after seven tillage passes only 17% of the tracer was still located in the area above
the first soil pit (2.5 m below application trench). Hence, it was assumed that the depth measurements
represent 83% of all fluorescent material to be detected, while ignoring potentially small tracer
ACCEPTED MANUSCRIPT
amount of the fluorescent tracer and its mean translocation distance in each of the 0.01 m soil layers
could be calculated (Table 3). According to this calculation, no systematic depth dependency in
amount and translocation distance ranging from 0.68 to 0.83 m per tillage pass (mean±sd = 0.76±0.05
m) could be detected. This finding was corroborated through six magnetic tracer measurements at
three depths (0-0.05 m, 0.05-0.10 m, 0.10-0.15 m) downslope of the tracer application trenches (1.25
m, 2.5 m, 3.75 m, 5.0 m) that only showed slightly higher, but insignificant (p<0.05) values for the soil
movement in the upper topsoil layer (0-0.05 m). Both the fluorescent and the magnetic tracer indicate
that the different transport distances of the tracers cannot be explained from the different application
depths of 0-0.15 m in the case of the micro-tracers and 0.075 m in the case of the RFIDs.
3.2.
Change in topography
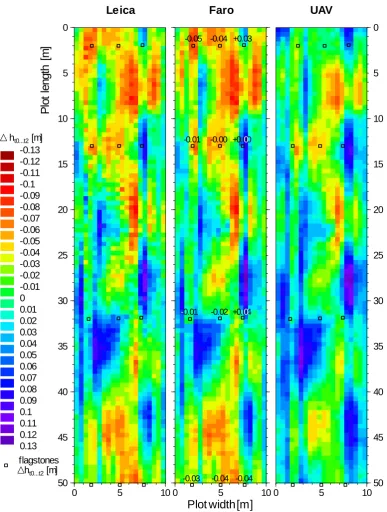
The DoDs between the start and the end of the experiment (t0 – t2) show good agreement in spatially
distributed erosion and deposition patterns for all measuring techniques (Fig. 6). The absolute
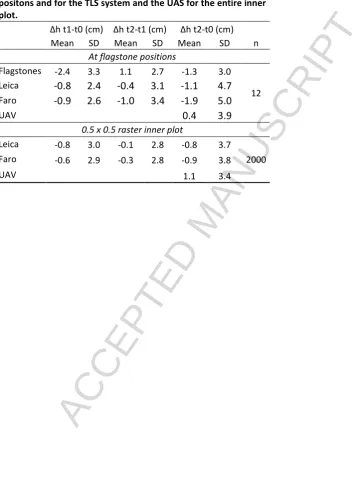
elevation differences between the TLS systems at the time t0 to t1 accurately match for both the
flagstone positions and the gridded DEM data (Table 4). The TLS systems indicate a substantially lower
loss for the tillage sequence t1 to t2 compared to t0 to t1. However, for tillage sequence t1 to t2 the
Leica shows a lower soil loss than the Faro. In contrast to the TLS systems, the UAV/SfM show a net
soil gain within the inner plot between t0 and t2 (Table 4). The flagstone point measurements for t0
to t2 are in the same range as the TLS measurements, but show major deviations compared to the TLS
systems for the individual tillage sequences (Table 4).
3.3.
Soil translocation distances and translocation rates
Based on Eq. (1), the depth-independence of tracer movement (Table 3) and the close to normal
distribution of tracer movement (Figs. 3 and 4), we calculated the mean soil translocation distance
and rate per tillage pass for each original tracer location. For the florescent and the magnetic tracers
soil translation was determined for the upper and lower trench locations at the tillage sequence t0-t1
and t1-t2, respectively (Fig. 7). For the RFIDs, soil translocation was calculated for ten 5 m segments
ACCEPTED MANUSCRIPT
the slope soil translocation was derived in 1 m segments from the DoDs of the TSL systems using Eq.
(1) and Eq. (2). Soil translocation was not calculated for the UAS/SfM system, as the point of
implement insertion was unfortunately not recorded.
The soil translocation distances and rates from the different techniques showed some consistencies
but also some substantial differences (Fig. 7). The Faro and the micro-tracer distances and rates were
very similar and additionally the Faro translocation did not substantially change between t0-t1 and
t1-t2. In contrast, the Leica translocation showed some substantial difference between t0-t1 and t1-2,
with a difference in mean translocation rates of 80.6 kg m-1 per pass (difference of t1-t2 relative to
t0-t1 is 47%). As expected from the tracer flux calculations, the RFID-based soil translocation distances
and rates were substantially smaller than those of the micro-tracers, and were closest to the Leica
derived data for the tillage sequence between t1-t2. Comparing all data (both tillage sequences) for
the areas around the tracer trenches (between 7.5 m and 17.5 m and 32.5 m and 42.5 m) indicates,
that the different techniques resulted in a substantial variability of derived soil translocation rates
ranging from 105.6 to 170.4 kg m-1 per pass at the upper trench area and from 80.9 to 175.6 kg m-1
per pass for the lower trench area. Even more extreme differences can be recognized for the
downslope end of the inner plot where four-fold differences between RFID-based and Leica-based
translocation rates were found (t0-t1; Fig. 7).
4.
Discussion
4.1.
Implications of measurement uncertainties
A number of studies were performed over the last two decades reporting different soil translocation
rates for different soils (properties, conditions) and tillage techniques (tillage speed, direction, depth,
type of implement, etc.) determined from a variety of measurement techniques (e.g., Van Muysen et
al., 2002; Van Oost and Govers, 2006; Kietzer, 2007; Tiessen et al., 2007; Barneveld et al., 2009;
Logsdon, 2013). Van Oost et al. (2006) provide a comprehensive overview of results acquired until
2006. From these data it is obvious that there are substantial differences for similar tillage categories
ACCEPTED MANUSCRIPT
soil properties (bulk density) and in tillage technique (especially tillage depths, tillage speed, and
tillage direction; Lobb et al., 2001; Van Oost et al., 2006). However, uncertainties associated to
different measuring techniques used in different studies were not systematically analysed.
Assuming that the results of the individual techniques presented in this study, which were carried out
under optimal conditions and the use of high precision equipment, are of comparable quality to those
referred to by Van Oost et al. (2006), our work indicates that substantial uncertainties in estimated
tillage erosion rates not only result from different experimental set-ups but also from the different
techniques used. For those areas of the tested slope where the different techniques can be directly
compared we could identify substantial differences in soil translocation rates per tillage pass (upper
trench: 106-170 kg m-1 per pass, difference = 60%; lower trench: 81-176 kg m-1 per pass, difference =
118%; Fig. 7). Comparing the mean translocation rate from six measuring techniques that represent
three basic types of tillage erosion determination (micro-tracer, macro-tracer, topography) and two
tillage sequences against the corresponding individual measurements, ranges from an
underestimation of -32.8 kg m-1 (-21.6%) to an overestimation of 41.3 kg m-1 (33.6%). When using
experimental results to parametrize tillage erosion models (Van Oost et al., 2005a; Dlugoß et al.,
2012), these measurement uncertainties need to be added to uncertainties based on the transfer of
measured tillage erosion rates from one test site to another modelling region. The relevance of this
uncertainty was recently illustrated by Wilken et al. (2017), who coupled a water and tillage erosion
model and a soil organic carbon model to analyse erosion-induced carbon (C) fluxes in a small
catchment. Varying tillage erosion by ±50% substantially changed the modelled erosion-induced C
balance of the catchment, which was overall more important for the C balance than water erosion
(Wilken et al., 2017). In general, it can be concluded that tillage erosion measurement uncertainties
of the magnitude found in this study can substantially affect the results of studies dealing with
erosion-induced changes in soil properties of arable land.
ACCEPTED MANUSCRIPT
Micro-tracer methods disturb the natural soil structure because a trench is filled with artificial or
artificially manipulated soil material. This causes uncertainties regarding the transport and mixing
properties of the tracer particles into the natural soil structure. If applied in a trench, the fluorescent
tracer concentration can reach the detectable saturation level. As a consequence, the peak
concentration might not be accurately determined and causes uncertainties in the translocation
calculation, which is based on fluorescence intensity proportions. RFID macro-tracers enable fast
tracking of individual particles at distinct slope positions without soil disturbance (e.g., soil sieving as
applied to traditional macro-tracers). The experiment showed 26±12% lower translocation distances
determined by the stone-sized RFID macro-tracers compared to soil-sized micro-tracers (Table 2). This
calls the widely used assumption that tillage erosion is a non-selective process into question. A few
studies already speculated about different transport distances between soil and stone sized tracers
(Barneveld et al., 2009; Dupin et al., 2009; Logsdon, 2013), but did not investigate this in detail.
Nevertheless, it is likely that a potential grain size selectivity of tillage erosion is affected by soil
conditions and tillage implement type. Soil cohesiveness may control whether the soil is disrupted and
selectively mixed or homogenously transported in large clods that encapsulate stone-sized particles.
Due to a series of tillage operations under rather dry conditions, the soil was highly disrupted during
the experiment, which might have supported selectivity compared to a single tillage operation and
hence the 14 applied tillage operations are not identical to 14 yr of cultivation. Furthermore, a
potential grain size selectivity of tillage translocation is likely to be tillage implement specific as some
implements are designed to invert topsoil and not to disrupt and entirely mix it.
High-resolution measurements of topography change can identify spatial movement of the tillage
layer and are not affected by potential grain size selective transport. However, the technique needs
to be corrected for elevation changes related to bulk density differences that are subject to spatial
variations (Gifford and Roderick, 2003). Because TLS and UAS/SfM devices are based on optical
techniques, information gaps occur behind objects that produce shaded areas. Due to soil surface
ACCEPTED MANUSCRIPT
incidence angle of the laser beam becomes smaller (Fig. 8). Because of the linear interpolation of
shaded areas, the TLS scanners systematically overestimate the elevation of remote scan positions. As
illustrated in Fig. 8, this effect increases with increasing surface roughness. Owing to the smooth rolled
soil surface (about 2.5 cm roughness height), the wheel tracks were the most problematic element in
this study. This is especially true as the depths of the wheel tracks were deeper at t0 because of a very
loose soil following the pre-experimental mouldboard ploughing and rolling. The consequence was
that the long range scans with the Leica, from two positions only (Fig. 1), could only partly scan into
the wheel tracks, and therefore potentially underestimates deposition in these wheel tracks between
t0 and t1, and hence overestimates erosion rates. In general, an image acquisition from nadir that
prevents flat incidence angles is a major advantage of the UAS/SfM technique (Fig. 8).
To unify different TLS scenes or photogrammetric images, georeferenced ground control points (GCPs)
are required. On arable land, plane surfaces or clear structures are not present and scene overlay
depends on GCPs. As TLS devices operate from a static position on ground, fewer GCPs are required
compared to the moving UAV/SfM. Hence, a dense network of GCPs is of key importance for an
UAV/SfM approach on arable land to measure tillage erosion. In this experiment the UAS/SfM
approach lead to similar patters but showed an elevation offset compared to the TLS measurements.
This somewhat unsatisfactory result might be improved using more GCPs or by adding stable linear
features along the measuring plot, which improved SfM processing. However, it was challenging to
detect small (< 1 cm) changes in topography if these changes had not resulted from changes in linear
features (e.g., erosion rills), which makes change detection easier. Similar problems in detecting
changes on non-linear soil erosion features were shown in the UAS/SfM study of Pineux et al. (2017).
Based on our experiment it was not possible to determine one measuring technique as benchmark
because all applied techniques are subject to different technique-specific error sources. However, it
is clear that using only one technique to determine tillage erosion, as done in the majority of studies,
ACCEPTED MANUSCRIPT
Apart from technical issues of determining tillage erosion, our experiment underlines the importance
of tillage erosion as a driver of geomorphological dynamics. It needs to be emphasized that the applied
tillage speed of 6 km h-1 and depth of 15 cm was substantially lower compared to the typical regional
management practice with a tillage speed of 15 km h-1 and depth of 20 cm. Nevertheless, after 14
applied tillage operations, substantial morphological differences of approximately ±10 cm (Fig. 6) were
determined. Tillage erosion successively levels out the landscape morphology as convex hilltops are
lowered and concave depressions are filled (Sommer et al., 2008). Therefore, tillage transports soil
from convex areas with almost no water erosion (e.g., hilltops) to concave areas of concentrated flow
and highest water erosion (Van Oost et al., 2006). Hence, on the one hand tillage removes features
produced by water erosion like ephemeral gullies, but on the other hand actively supports sediment
delivery by water erosion. In hummocky regions, long-term tillage erosion has an important impact
on catchment topography, hydrology and soil properties.
5.
Conclusion
Under controlled conditions, different tillage translocation measuring techniques (three tracers and
three topographical methods) were applied in a macro-plot experiment with two tillage sequences
each consisting of seven tillage operations. The different techniques produce a relatively wide range
of soil translocation rates for the same slope positions, with deviations from the mean of all
measurements between -32.8 kg m-1 (-21.6%) and 41.3 kg m-1 (33.6%). This large
measurement-induced variation indicates substantial uncertainties in determining tillage erosion, which points to
the need to utilise more than one method in tillage erosion studies. This associated uncertainty should
be taken into account especially when using the results of tillage erosion experiments to parameterize
models.
No benchmark result could be obtained because all of the techniques used have potential sources of
error that could not be individually quantified. However, the consistently smaller translocation
ACCEPTED MANUSCRIPT
translocation distance of the two micro-tracers, questions the widely held assumption of non-selective
transport and homogenous movement of the tillage layer by management operations. At least under
dry and disrupted soil conditions, as tested in this experiment, macro-tracers may not accurately
represent the flux of soil-sized particles.
Compared to water erosion, we still lack standardized measurements and the overall number of
measurements for different management practices is relatively small, which makes a reasonable
model parametrisation challenging. Overall, this study emphasizes that tillage erosion measurements,
carried out under almost optimal conditions, are subject to major uncertainties that need to be
carefully considered in soil erosion studies.
Acknowledgments
The study was logistically supported by Institute of Soil Landscape Research at the Leibniz-Centre for
Agricultural Landscape Research ZALF e.V. in Müncheberg, Germany. The study was supported by the
Terrestrial Environmental Observatory TERENO-Northeast of the Helmholtz Association. The
Fluorescent tracer work was funded by a joint U.K. Natural Environment Research Council – Analytical
Chemistry Trust Fund studentship (Ne/J017795/1). Special thanks goes to Gernot Verch and Norbert
Wypler. Moreover, we want to acknowledge the land owner Dietrich von Wedel allowing us to
perform the experiment on his field and gave us insights regarding the regular on-site farming
operations. Last but not least we gratefully acknowledge Karl Schneider from University Cologne, who
ACCEPTED MANUSCRIPT
References
Barneveld, R., Bruggeman, A., Sterk, G., Turkelboom, F., 2009. Comparison of two methods for
quantification of tillage erosion rates in olive orchards of north-west Syria. Soil Till. Res. 103(1),
105-112.
Battin, T.J., Luyssaert, S., Kaplan, L.A., Aufdenkampe, A.K., Richter, A., Tranvik, L.J., 2009. The
boundless carbon cycle. Nat. Geosci. 2, 598-601.
d'Oleire-Oltmanns, S., Marzolff, I., Peter, K.D., Ries, J.B., 2012. Unmanned aerial vehicle (UAV) for
monitoring soil erosion in Morocco. Remote Sensing 4(11), 3390-3416.
De Alba, S., Lindstrom, M., Schumacher, T.E., 2004. Soil landscape evolution due to soil redistribution
by tillage: a new conceptual model of soil catena evolution in agricultural landscapes. Catena
58, 77-100.
De Alba, S., Borselli, L., Torri, D., Pellegrini, S., Bazzoffi, P., 2006. Assessment of tillage erosion by
mouldboard plough in Tuscany (Italy). Soil Till. Res. 85(1-2), 123-142.
Deumlich, D., Dannowski, R., Völker, L., 2014. Historische und aktuelle Geoinfromation - Grundlage in
der Agarlandschaftsforschung Zeitschrift für Geodäsie, Geoinformation und
Landmanagement 139, 329-341.
Dlugoß, V., Fiener, P., Van Oost, K., Schneider, K., 2012. Model based analysis of lateral and vertical
soil C fluxes induced by soil redistribution processes in a small agricultural watershed. Earth
Surf. Process. Landf. 37(2), 193-208.
Doetterl, S., Berhe, A.A., Nadeu, E., Wang, Z., Sommer, M., Fiener, P., 2016. Erosion, deposition and
soil carbon: A review on process-level controls, experimental tools and models to address C
cycling in dynamic landscapes. Earth-Sci. Rev. 154, 102-122.
Dupin, B., de Rouw, A., Phantahvong, K.B., Valentin, C., 2009. Assessment of tillage erosion rates on
steep slopes in northern Laos. Soil Till. Res. 103(1), 119-126.
Eltner, A., Baumgart, P., 2015. Accuracy constraints of terrestrial Lidar data for soil erosion
measurement: Application to a Mediterranean field plot. Geomorphology 245, 243-254.
Eltner, A., Baumgart, P., Maas, H.G., Faust, D., 2015. Multi-temporal UAV data for automatic
measurement of rill and interrill erosion on loess soil. Earth Surf. Process. Landf. 40(6),
741-755.
Fiener, P., Dlugoß, V., Van Oost, K., 2015. Erosion-induced carbon redistribution, burial and
ACCEPTED MANUSCRIPT
Gerke, H.H., Koszinski, S., Kalettka, T., Sommer, M., 2010. Structures and hydrologic function of soil
landscapes with kettle holes using an integrated hydropedological approach. J. Hydrol.
393(1-2), 123-132.
Gifford, R.M., Roderick, M.L., 2003. Soil carbon stocks and bulk density: spatial or cumulative mass
coordinates as a basis of expression? Global Change Biol. 9(11), 1507-1514.
Govers, G., Quine, T.A., Walling, D.E., 1993. The effect of water erosion and tillage movement on
hillslope profile development: a comparison of field observation and model results. In:
Wicherek, S., (Ed.), Farm land erosion in temperate plains environments and hills. Elsevier,
Amsterdam, pp. 285-300.
Govers, G., Vandaele, K., Desmet, P., Poesen, J., Bunte, K., 1994. The role of tillage in soil redistribution
on hillslopes. Eur. J. Soil Sci. 45, 469-478.
Govers, G., Quine, T.A., Desmet, P.J.J., Walling, D.E., 1996. The relative contribution of soil tillage and
overland flow erosion to soil redistribution on agricultural land. Earth Surf. Process. Landf. 21,
929-946.
Govers, G., Lobb, D.A., Quine, T.A., 1999. Preface - Tillage erosion and translocation: emergence of a
new paradigm in soil erosion research. Soil Till. Res. 51(3-4), 167-174.
Guzmán, G., Barrón, V., Gómez, J.A., 2010. Evaluation of magnetic iron oxides as sediment tracers in
water erosion experiments. Catena 82(2), 126-133.
Guzmán, G., Vanderlinden, K., Giráldez, J.V., Gómez, J.A., 2013. Assessment of Spatial Variability in
Water Erosion Rates in an Olive Orchard at Plot Scale using a Magnetic Iron Oxide Tracer. Soil
Sci. Soc. Am. J. 77(2), 350-361.
Guzmán, G., Laguna, A., Cañasveras, J.C., Boulal, H., Barrón, V., Gómez-Macpherson, H., Giráldez, J.V.,
Gómez, J.A., 2015. Study of sediment movement in an irrigated maize-cotton system
combining rainfall simulations, sediment tracers and soil erosion models. J. Hydrol. 524,
227-242.
Hardy, R.A., Pates, J.M., Quinton, J.N., Coogan, M.P., 2016. A novel fluorescent tracer for real-time
tracing of clay transport over soil surfaces. Catena 141, 39-45.
Heckrath, G., Djurhuus, J., Quine, T.A., Van Oost, K., Govers, G., Zhang, Y., 2005. Tillage erosion and its
effect on soil properties and crop yield in Denmark. J. Environ. Qual. 34(1), 312-324.
Heckrath, G., Halekoh, U., Djurhuus, J., Govers, G., 2006. The effect of tillage direction on soil
redistribution by mouldboard ploughing on complex slopes. Soil Till. Res. 88(1-2), 225-241.
IUSS, 2015. World reference base for soil resources 2014. Update 2015. International soil classification
system for naming soils and creating legends for soil maps. World Soil Resources Reports No.
ACCEPTED MANUSCRIPT
Jordanova, D., Jordanova, N., Atanasova, A., Tsacheva, T., Petrov, P., 2011. Soil tillage erosion
estimated by using magnetism of soils - A case study from Bulgaria. Environ. Monit. Assess.
183(1-4), 381-394.
Kietzer, B., 2007. Soil translocation by tillage erosion in ground moraine landscapes of NE Germany,
147 pp.
Kimaro, D.N., Deckers, J.A., Poesen, J., Kilasara, M., Msanya, B.M., 2005. Short and medium term
assessment of tillage erosion in the Uluguru Mountains, Tanzania. Soil Till. Res. 81(1), 97-108.
Kosmas, C., Gerontidis, S., Marathianou, M., Detsis, B., Zafiriou, T., Muysen, W.N., Govers, G., Quine,
T.A., Van Oost, K., 2001. The effects of tillage displaced soil on soil properties and wheat
biomass. Soil Till. Res. 58(1-2), 31-44.
Li, Y., Frielinghaus, M., Govers, G., Van Oost, K., Bork, H.R., Friedland, E.M., Schäfer, H., 1999. Spatial
and temporal variations of tillage erosion at a moraine catena in NE Germany, 2nd
International Symposium on Tillage Erosion and Tillage Translocation, Leuven, pp. 42.
Lindstrom, M.J., Nelson, W.W., Schumacher, T.E., Lemme, G.D., 1990. Soil movement by tillage as
affected by slope. Soil and Tillage Research 17(3), 255-264.
Lobb, D.A., Kachanoski, R.G., Miller, M.H., 1995. Tillage translocation and tillage erosion on shoulder
slope landscape positions measured using CS-137 as a tracer. Can. J. Soil Sci. 75(2), 211-218.
Lobb, D.A., Kachanoski, R.G., Miller, M.H., 1999. Tillage translocation and tillage erosion in the complex
upland landscapes of southwestern Ontario, Canada. Soil and Tillage Research 51, 189-209.
Lobb, D.A., Quine, T.A., Govers, G., Heckrath, G.J., 2001. Comparison of methods used to calculate
tillage translocation using plot-tracers. J. Soil Water Conserv. 56(4), 321-328.
Logsdon, S.D., 2013. Depth dependence of chisel plow tillage erosion. Soil Till. Res. 128, 119-124.
Montanarella, L., Pennock, D.J., McKenzie, N., Badraoui, M., Chude, V., Baptista, I., Mamo, T.,
Yemefack, M., Singh Aulakh, M., Yagi, K., Young Hong, S., Vijarnsorn, P., Zhang, G.L., Arrouays,
D., Black, H., Krasilnikov, P., Sobocká, J., Alegre, J., Henriquez, C.R., de Lourdes
Mendonça-Santos, M., Taboada, M., Espinosa-Victoria, D., AlShankiti, A., AlaviPanah, S.K., Elsheikh,
E.A.E.M., Hempel, J., Camps Arbestain, M., Nachtergaele, F., Vargas, R., 2016. World's soils are
under threat. SOIL 2(1), 79-82.
Peter, K.D., d'Oleire-Oltmanns, S., Ries, J.B., Marzolff, I., Hssaine, A.A., 2014. Soil erosion in gully
catchments affected by land-levelling measures in the Souss Basin, Morocco, analysed by
rainfall simulation and UAV remote sensing data. Catena 113, 24-40.
Pimentel, D., 2006. Soil erosion: A food and environmental threat. Environ. Dev. Sustainability 8,
119-137.
ACCEPTED MANUSCRIPT
Pineux, N., Lisein, J., Swerts, G., Bielders, C.L., Lejeune, P., Colinet, G., Degre, A., 2017. Can DEM time
series produced by UAV be used to quantify diffuse erosion in an agricultural watershed?
Geomorphology 280, 122-136.
Quine, T.A., Desmet, P.J.J., Govers, G., Vandaele, K., Walling, D.E., 1994. A comparison of the roles of
tillage and water erosion in landform development and sediment export on agricultural land
near Leuven, Belgium. IAHS Publications 224, 77-86.
Quine, T.A., Walling, D.E., Govers, G., 1996. Simulation of radiocaesium redistribution on cultivated
hillslopes using a mass-balance model: An aid to process interpretation and erosion rate
estimation. In: Anderson, M.G., Brooks, S.M., (Eds.), Advances in hillslope processes. Wiley &
Sons, Chichester, pp. 561-588.
Quine, T.A., Zhang, Y., 2004. Re-defining tillage erosion: quantifying intensity-direction relationships
for complex terrain. 2. Revised mouldboard erosion model. Soil Use and Management 20(2),
124-132.
Quinton, J.N., Govers, G., Van Oost, K., Bardgett, R.D., 2010. The impact of agricultural soil erosion on
biogeochemical cycling. Nat. Geosci. 3, 311-314.
Sadowski, H., Sorge, B., 2005. Der Normalhöhenpunkt von 1912 - Datumspunkt des DHHN 2012?
Vermessung Brandenburg, 2/2005, 31-39.
Sommer, M., Gerke, H.H., Deumlich, D., 2008. Modelling soil landscape genesis — A “time split”
approach for hummocky agricultural landscapes. Geoderma 145(3-4), 480-493.
Thapa, B.B., Cassel, D.K., Garrity, D.P., 1999. Assessment of tillage erosion rates on steepland Oxisols
in the humid tropics using granite rocks. Soil Till. Res. 51(3-4), 233-243.
Tiessen, K.H.D., Mehuys, G.R., Lobb, D.A., Rees, H.W., 2007. Tillage erosion within potato production
systems in Atlantic Canada - I. Measurement of tillage translocation by implements used in
seedbed preparation. Soil Till. Res. 95(1-2), 308-319.
Tranvik, L.J., Downing, J.A., Cotner, J.B., Loiselle, S.A., Striegl, R.G., Ballatore, T.J., Dillon, P., Finlay, K.,
Fortino, K., Knoll, L.B., Kortelainen, P.L., Kutser, T., Larsen, S., Laurion, I., Leech, D.M.,
McCallister, S.L., McKnight, D.M., Melack, J.M., Overholt, E., Porter, J.A., Prairie, Y., Renwick,
W.H., Roland, F., Sherman, B.S., Schindler, D.W., Sobek, S., Tremblay, A., Vanni, M.J.,
Verschoor, A.M., Von Wachenfeldt, E., Weyhenmeyer, G.A., 2009. Lakes and reservoirs as
regulators of carbon cycling and climate. Limnol. Oceanogr. 54(6), 2298-2314.
Turkelboom, F., Poesen, J., Ohler, I., VanKeer, K., Ongprasert, S., Vlassak, K., 1997. Assessment of
tillage erosion rates on steep slopes in northern Thailand. Catena 29(1), 29-44.
Van Muysen, W., Govers, G., 2002. Soil displacement and tillage erosion during secondary tillage
ACCEPTED MANUSCRIPT
Van Muysen, W., Govers, G., Van Oost, K., Van Rompaey, A., 2000. The effect of tillage depth, tillage
speed, and soil condition on chisel tillage erosivity. J. Soil Water Conserv. 55(3), 2-11.
Van Muysen, W., Govers, G., Van Oost, K., 2002. Identification of important factors in the process of
tillage erosion: The case of mouldboard tillage. Soil Till. Res. 65(1), 77-93.
Van Oost, K., Govers, G., 2006. Tillage erosion. In: Boardman, J., Poesen, J., (Eds.), Soil erosion in
Europe. Wiley, Chichester, pp. 599-608.
Van Oost, K., Govers, G., Desmet, P., 2000a. Evaluating the effects of changes in landscape structure
on soil erosion by water and tillage. Landscape Ecol. 15, 577-589.
Van Oost, K., Govers, G., Van Muysen, W., Quine, T.A., 2000b. Modelling translocation and dispersion
of soil constituents by tillage on sloping land. Soil Sci. Soc. Am. J. 64(5), 1733-1739.
Van Oost, K., Govers, G., Van Muysen, W., 2003. A process-based conversion model for caesium-137
derived erosion rates on agricultural land: An integrated spatial approach. Earth Surf. Process.
Landf. 28(2), 187-207.
Van Oost, K., Govers, G., Quine, T., Heckarth, G., Olesen, J.E., De Gryze, S., Merckx, R., 2005a.
Landscape-scale modeling of carbon cycling under the impact of soil redistribution: The role
of tillage erosion. Global Biogeochem. Cycles, 19(4), 1-13.
Van Oost, K., Quine, T., Govers, G., Heckrath, G., 2005b. Modeling soil erosion induced carbon fluxes
between soil and atmosphere on agricultural land using SPEROS-C. In: Roose, E.J., Lal, R.,
Feller, C., Barthes, B., Stewart B.A., (Eds.), Advances in soil science. Soil erosion and carbon
dynamics. CRC Press, Boca Raton, pp. 37-51.
Van Oost, K., Govers, G., De Alba, S., Quine, T.A., 2006. Tillage erosion: a review of controlling factors
and implications for soil quality. Prog. Phys. Geog. 30, 443-466.
Van Rompaey, A.J.J., Verstraeten, G., Van Oost, K., Govers, G., Poesen, J., 2001. Modelling mean
annual sediment yield using a distributed approach. Earth Surf. Process. Landf. 26(11),
1221-1236.
Vandaele, K., Vanommeslaeghe, J., Muylaert, R., Govers, G., 1996. Monitoring soil redistribution
patterns using sequential aerial photographs. Earth Surf. Process. Landf. 21, 353-364.
Vanwalleghem, T., Jimenez-Hornero, F.J., Giraldez, J.V., Laguna, A., 2010. Simulation of long-term soil
redistribution by tillage using a cellular automata model. Earth Surface Processes and
Landforms 35(7), 761-770.
Vieira, D.A.N., Dabney, S.M., 2011. Modeling edge effects of tillage erosion. Soil Till. Res. 111(2),
197-207.
Vinci, A., Brigante, R., Todisco, F., Mannocchi, F., Radicioni, F., 2015. Measuring rill erosion by laser
ACCEPTED MANUSCRIPT
Wilken, F., Sommer, M., Van Oost, K., Bens, O., Fiener, P., 2017. Process-oriented modelling to identify
main drivers of erosion-induced carbon fluxes. SOIL 3(2), 83-94.
Zhang, J.H., Li, F.C., 2011. An appraisal of two tracer methods for estimating tillage erosion rates under
ACCEPTED MANUSCRIPT
List of figures:Fig. 1. Topography of the test site, location of tracers at the beginning of the experiment (t0), TLS
scan positions, and location of georeferenced targets for TLS and UAV/SfM measurements.
Fig. 2. Translocation of individual RFIDs (t0 to t1 and t1 to t2); translocation of magnetic tracer mixed
with soil from trenches 1 and 2 (t0 to t1) given as lines of equal magnetisation (mg mag m-3);
translocation of fluorescent sand from trench 3 (t1 to t2) given as mosaic of colour images taken
under an external light-source.
Fig. 3. Mean and median translocation of all RIFDs per tillage pass (t0-t1 and t1-t2); in slope direction
(A) and perpendicular to slope direction (B).
Fig. 4. Comparison of mean translocation distance per tillage pass of different tracers. RFIDs vs.
magnetic tracer translocation from upper (A) and lower trench (B) between t0 and t1. RIFDs vs.
fluorescent tracer translocation from upper trench between t1 and t2; It is important to note that in
case of the RFIDs slope segments (maximum distance upslope and downslope of micro-tracer
application trenches ≤ 5 m) are compared against tracers distributed along small trenches (see Fig.
1). The solid and dashed vertical line shows the average transport distance of the RFIDs and the
corresponding micro-tracer, respectively.
Fig. 5. Soil depth-dependent translocation distance of fluorescent sand during seven tillage passes;
translocation from upper trench between t1 and t2.
Fig. 6. Difference in topography between t2 and t0 for all measuring systems. High-resolution data
degraded to 0.5 m x 0.5 m. Elevation differences derived from the flagstone technique are given in
the mid (Faro) DoD map.
Fig. 7. Average soil translocation distance and rate derived from the different methods used
between t0 and t1 and t1 and t2; movement of tracers it is indicated at the location where the
tracers were originally applied; it is important to note that the movement of RFIDs is calculated in
ACCEPTED MANUSCRIPT
Fig. 8. Schematic figure of scan angle and shadowing effect of the laser scanners compared to
ACCEPTED MANUSCRIPT
List of tables:Table 1. Bulk density and stone content measured after preparation of the plot with one-time
ploughing to a depth of 0.25 m (t0) and at end of the experiment after 14-times tillage with the field
cultivator to a depth of 0.15 cm (t2).
Table 2. Mean tracer translocation at magnetic tracer trenches and at fluorescent trench according
to probability density functions.
Table 3. Mean soil translocation distance per tillage pass in different 1-cm soil layers and relative
translocation amount in each of the 1-cm soil layer.
Table 4. Comparison of changes in topography at the flagstone positons and for the TLS system and
ACCEPTED MANUSCRIPT
Figures
Fig. 1. Topography of the test site, location of tracers at the beginning of the experiment (t0), TLS scan
positions, and location of georeferenced targets for TLS and UAV/SfM measurements.
0 5 10
-15 -10 -5 0 5 10 15 20 25 30 35 40 45 50 55 60 65 70 75
Plot width [m]
P lo t le n g th [m ] -10 -5 0 1-m contour RFIDs Inner plot insertion
of tillageim plement
endof tilla ge
Tracer locationsat t0
ACCEPTED MANUSCRIPT
Fig. 2. Translocation of individual RFIDs (t0 to t1 and t1 to t2); translocation of magnetic tracer mixed with soil
from trenches 1 and 2 (t0 to t1) given as lines of equal magnetisation (mg mag m-3); translocation of
ACCEPTED MANUSCRIPT
Fig. 3. Mean and median translocation of all RIFDsper tillage pass (t0-t1 and t1-t2); in slope direction
(A) and perpendicular to slope direction (B).
original tracer location
-0.5 0.0 0.5 1.0 1.5
0.0 0.2 0.4 0.6 0.8 1.0 1.2 P ro b a b ilt y d e n s ity A m ed ia n m ea n
-0.5 0.0 0.5
0.0 0.5 1.0 1.5 2.0 2.5 3.0
Distance from original location [m]
ACCEPTED MANUSCRIPT
Fig. 4. Comparison of mean translocation distance per tillage pass of different tracers. RFIDs vs. magnetic
tracer translocation from upper (A) and lower trench (B) between t0 and t1. RIFDs vs. fluorescent tracer
translocation from upper trench between t1 and t2; It is important to note that in case of the RFIDs slope
segments (max. distance upslope and downslope of micro-tracer application trenches ≤ 5 m) are compared
against tracers distributed along small trenches (see Fig. 1). The solid and dashed vertical line shows the
average transport distance of the RFIDs and the corresponding micro-tracer, respectively. original tracer location 0.0 0.5 1.0 1.5 RFIDs Magnetit A B 0.0 0.5 1.0 1.5 RFIDs Magnetit
-0.5 0.0 0.5 1.0 1.5 2.0 2.5
0.0 0.5 1.0 1.5
Distance from original location [m]
P ro b a b ilt y d e n sit y RFIDs Fluorescent C
ACCEPTED MANUSCRIPT
Fig. 5. Soil depths-dependent translocation distance of fluorescent sand during seven tillage passes;
translocation from upper trench between t1 and t2.
2.5 5 7.5 10 12.5
-15 -10 -5 0
Translocation from applicaton site in slope direction [m]
S
o
il
d
e
p
th
s
[c
m
]