Studying the Interrelationship amongst Barriers for
Implementation of Technology based Educational
Techniques in Teaching Institutions in India
Arnav Jain
Techture Structures Private Limited
University of Delhi, India
Remica Aggarwal
School of Business, University of Petroleum & Energy Studies
Dehradun, India
P. C. Jha
Department of Operational Research, Faculty of Mathematical
Sciences University of Delhi, India
ABSTRACT
The education sector in India has witnessed a paradigm shift in recent years . This research focuses on studying various barriers to the implementation of technology based constructivist learning and various barriers for its successful implementation in developing countries like India . Further , the interrelationship amongst them have been discussed with the help of Interpretive Structural Modelling Methodology .
Keywords
ISM methodology; technology education ; educational sector
1.
INTRODUCTION
The education sector in India has witnessed a paradigm shift in recent times. Once operated primarily as a philanthropic or a nation building activity, it has since transformed into a sector in its own right. With an extensive network of more than 1.4 million schools and more than 850 universities and 40,000 higher education institutes , it is definitely a growing and developing sector. This sector can be broadly classified into two categories, public sector and private sector. Both the sectors comprises of preschool , primary and higher education system followed by higher education segment which includes professional and technical education. Vocational training , coaching classes and distance education through e – learning platforms is another segment of this sector.
In recent years , Indian government has taken many steps to reform the education sector taking it to new heights of recognition. Some of the popular ones are Pradhan Mantri Yuva Yojna (2016)1 for providing entrepreneurship education and training by Ministry of Skill Development and Entrepreneurship (MSDE); SANKALP & STRIVE schemes in (2017)1 to fulfil the skill India mission . Revitalising Infrastructure and Systems in Education (RISE) by 2022 was announced in union budget 2018-19 with an outlay of Rs 1 lakh crore for four years. The Credit Guarantee Fund for Education Loans Scheme and the Central Sector Interest Subsidy Scheme with a financial outlay of Rs. 6,600 crore for period from 2017-18 to 2019-20 is another scheme launched by government. The scheme is expected to provide education loans to 10 lakh students during this period. Government expenditure on education rose from 3.3% of GDP in financial year 2005 to 4% in financial year 2012; declined to a low of 2.4% in financial year 2016 and since then inched up to reach 2.7% in financial year 2018. To provide further thrust, the government initiated a centrally-sponsored scheme – ICT at Schools during 2004 through its Sarva Shiksha Abhiyan (SSA) program and the schooling norms recommended by Central Advisory Board of Education (CABE) through its report on Universal Secondary Education in 20052. ICT in the
education context refers not only to the utilization of hardware devices and software applications for imparting education but also involves development and management of course content, application of web based content repositories, creation of interactive forums through the internet and satellite communication etc. [5]
In traditional learning and teaching , teacher instructs learners and student ask questions based on the teachers directives. Content is given to the students in groups , learners are placed in classes according to their age and the content and context is age specific3,4 . The content is presented in a personal manner and students can have access to the educator immediately. There are no stumbling blocks such as the absence of access to technology or a lack of motivation by the learners which hampers the effectiveness of the knowledge transfer process. Recently the communication and information age has led to an increase use of mediums such as laptops, iphones and ipods etc. [[1]-[4]] This has promoted the education in situations main stream programmes which prepare learners to be compatible with the use of technology in their curriculum. Previous use of technology focused on hardwares such as television and was lacking the integration of technology and content related to curriculum. The role of educational technology gained importance in the Indian education System with the emphasis of National Policy on Education, 1986 with the use of computer related technology for improving the quality of education. Learning mediums that have been used includes virtual learning environment (web based)[6] ; online learning (web based); blended learning (combined education technology and traditional teaching); ubiquitous learning (computer based) and mobile learning (pagers, laptops and Wireless Local Area Network). The mediums of learning identified are computer-based; video conferencing; satellite, webcast and CD-ROM ([7]).
This form of learning also known as constructivist learning or technology based learning. The content and progress is based on individual needs as in the case of using a personal computer. Learners interact across age groups either via peer learning or individual learning and due to technology student have greater interactivity and engagement ([8]) through chat groups and social mediums. This types of technology based learning can occur at any time.
allow for greater effectiveness of this type of education and ensure that it makes a meaningful contribution in the future and becomes used to embitter learning.
The paper is organized as follows. Section 2 deals with literature review. Section 3 explains the ISM methodology. Section 4 applies the methodology to the case example and section 5 presents the managerial implications.
2.
LITERATURE REVIEW
The educator barriers associated with learning include how responsive the system is towards academic input, learning support availability, cultural implications impact on the attendance of learners, an information overload due to the internet, plagiarism and security threats are on the increase and not all subjects can be taught via learning such as Humanities and Arts. [9] divides the barriers into extrinsic barriers which pertains to organizational barriers and intrinsic barriers which refers to individuals such as teachers and student barriers. [10] question how credible education technology is in comparison to teacher-student traditional teaching and learning. The paper holds the view that education technology can enhance current teaching and learning if integrated into the curriculum effectively.
List of barriers
[ [7]-[24]]1. Cost implications (CI)
2. Disruptive technology (DT)
3. Lack of favorable organizational structure (LFOS)
4. Cheating and Plagiarism (CP)
5. Employee / teacher resistance to adoption of technology (TRAT)
6. Differing level of computer literacy (DLCL)
7. Lack of motivation due to poor skills (LMPS)
8. Lack of social awareness (LSA)
9. Misalignment between teachers and administrators (MBTA)
10. Lack of appropriate infrastructure (LAI)
11. Absence of accommodating disadvantage individuals (AADI)
12. High start-up costs and initial investments (HII)
13. Integration and technical support problems (ITSP)
14. Lack of proven results and credibility (LPR)
15. Paucity of professional development and trainingprogramme (PPDTP)
16. Lack of class time / Less class time (LCT)
3.
INTERPRETIVE STRUCTURAL
MODELLING METHODOLOGY
Suggested by [25] , the technique has been used widely to develop a map of the relationships between the many
elements in the form of a hierarchy graph. Group’s judgement decides whether and how the items are related. ISM works with the following steps. It deals with the identification of elements, which are relevant to the decision maker’s problems and issues. Thereafter, it establish the contextual relationship between elements and with respect to which pairs of elements will be examine. A structural self-interaction matrix (SSIM) may be developed afterwards between two variables i.e. i and j. It establishes the “Lead to” relationship between criteria. Four symbols viz. V, A , X & O are used for establishing the relationships. SSIM may be further used to develop an initial reachability matrix which has all values in binary form. Rule of transitivity is usually checked at this stage. After removing the transitivity, final reachability matrix will form. Afterwards, the reachability set and antecedent set for each criterion and for each element can be obtained from the final reachability matrix. After that a level partition matrix can be obtained based on establishing the precedence relationships and arranging the elements in a topological order. A Mic-Mac analysis can be performed which categorize the variables as per the driving and dependence power in to autonomous, dependent, driver and linkage category. Finally a diagraph can be obtained.
4.
DEVELOPMENT OF ISM MODEL
In this section, ISM model is developed for studying the interrelationships amongst various barriers associated with the adoption of various technologies by Indian education sector . Based on the sixteen important criteria , ISM methodology is applied to study their interrelationships.
4.1
Construction of Structural Self
-Interaction Matrix (SSIM)
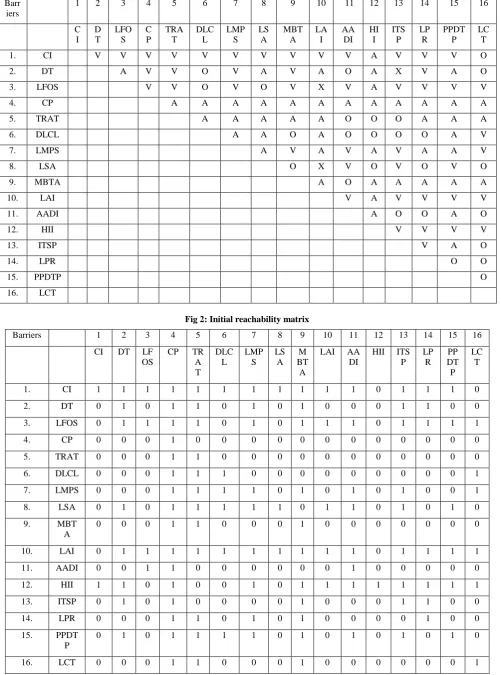
This matrix gives the pair-wise relationship between two variables i.e. i and j based on VAXO. SSIM has been presented below in Fig 1. A total of 16 barriers are considered viz. Cost implications (CI) ; Disruptive technology (DT); Lack of favourable organisational structure for technology(LFOS) ; Cheating and Plagiarism (CP); Employee / teacher resistance to adoption of technology (TRAT); Differing level of computer literacy (DLCL); Lack of motivation due to poor skills (LMPS); Lack of social awareness (LSA); Misalignment between teachers and administrators (MBTA); Lack of appropriate infrastructure (LAI); Absence of accommodating disadvantage individuals (AADI); High start-up costs and initial investments (HII); Integration and technical support problems (ITSP); Lack of proven results and credibility (LPR) ; Paucity of professional development and training programme (PPDTP); Lack of class time / Less class time (LCT).
Fig 1: SSIM matrix for pair wise relationship amongst barriers
Barr iers
1 2 3 4 5 6 7 8 9 10 11 12 13 14 15 16
C I
D T
LFO S
C P
TRA T
DLC L
LMP S
LS A
MBT A
LA I
AA DI
HI I
ITS P
LP R
PPDT P
LC T
1. CI V V V V V V V V V V A V V V O
2. DT A V V O V A V A O A X V A O
3. LFOS V V O V O V X V A V V V V
4. CP A A A A A A A A A A A A
5. TRAT A A A A A O O O A A A
6. DLCL A A O A O O O O A V
7. LMPS A V A V A V A A V
8. LSA O X V O V O V O
9. MBTA A O A A A A A
10. LAI V A V V V V
11. AADI A O O A O
12. HII V V V V
13. ITSP V A O
14. LPR O O
15. PPDTP O
16. LCT
Fig 2: Initial reachability matrix
Barriers 1 2 3 4 5 6 7 8 9 10 11 12 13 14 15 16
CI DT LF OS
CP TR A T
DLC L
LMP S
LS A
M BT A
LAI AA DI
HII ITS P
LP R
PP DT P
LC T
1. CI 1 1 1 1 1 1 1 1 1 1 1 0 1 1 1 0
2. DT 0 1 0 1 1 0 1 0 1 0 0 0 1 1 0 0
3. LFOS 0 1 1 1 1 0 1 0 1 1 1 0 1 1 1 1
4. CP 0 0 0 1 0 0 0 0 0 0 0 0 0 0 0 0
5. TRAT 0 0 0 1 1 0 0 0 0 0 0 0 0 0 0 0
6. DLCL 0 0 0 1 1 1 0 0 0 0 0 0 0 0 0 1
7. LMPS 0 0 0 1 1 1 1 0 1 0 1 0 1 0 0 1
8. LSA 0 1 0 1 1 1 1 1 0 1 1 0 1 0 1 0
9. MBT
A
0 0 0 1 1 0 0 0 1 0 0 0 0 0 0 0
10. LAI 0 1 1 1 1 1 1 1 1 1 1 0 1 1 1 1
11. AADI 0 0 1 1 0 0 0 0 0 0 1 0 0 0 0 0
12. HII 1 1 0 1 0 0 1 0 1 1 1 1 1 1 1 1
13. ITSP 0 1 0 1 0 0 0 0 1 0 0 0 1 1 0 0
14. LPR 0 0 0 1 1 0 1 0 1 0 0 0 0 1 0 0
15. PPDT
P
0 1 0 1 1 1 1 0 1 0 1 0 1 0 1 0
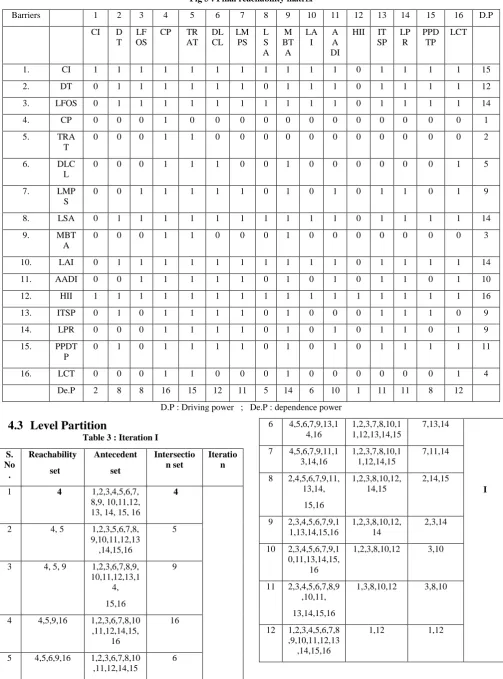
Fig 3 : Final reachability matrix
Barriers 1 2 3 4 5 6 7 8 9 10 11 12 13 14 15 16 D.P
CI D
T LF OS
CP TR AT
DL CL
LM PS
L S A
M BT A
LA I
A A DI
HII IT SP
LP R
PPD TP
LCT
1. CI 1 1 1 1 1 1 1 1 1 1 1 0 1 1 1 1 15
2. DT 0 1 1 1 1 1 1 0 1 1 1 0 1 1 1 1 12
3. LFOS 0 1 1 1 1 1 1 1 1 1 1 0 1 1 1 1 14
4. CP 0 0 0 1 0 0 0 0 0 0 0 0 0 0 0 0 1
5. TRA
T
0 0 0 1 1 0 0 0 0 0 0 0 0 0 0 0 2
6. DLC
L
0 0 0 1 1 1 0 0 1 0 0 0 0 0 0 1 5
7. LMP
S
0 0 1 1 1 1 1 0 1 0 1 0 1 1 0 1 9
8. LSA 0 1 1 1 1 1 1 1 1 1 1 0 1 1 1 1 14
9. MBT
A
0 0 0 1 1 0 0 0 1 0 0 0 0 0 0 0 3
10. LAI 0 1 1 1 1 1 1 1 1 1 1 0 1 1 1 1 14
11. AADI 0 0 1 1 1 1 1 0 1 0 1 0 1 1 0 1 10
12. HII 1 1 1 1 1 1 1 1 1 1 1 1 1 1 1 1 16
13. ITSP 0 1 0 1 1 1 1 0 1 0 0 0 1 1 1 0 9
14. LPR 0 0 0 1 1 1 1 0 1 0 1 0 1 1 0 1 9
15. PPDT
P
0 1 0 1 1 1 1 0 1 0 1 0 1 1 1 1 11
16. LCT 0 0 0 1 1 0 0 0 1 0 0 0 0 0 0 1 4
De.P 2 8 8 16 15 12 11 5 14 6 10 1 11 11 8 12
D.P : Driving power ; De.P : dependence power
4.3
Level Partition
Table 3 : Iteration I
S. No .
Reachability
set
Antecedent
set
Intersectio n set
Iteratio n
1 4 1,2,3,4,5,6,7, 8,9, 10,11,12, 13, 14, 15, 16
4
2 4, 5 1,2,3,5,6,7,8, 9,10,11,12,13 ,14,15,16
5
3 4, 5, 9 1,2,3,6,7,8,9, 10,11,12,13,1
4,
15,16
9
4 4,5,9,16 1,2,3,6,7,8,10 ,11,12,14,15,
16
16
5 4,5,6,9,16 1,2,3,6,7,8,10 ,11,12,14,15
6
6 4,5,6,7,9,13,1 4,16
1,2,3,7,8,10,1 1,12,13,14,15
7,13,14
I
7 4,5,6,7,9,11,1 3,14,16
1,2,3,7,8,10,1 1,12,14,15
7,11,14
8 2,4,5,6,7,9,11, 13,14,
15,16
1,2,3,8,10,12, 14,15
2,14,15
9 2,3,4,5,6,7,9,1 1,13,14,15,16
1,2,3,8,10,12, 14
2,3,14
10 2,3,4,5,6,7,9,1 0,11,13,14,15,
16
1,2,3,8,10,12 3,10
11 2,3,4,5,6,7,8,9 ,10,11,
13,14,15,16
1,3,8,10,12 3,8,10
12 1,2,3,4,5,6,7,8 ,9,10,11,12,13 ,14,15,16
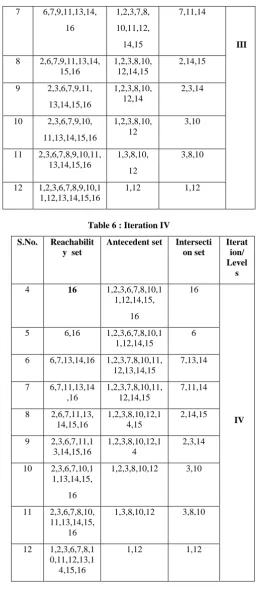
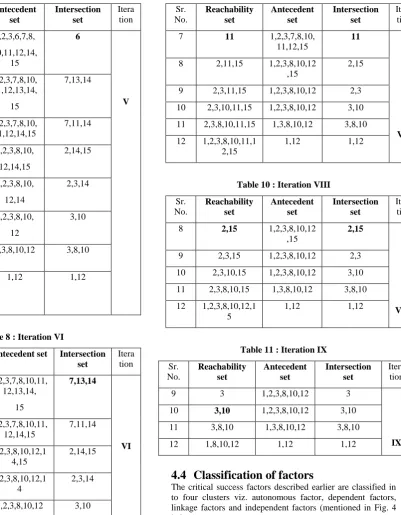
From the final reachability matrix, reachability and final antecedent set for each factor are found. The element for which the reachability and intersection sets are same are the top-level element in the ISM hierarchy. After the identification of top level element, it is separated out from the other elements and the process continues for next level of elements. Reachability set, antecedent set, intersection set along with different level for elements have been shown below in table V to table XI.
Table 4 : Iteration II
S.No .
Reachability set
Antecedent set Intersection set
Itera tion 2 5 1,2,3,5,6,7,8,9,
10,11,12,13, 14,15,16
5
II
3 5, 9 1,2,3,6,7,8,9, 10,11,12,13, 14,15,16
9
4 5,9,16 1,2,3,6,7,8,10,1 1,12,14,15, 16
16
5 5,6,9,16 1,2,3,6,7,8,10,1 1,12,14,15
6
6 5,6,7,9,13,14 ,16
1,2,3,7,8,10,11, 12,13,14,15
7,13,14
7 5,6,7,9,11,13 ,14,16
1,2,3,7,8,10,11, 12,14,15
7,11,14
8 2,5,6,7,9,11, 13,14, 15,16
1,2,3,8,10,12,1 4,15
2,14,15
9 2,3,5,6,7,9,1 1,13,14, 15,16
1,2,3,8,10,12,1 4
2,3,14
10 2,3,5,6,7,9,1 0,11,13, 14,15,16
1,2,3,8,10,12 3,10
11 2,3,5,6,7,8,9, 10,11, 13,14,15,16
1,3,8,10,12 3,8,10
12 1,2,3,5,6,7,8, 9,10,11, 12,13,14,15, 16
1,12 1
Table 5 : Iteration III
Sr. No.
Reachability set Anteceden t set
Intersection set
Itera tion
3 9 1,2,3,6,7,8,
9,10,11,12, 13,14,
15,16
9
4 9,16 1,2,3,6,7,8,
10,11,12,1 4,15,16
16
5 6,9,16 1,2,3,6,7,8,
10,11,12,1 4,15
6
6 6,7,9,13,14,16 1,2,3,7,8,
10,11,12,
13,14,15
7,13,14
7 6,7,9,11,13,14,
16
1,2,3,7,8,
10,11,12,
14,15
7,11,14
III
8 2,6,7,9,11,13,14, 15,16
1,2,3,8,10, 12,14,15
2,14,15
9 2,3,6,7,9,11,
13,14,15,16
1,2,3,8,10, 12,14
2,3,14
10 2,3,6,7,9,10,
11,13,14,15,16
1,2,3,8,10, 12
3,10
11 2,3,6,7,8,9,10,11, 13,14,15,16
1,3,8,10,
12
3,8,10
12 1,2,3,6,7,8,9,10,1 1,12,13,14,15,16
1,12 1,12
Table 6 : Iteration IV
S.No. Reachabilit y set
Antecedent set Intersecti on set
Iterat ion/ Level s
4 16 1,2,3,6,7,8,10,1
1,12,14,15,
16
16
IV
5 6,16 1,2,3,6,7,8,10,1 1,12,14,15
6
6 6,7,13,14,16 1,2,3,7,8,10,11, 12,13,14,15
7,13,14
7 6,7,11,13,14 ,16
1,2,3,7,8,10,11, 12,14,15
7,11,14
8 2,6,7,11,13, 14,15,16
1,2,3,8,10,12,1 4,15
2,14,15
9 2,3,6,7,11,1 3,14,15,16
1,2,3,8,10,12,1 4
2,3,14
10 2,3,6,7,10,1 1,13,14,15,
16
1,2,3,8,10,12 3,10
11 2,3,6,7,8,10, 11,13,14,15,
16
1,3,8,10,12 3,8,10
12 1,2,3,6,7,8,1 0,11,12,13,1 4,15,16
Table 7 : Iteration V
Sr. No.
Reachability set
Antecedent set
Intersection set
Itera tion
5 6 1,2,3,6,7,8,
10,11,12,14, 15
6
V
6 6,7,13,14 1,2,3,7,8,10, 11,12,13,14,
15
7,13,14
7 6,7,11,13,14 1,2,3,7,8,10, 11,12,14,15
7,11,14
8 2,6,7,11,13,14, 15
1,2,3,8,10,
12,14,15
2,14,15
9 2,3,6,7,11,13,1 4,15
1,2,3,8,10,
12,14
2,3,14
10 2,3,6,7,10,11,1 3,14,15
1,2,3,8,10,
12
3,10
11 2,3,6,7,8,10,11 ,13,14,15
1,3,8,10,12 3,8,10
12 1,2,3,6,7,8,10, 11,12,13,14,
15
1,12 1,12
Table 8 : Iteration VI
Sr. No.
Reachability set
Antecedent set Intersection set
Itera tion
6 7,13,14 1,2,3,7,8,10,11, 12,13,14,
15
7,13,14
VI
7 7,11,13,14 1,2,3,7,8,10,11, 12,14,15
7,11,14
8 2,7,11,13,14,1 5
1,2,3,8,10,12,1 4,15
2,14,15
9 2,3,7,11,13,14, 15
1,2,3,8,10,12,1 4
2,3,14
10 2,3,7,10,11,13, 14,15
1,2,3,8,10,12 3,10
11 2,3,7,8,10,11,1 3,14,15
1,3,8,10,12 3,8,10
12 1,2,3,7,8,10,11 ,12,13,14,
15
1,12 1,12
Table 9 : Iteration VII
Sr. No.
Reachability set
Antecedent set
Intersection set
Itera tion
7 11 1,2,3,7,8,10,
11,12,15
11
VII
8 2,11,15 1,2,3,8,10,12 ,15
2,15
9 2,3,11,15 1,2,3,8,10,12 2,3
10 2,3,10,11,15 1,2,3,8,10,12 3,10
11 2,3,8,10,11,15 1,3,8,10,12 3,8,10
12 1,2,3,8,10,11,1 2,15
[image:6.595.144.546.85.601.2]1,12 1,12
Table 10 : Iteration VIII
Sr. No.
Reachability set
Antecedent set
Intersection set
Itera tion
8 2,15 1,2,3,8,10,12 ,15
2,15
VIII
9 2,3,15 1,2,3,8,10,12 2,3
10 2,3,10,15 1,2,3,8,10,12 3,10
11 2,3,8,10,15 1,3,8,10,12 3,8,10
12 1,2,3,8,10,12,1 5
1,12 1,12
Table 11 : Iteration IX
Sr. No.
Reachability set
Antecedent set
Intersection set
Itera tion
9 3 1,2,3,8,10,12 3
IX
10 3,10 1,2,3,8,10,12 3,10
11 3,8,10 1,3,8,10,12 3,8,10
12 1,8,10,12 1,12 1,12
4.4
Classification of factors
Fig . 4: Driving power and dependence diagram
4.5
ISM model
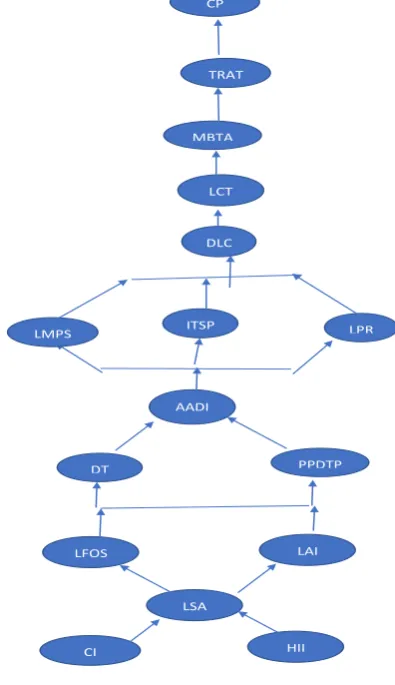
An ISM model is developed ( as shown in fig. 5 below ) after arranging the elements as per their interaction or dependence relationships.
Fig 5: ISM diagraph
5.
MANAGERIAL IMPLICATIONS AND
CONCLUSIONS
This section focuses on various implications of use internet computing technologies and enterprise resource planning in developing countries scenario.
Implementation technology such as ICT results in tremendous improvisation in traditional teaching . This makes them expert in pedagogical design which will ensure that the potential of technology use in education become recognised .
Education technology can impact on certain teachings and learning objectives, if it is aligned to the aims of the education experience [23].
Further the present study tries to identify the impact of usage on the individual's panoptic empowerment and individual performance. Managers should have the goal of not just making use of the system but to make employees satisfied with using the system, to improve their performance, and also to empower them to make decisions.
Studying the impact of ICT is usually a cross-sectional study. The influence of some factors on the intention of using information technology might vary at different stages in the implementation process.
Impact of six sigma on education sector: Managers could also consider implementing business improvement program such as six sigma to meet the global competition ([24], [25]). However its implementation amongst SMEs is a herculean task indeed. The issues faced by SMEs in manufacturing sector for adoption of Six Sigma should be studied and addressed to bring awareness and interest in this breakthrough methodology by the SMEs. For example , it is observed that successful implementation of six sigma is that it can be utilized in multiple teaching activities such as course plan design, curriculum development, learning objectives of individual courses, classroom instruction, laboratory exercises and student learning assessment etc.
6.
REFERENCES
[1] Davis, F.D. 1989. Perceived usefulness, perceived ease of use, and user acceptance of information technology , MIS Quarterly, 13 (3), 319-340 .
[2] Davis, F. R., Bagozzi, R. and Warshaw, P. 1989. User acceptance of computer technology: a comparison of two theoretical models , Management Science, 35 (8), 982-1003 .
[3] Venkatesh ,V. 2000. Determinants of perceived ease of use: integrating control, intrinsic motivation, and emotion into the technology acceptance model , Information Systems Research, 11 (4) , 342-365.
[4] V. Venkatesh, V. and Bala , H. 2008. Technology acceptance model 3 and a research agenda on interventions , Decision Sciences, 39 (2) , 273-315
[5] Kundu, A. and Kedar Nath , D. 2018. Barriers to Utilizing ICT in Education in India with a Special Focus on Rural Areas, International Journal of Scientific Research and Reviews (IJSRR), 7(2), 341 -359 .
[6] Fusilier, M. and Durlabhji , S. 2005. An exploration of student internet use in India the technology acceptance
D R I V I N G
P O W E R
16 HII
15 CI
14 LSA LAI LFO
S 13
12 DT
11 Drivers PPD
TP
Linkage
10 AADI
9 LMPS,
ITSP, LPR 8
7 Dependent
6
5 Autonomous DLC
L
4 LCT
3 MB
TA
2 TR
AT
1 CP
1 2 3 4 5 6 7 8 9 10 11 12 1
3 14 15 16
Dependence
4.1.5 ISM Diagraph
Fig. Diagraph for barriers for implementation of technology based educational techniques in developing countries
CI LFOS
DT
AADI
LMPS ITSP LPR
DLC L LCT MBTA TRAT
HII LSA
[image:7.595.66.264.398.741.2]model and the theory of planned behaviour , Campus-Wide Information Systems, 22 (4), 233-246.
[7] The Economist. 2008. The future of higher education: How technology will shape learners. Economist Intelligence Unit, New Media Consortium
[8] Su, B. 2009. Effective technology integration: Old topic, new thoughts. Monterey Bay, USA.
[9] Aiman-Smith,L. and Green, S.G. 2002. Implementing new manufacturing technology: the related effects of technology characteristics and user learning activities , Academy of Management Journal, 45 (2),. 421-430
[10]Bingimlas, K. 2009. The barriers to the successful integration of ICT in teaching and learning environments: A review of the literature. Eurasia Journal of Mathematics, science and technology education, 5 (3).
[11]Koller, V., Harvey, S. & Magnotta, M. 2001. Technology-based teaching strategies. Social Policy Public Research Association. New York.
[12]Brown, I.T.J. 2002. Individual & technological factors affecting perceived ease of use of web-based learning technologies in a developing country , The Electronic Journal on Information Systems in Developing Countries, 9 (5), 1-15 .
[13]Tarafdar, M. and Vaidya, S. 2006. Challenges in the adoption of E-Commerce technologies in India: the role of organizational factors, International Journal of Information Management, 26 , 428-441.
[14]Georgina, D. A., & Hosford, C. C. 2009. Higher education faculty perceptions on technology integration and training. Teaching and Teacher Education, 25(5), 690–696. http://dx.doi.org/10.1016/j.tate.2008.11.004
[15] Chan Lin, L.J., Hong, J.C., Horng, J.S., Chang, S.H., & Chu, H.C. 2006. Factors influencing technology integration in teaching: A Taiwanese perspective. Innovations in Education and Teaching International,
43(1), 57–68.
http://dx.doi.org/10.1080/14703290500467467
[16]Salehi, H., & Salehi, Z. 2012. Challenges for Using ICT in Education: Teachers’ Insights. International Journal of e-Education, e-Business, e-Management and e-Learning, 2(1), 40-43.
[17]Wood, E., Mueller, J., Willoughby, T., Specht, J., & Deyoung, T. 2005. Teachers’ perceptions: barriers and
supports to using technology in the classroom. Education,Communication and Information, 5(2), 183– 206. http://dx.doi.org/10.1080/14636310500186214
[18] Jones, A. 2004. British Educational Communications and Technology Agency (BECTA), corp creator. A review of the research literature on barriers to the uptake of ICT by teachers.
[19] Al-Senaidi, S., Lin, L., & Poirot, J. 2009. Barriers to adopting technology for teaching and learning in Oman. Computers & Education, 53(3), 575–590. http://dx.doi.org/10.1016/j.compedu.2009.03.015
[20] Karasavvidis, I. 2009. Activity theory as a conceptual framework for understanding teacher approaches to information and communication technologies. Computers & Education, 53(2), 436–444. http://dx.doi.org/10.1016/j.compedu.2009.03.003
[21] Prestridge, S. 2012. The beliefs behind the teacher that influences their ICT practices. Computers &
Education, 58(1), 449–458.
http://dx.doi.org/10.1016/j.compedu.2011.08.028
[22] Lee, S.M., Kim, L.S. Rhee, S.. 2006. The role of exogenous factors in technology acceptance: the case of object-oriented technology , Information and Management, 43, 469-480 .
[23] Catherall , P. 2005. Skills exchange experience by students in the use of education technology/e-learning. Power point presentation.
[24] Warfield, J.N. 1974. Developing interconnection matrices in structural modeling. IEEE Transactions on Systems, Man, and Cybernetics, (1), 81-87.
[25] Katsifili. 2010 . The impact of blackboard software on education, globally over the past 10 years. Academic Innovation, Blackboard Inc.
[26] Deshmukh, S.V. and Chavan, A. 2012. Six Sigma and SMEs: a critical review of literature, International Journal of Lean Six Sigma, 3(2), 157-167, https://doi.org/10.1108/20401461211243720.