STIGMA EXSERTION TRAIT IN RICE (
1
Akhilesh Singh, K.,
2Kemparaju
1
Pranitha Koradi,
1Durga Khandekar,
1,4
Pawan Khera,
1,5Manisha Barthwal,
1
Barwale Foundation,
2
Directorate of Rice Research (DRR), Hyderabad, India
3
Mahindra and Mahindra
4
International Crop Research Institute for Semi
5
Bayer Biosciences Pvt. Ltd., Hyderabad, India
6
CPMB, Osmania University, Hyderabad, India
ARTICLE INFO ABSTRACT
A practical option to address food security of South
exploit yield heterosis through hybrid rice technology. Several traits contribute to hybrid rice seed production efficiency, and
thereby enhancing hybrid seed set. Few rice stigma exsertion types are enumerated but phenotyping methods are not systematic and well compared. This study reports the extent of variability for the trait in par
some of them, and identifies good donors, namely BF16B and BF96B for the trait. During phenotyping, sample processing was improved for non
storability between sampling and phenotyping. Method comparison analyses between the two modified phenotyping methods for stigma exsertion indicate that the whole panicle and the panicle zone methods are statistically on par in quan
interchangeable. However, the latter being less resource demanding, may be the choice for stigma exsertion phenotyping in rice.
Copyright © 2015 Akhilesh Singh et al. This is an open access article
distribution, and reproduction in any medium, provided the original work is properly cited.
INTRODUCTION
A practical option to address food security of the South Asian countries where rice (Oryza sativa L.) is a staple food has been exploitation of heterosis through commercial hybrid rice technology. Hybrid rice exhibits a yield advantage of 15 20% (or more than one ton of paddy per hectare) over the best traditional varieties in large-scale production worldwide (Xu 2003; FAO, 2004). However, as opposed to the case of open pollinated plants, it is difficult to reliably produce an acceptable quantity of hybrid seed through the use of hybrid systems, as rice is strictly self-pollinated (Azzini and Rutger 1982). There are several traits contributing to the hybrid seed production efficiency, such as days to heading, pollen load, pollen longevity, and morphological traits of floret, viz., size of stigma and style, stigma exsertion, stigmatic receptivity, spikelet opening angle and duration (Virmani 1994).
*Corresponding author:Vinay Shenoy, V.
Barwale Foundation, Hyderabad, India.
ISSN: 0975-833X
Article History:
Received 21st December, 2014
Received in revised form 27th January, 2015
Accepted 06th February, 2015 Published online 17th March,2015
Key words: Heterosis breeding, Hybrid seed production, Method agreement, Spikelet phenotyping, Stigma exsertion.
RESEARCH ARTICLE
STIGMA EXSERTION TRAIT IN RICE (
ORYZA SATIVA
L.) AND COMPARISON OF TWO
PHENOTYPING METHODS
Kemparaju, K. B.,
1,3Virupaxagouda Patil,
1Rahul
Durga Khandekar,
2Jayaramulu, K.,
2Sheshu Madhav,
Manisha Barthwal,
2Subba Rao, L. V.,
2Hariprasad, A
and
1,*Vinay Shenoy, V.
Barwale Foundation, Hyderabad, India
Directorate of Rice Research (DRR), Hyderabad, India
Mahindra and Mahindra Ltd., Secunderabad, India
International Crop Research Institute for Semi-Arid Tropics (ICRISAT), Hyderabad, India
Bayer Biosciences Pvt. Ltd., Hyderabad, India
CPMB, Osmania University, Hyderabad, India
ABSTRACT
A practical option to address food security of South-east Asian countries with rice as staple is to exploit yield heterosis through hybrid rice technology. Several traits contribute to hybrid rice seed production efficiency, and stigma exsertion is a trait increasing the opportunity of pollination and thereby enhancing hybrid seed set. Few rice stigma exsertion types are enumerated but phenotyping methods are not systematic and well compared. This study reports the extent of variability for the trait in parental lines of some popular rice hybrids, identifies the opportunity for enhancing the trait in some of them, and identifies good donors, namely BF16B and BF96B for the trait. During phenotyping, sample processing was improved for non-distortion of spikele
storability between sampling and phenotyping. Method comparison analyses between the two modified phenotyping methods for stigma exsertion indicate that the whole panicle and the panicle zone methods are statistically on par in quantitative assessment of stigma exsertion and are interchangeable. However, the latter being less resource demanding, may be the choice for stigma exsertion phenotyping in rice.
is an open access article distributed under the Creative Commons Attribution License, which distribution, and reproduction in any medium, provided the original work is properly cited.
A practical option to address food security of the South-east L.) is a staple food has been exploitation of heterosis through commercial hybrid ogy. Hybrid rice exhibits a yield advantage of 15– 20% (or more than one ton of paddy per hectare) over the best
scale production worldwide (Xu 2003; FAO, 2004). However, as opposed to the case of
open-difficult to reliably produce an acceptable quantity of hybrid seed through the use of hybrid pollinated (Azzini and Rutger 1982). There are several traits contributing to the hybrid seed ys to heading, pollen load, pollen longevity, and morphological traits of floret, viz., size of stigma and style, stigma exsertion, stigmatic receptivity, spikelet opening angle and duration (Virmani 1994).
Among them, stigma exsertion is emphasized as a major component in increasing pollination and seed set (Kato and Namai 1987; Sheeba et al., 2006). Stigma exsertion is an important trait that contributes to the improve
production in hybrid rice and is closely related to seed productivity in hybrid rice (Takano
current lack of enough economic success of hybrid rice seed production being seed producibility, one of the bottlenecks is low seed set which in turn is dependent on low out
rate prevalent (Mao et al., 1998). Stigma exsertion and other stigma traits have received consistent attention from rice researchers (Virmani and Athwal 1973; Yuan 1981; Ying and Zang 1989; Virmani 1994; Yuan and Fu 1995; Uga 2003a, b; Xu 2003; Miyata et al
Singh et al., 2012). Observations made at International Rice Research Institute (IRRI) indicate that the exsertion of the stigma is a genetic trait, and not a
high expression of this trait; however, it can be enhanced through specific breeding efforts (Virmani 1994). Development of a maternal parent with highly exserted stigmas is expected
Available online at http://www.journalcra.com
International Journal of Current Research Vol. 7, Issue, 03, pp.13123-13135, March, 2015
INTERNATIONAL
z
L.) AND COMPARISON OF TWO
Rahul Priyadarshi,
, M.,
1Lalitha Shanti, M.,
A.S.,
6Ulaganathan, K.
Arid Tropics (ICRISAT), Hyderabad, India
east Asian countries with rice as staple is to exploit yield heterosis through hybrid rice technology. Several traits contribute to hybrid rice seed increasing the opportunity of pollination and thereby enhancing hybrid seed set. Few rice stigma exsertion types are enumerated but phenotyping methods are not systematic and well compared. This study reports the extent of variability for the trait ental lines of some popular rice hybrids, identifies the opportunity for enhancing the trait in some of them, and identifies good donors, namely BF16B and BF96B for the trait. During distortion of spikelet characters and longer storability between sampling and phenotyping. Method comparison analyses between the two modified phenotyping methods for stigma exsertion indicate that the whole panicle and the panicle titative assessment of stigma exsertion and are interchangeable. However, the latter being less resource demanding, may be the choice for stigma
ribution License, which permits unrestricted use,
Among them, stigma exsertion is emphasized as a major component in increasing pollination and seed set (Kato and ., 2006). Stigma exsertion is an important trait that contributes to the improvement of seed production in hybrid rice and is closely related to seed productivity in hybrid rice (Takano-Kai et al., 2011). The current lack of enough economic success of hybrid rice seed production being seed producibility, one of the bottlenecks is seed set which in turn is dependent on low out-crossing ., 1998). Stigma exsertion and other stigma traits have received consistent attention from rice researchers (Virmani and Athwal 1973; Yuan 1981; Ying and 94; Yuan and Fu 1995; Uga et al,. et al. 2007; Sidharthan et al., 2007; ., 2012). Observations made at International Rice Research Institute (IRRI) indicate that the exsertion of the stigma is a genetic trait, and not all male-sterile lines possess high expression of this trait; however, it can be enhanced through specific breeding efforts (Virmani 1994). Development of a maternal parent with highly exserted stigmas is expected
not only to help to trap more pollen dispersed from a paternal parent, but also to overcome the barrier of pollination caused by the differences in the flowering date or time between the parents. With an increase in the frequency of stigma exsertion in male sterile lines of hybrid rice, the seed-setting rate in hybrid seed production and the yield of hybrid seed also increased (Zetian and Yanrong 2010).
Many genetic studies on the frequency of stigma exsertion and distinct variability for the stigma exsertion trait in inter- and intra-generic derivatives of Oryza have been reported (Virmani and Athwal 1973; Virmani 1994; Uga et al., 2003a, b; Miyata et al., 2007; Sidharthan et al., 2007; Yan et al., 2009). Generally, cultivated rice shows lower stigma exsertion rate compared to wild rice. With the exception of Oryza stapfii and O. rufipogon, most of the wild rice showed 75 - 100% stigma exsertion, indicative of open pollination (Virmani 1994). Ramesha et al. (1998) reported 48 - 65% stigma exsertion in CMS lines derived from O. rufipogon and O. nivara. Sheeba et al. (2006) reported 27 - 65% stigma exsertion in cultivated CMS A lines of rice. Irrespective of sub species, the stigma exsertion rate ranged from 51.6% to 60.4% in rice (Singh et al. 2006).
Though Ying and Zang (1989) and later the Standard Evaluation System (SES) published by INGER (1996) define the classification of stigma exsertion based on the exsertion levels, the methods used for phenotyping the stigma exsertion are very varied (Yan et al., 2009); and there are no studies comparing them in a systematic manner. The present study was focused on comparing two natively developed methods of phenotyping for stigma exsertion types, viz., the whole panicle method and the panicle zone method, both of which are improvements over the reported ones, attempting to minimize distortion during long duration storage of sampled spikelets and for accurate assessment of stigma exsertion. The panicle zone method was developed to reduce the drudgery of the whole panicle method as well as to save upon time and human resources.
In research, comparison of one method with another is often needed to see whether they agree sufficiently for replacement decisions (Indrayan 2013). Various statistical methods have been used to test for agreement of methods with quantitative or continuous outcomes (Zaki et al., 2012). Bland and Altman (1986) have suggested a series of steps that could be used to evaluate agreement or disagreement between two methods. This study also forms a pre-requisite for molecular marker based mapping and tagging of the stigma exsertion trait in rice, ongoing collaboratively at Barwale Foundation (BF) and Directorate of Rice Research (DRR), both located at Hyderabad, India.
MATERIALS AND METHODS
Plant material
[image:2.595.303.565.81.171.2]Eight genotypes with contrasting mean total stigma exsertion were chosen from screening of nearly fifty maintainer lines in hybrid rice breeding. These eight genotypes varied considerably for mean stigma exsertion (18 to 84%) (Table 1).
Table 1. Rice genotypes with their mean total stigma exsertion (TSE)
# Genotype Source Mean TSE (%)
1 BF16B Barwale Foundation (BF) 83.52
2 BF96B Barwale Foundation (BF) 83.55
3 DRR6B Directorate for Rice Research (DRR) 59.11 4 DRR9B Directorate for Rice Research (DRR) 48.57 5 IR25B Int’l Rice Research Institute (IRRI) 39.50 6 IR56B Int’l Rice Research Institute (IRRI) 53.71 7 IR97B Int’l Rice Research Institute (IRRI) 37.81 8 APMS6B Directorate for Rice Research (DRR) 17.91
Phenotyping
During the wet season of 2012, two phenotyping methods, viz., the whole panicle method (Method 1) and the panicles zone method (Method 2), were used at the experimental stations of BF and DRR, both located at Hyderabad, India (Latitude: 17⁰
22’ 31” N, Longitude: 78⁰ 28’ 27” E, Elevation: 494 m above MSL). Experiments were laid out in randomized complete block design (RCBD) with three replications comprising of single row plots of genotypes. Twenty-five day old seedlings were transplanted at 20 x 20 cm spacing with 20 plants per row for each genotype. Standard agronomic practices were followed. Panicle collection was done at the time when all spikelets were completely open. Sampling was performed using one panicle each from the main tiller of randomly chosen five individual plants in each replication, per genotype. Thus, a total of 15 panicles were collected for each genotype. Sub zero temperature conditions were maintained during collection and transport of panicles, so as to prevent them from drying. Further, the panicles were treated with 0.2% Benlate and were wrapped in germination papers wetted with 0.2% mercuric chloride (HgCl2) solution to avoid any fungal or microbial
attack during their storage at 4° C. The paper towels were then placed in plastic zip bag or were covered in aluminium foil to maintain the moisture content of panicles. Using this method of collection and storage, we were able to store the panicles for over 20 days without any distortion in spikelet/ stigma.
Evaluation of stigma exsertion trait
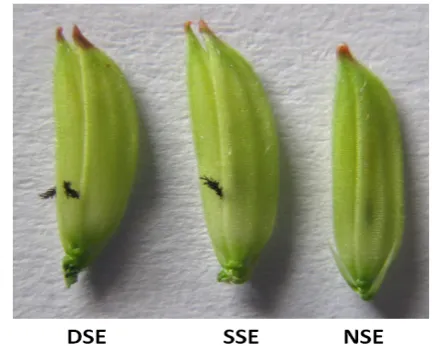
The phenotyping for stigma exsertion in the eight genotypes was carried out by categorizing the spikelets from each panicle as dual, single or no stigma exsertion types (Figure 1).
Figure 1. Stigma exsertion types in rice spikelets: Dual stigma exsertion (DSE), Single stigma exsertion (SSE), and No stigma exsertion (NSE)
[image:2.595.324.541.553.726.2]The type of stigma exsertion was grouped as dual stigma exsertion (when the stigma exerts on both sides of the spikelet, DSE), single stigma exsertion (where stigma exerts on only one side of the spikelet, SSE) and no stigma exsertion (when the stigma does not exsert at all from the spikelet, NSE). Sum total of DSE and SSE gives the total stigma exsertion (TSE) (Yan et al., 2009).
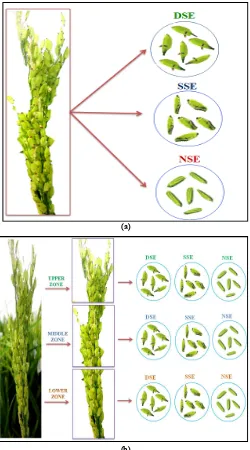
Method 1: Whole panicle method
For assessing the quantity of each of the stigma exsertion type by the whole panicle method, all the individual spikelets in each panicle were separated and observed under illuminated magnifier lens to categorize them into dual, single or no stigma exsertion types (Figure 2a). Spikelets representing each class of stigma exsertion were counted separately and represented as percentage, as detailed by Yan et al. (2009):
(a)
[image:3.595.38.288.249.699.2](b)
Figure 2. a: Whole panicle method (Method 1) - All the spikelets of an entire panicle were scored; b: Panicle zone method (Method 2) - The whole
panicle was cut into three parts, representing the upper, middle and lower zones. In each zone, five spikelets were randomly chosen for scoring. The
spikelets were scored as dual stigma exsertion (DSE) or single stigma exsertion (SSE) or no stigma exsertion (NSE) type
DSE (%) = (Number of spikelets showing DSE/ Total number of spikelets in the panicle) X 100
SSE (%) = (Number of spikelets showing SSE/ Total number of spikelets in the panicle) X 100
NSE (%) = (Number of spikelets showing NSE/ Total number of spikelets in the panicle) X 100
TSE (%) = DSE (%) + SSE (%)
Method 2: Panicle zone method
For assessing stigma exsertion trait by the panicle zone method, each panicle was divided into three zones, namely, upper, middle, and lower zone (Figure 2b). Five spikelets from each of the three zones were collected randomly, i.e., 15 spikelets per panicle per genotype, and were scored to study the stigma exsertion type. The quantum of each exsertion type in each of the zones was calculated as below:
DSE (%) = (Number of spikelets showing DSE/ 5) X 100 SSE (%) = (Number of spikelets showing SSE/ 5) X 100 NSE (%) = (Number of spikelets showing NSE/ 5) X 100 TSE (%) = DSE (%) + SSE (%)
Data analyses
The estimation of basic statistical parameters such as minimum, maximum, mean, standard error, median, coefficient of variation (CV), and analysis of variance (ANOVA) for the exsertion types across genotypes, methods and locations was done employing CropStat V. 7.2.3 (IRRI, 2007). Means for the exsertion types were compared for significance of difference by the protected Fisher’s least significant difference (LSD) test at 5% level of probability (Williams and Abdi 2010). The correlation and regression analyses of the exsertion types and intra-class correlation coefficients (ICC) were obtained through the use of SPSS (V. 16) package (SPSS 2007). The Bland and Altman plot approach (Bland and Altman 1986) was adopted for assessing agreement between the whole panicle and panicle zone methods, employing ‘Analyse-it’ software V 2.27 (Analyse-it 2009).
RESULTS
Basic statistical parameters
The statistical parameters calculated for the panicle zone and the whole panicle methods are presented in Table 2. Range: In the whole panicle method, the minimum and maximum values for TSE ranged from 13 to 91% and for DSE from 0.2 to 56%, for SSE from 9 to 50%, and for NSE from 9 to 87% (Table 2). The ranges of TSE, DSE, SSE and NSE were respectively 7 to 93%, 0 to 57%, 7 to 52%, and 7 to 93%, in the panicle zone method.
Mean, Standard Deviation (SD) and Median: Means of the four stigma exsertion types, viz., TSE, DSE, SSE and NSE were between 49 to 55%, 16 to 20%, 31 to 38%, and 45 to 51%, respectively. The standard deviation values for the means varied from 10 to 24%. The median values for TSE, DSE, SSE and NSE ranged from 11 to 55% and were close to their
13125 International Journal of Current Research, Vol. 7, Issue, 03, pp.13123-13135, March,2015
respective mean values. The maximum difference between mean and median was only 2% points.
Table 2. Basic statistical parameters for rice stigma exsertion types at Barwale Foundation (BF) and Directorate of Rice
Research (DRR)
Method Parameter TSEa (%) DSE (%) SSE (%) NSE (%)
BF DRR BF DRR BF DRR BF DRR
Whole Panicle Method
Maximum 91.2 81.4 56.4 44.7 49.9 49.2 79.8 87.1
Minimum 20.2 12.9 1.3 0.2 17.8 8.7 8.8 18.6
Mean 55.0 51.1 19.7 17.1 34.3 34.1 45.0 48.2
SD 23.4 21.6 20.0 14.8 9.6 10.4 23.6 19.9
Median 54.5 50.3 10.8 12.5 36.7 36.3 45.5 49.7
Panicle Zone Method
Maximum 93.3 77.3 56.7 41.3 51.8 44.0 93.3 85.3
Minimum 6.7 14.7 0.0 4.0 6.7 10.7 6.7 22.7
Mean 53.8 48.8 15.7 17.5 38.0 31.3 46.2 51.3
SD 23.9 21.0 15.7 12.0 13.2 10.9 23.9 21.0
Median 55.0 43.3 11.5 12.0 41.7 33.3 45.0 56.7
a TSE: Total stigma exsertion, DSE: Dual stigma exsertion, SSE: Single stigma
exsertion, and NSE: No stigma exsertion
Analysis of Variance (ANOVA) for stigma exsertion types
[image:4.595.317.549.247.355.2]
ANOVA for the stigma exsertion types across genotypes, panicle zones and locations (Table 3) revealed that only the differences due to genotype effect were significant (except for SSE type which showed significant difference due to location also).
Table 3. Analysis of Variance (ANOVA) for stigma exsertion types in rice by panicle zone method
Variatea No. Grand
Mean
Standard deviation based on
CV% F-Probability value
TSSb RSS Genotype Panicle
zone
Location
TSE 96 51.26 23.43 14.04 27.40 0.000 0.733 0.080
DSE 96 16.62 16.04 12.43 74.80 0.000 0.652 0.497
SSE 96 34.64 14.24 10.75 31.00 0.000 0.701 0.003
NSE 96 48.74 23.43 14.04 28.80 0.000 0.733 0.080
a TSE: Total stigma exsertion; DSE: Dual stigma exsertion; SSE: Single stigma
exsertion; NSE: No stigma exsertion
b TSS: Total sum of squares, RSS: Residual sum of squares
While DSE type exhibited a maximum coefficient of variation (CV) of 75%, TSE showed the minimum of 27%. As the difference due to the panicle zones was not significant, for further analyses, averaged figures across the panicle zones for TSE, DSE, SSE and NSE were used. The ANOVA for the stigma exsertion types using the combined data from the panicle zone method and the whole panicle method is presented in Table 4.
Combined over the methods, the genotype and its interaction with method and location effects varied highly significantly (P < 0.1) for all the four stigma exsertion types. The methods and locations were not significant sources of variation. The CV values ranged from 12% (NSE) to 27% (DSE) going along with SD value of 22% for both.
Analysis of means: Significance of genotypic differences for
the types led to comparison of the mean performances of genotypes. Tables 5 and 6 enlist respectively the mean performance of genotypes (Table 5), and genotype x method and genotype x location interaction effects (Table 6). These were the only three significant sources of variation as revealed by ANOVA (Table 4).
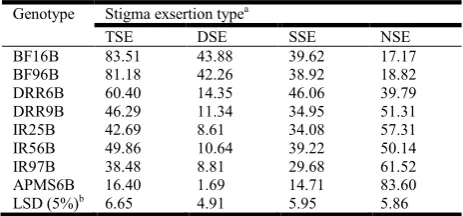
Table 5. Means of rice genotypes for stigma exsertion types
Genotype Stigma exsertion typea
TSE DSE SSE NSE
BF16B 83.51 43.88 39.62 17.17
BF96B 81.18 42.26 38.92 18.82
DRR6B 60.40 14.35 46.06 39.79
DRR9B 46.29 11.34 34.95 51.31
IR25B 42.69 8.61 34.08 57.31
IR56B 49.86 10.64 39.22 50.14
IR97B 38.48 8.81 29.68 61.52
APMS6B 16.40 1.69 14.71 83.60
LSD (5%)b 6.65 4.91 5.95 5.86
a
TSE: Total stigma exsertion; DSE: Dual stigma exsertion; SSE: Single stigma exsertion; and NSE: No stigma exsertion
b Least significant difference at 5% level of probability by protected Fisher’s
LSD test
[image:4.595.28.297.392.478.2]Based on the mean values of genotypes (Table 5) for the TSE types, BF16B had very high value of 84%, followed by BF96B (81%). The minimum mean was recorded for APMS6B (16%), followed by IR97B (39%). Comparison of these means using the LSD value (7%) indicated that while BF16B and BF96B did not differ significantly, the difference between APMS6B and IR97B was significant. While APMS6B also recorded minimum mean for DSE (2%) and SSE (15%), it showed the maximum mean for NSE (84%). BF16B had maximum mean for DSE (44%) and minimum mean of 17% for NSE. DRR6B recorded the maximum mean of 46% for SSE. IR25B, one of the most popular maintainer lines, recorded moderate TSE of 43% (Table 5). Individual proportions of DSE, SSE and NSE, and proportion of DSE and SSE to the TSE are depicted in Figure 3 (a, b). The genotypes BF96B and BF96B had more than 50% DSE and less than 25% of NSE. The genotypes APMS6B, IR97B and IR25B showed a reverse trend; they had less than 25% DSE and more than 50% NSE (Figure 3a).
Table 4. Analysis of Variance (ANOVA) of stigma exsertion types in rice spikelets scored by both the phenotyping methods
Variatea No. Grand Mean Standard deviation based on CV% F-Probability value
TSSb RSS Genotype (G) Method (M) Location (L) G x M G x L M x L
TSE 80 52.35 22.19 6.69 12.80 0.000 0.722 0.391 0.000 0.000 0.832
DSE 80 17.70 16.02 4.77 26.90 0.000 0.632 0.803 0.000 0.000 0.886
SSE 80 34.66 10.89 6.25 18.00 0.000 0.988 0.155 0.000 0.000 0.360
NSE 80 47.46 21.73 5.88 12.40 0.000 0.672 0.426 0.000 0.000 0.838
a TSE: Total stigma exsertion; DSE: Dual stigma exsertion; SSE: Single stigma exsertion; and NSE: No stigma exsertion b TSS: Total sum of squares, RSS: Residual sum of squares
[image:4.595.41.559.662.725.2]Figure 3. Proportion of individual stigma exsertion types in rice genotypes: a - on panicle basis, b – dual stigma exsertion (DSE) and single stigma exsertion (SSE) to total stigma exsertion (TSE)
The proportion of DSE to SSE in these genotypes was almost 1:1, whereas, in rest of the genotypes, it ranged from 1:3 to 1:8. Thus, the contribution of DSE to TSE was more than 50% in BF16B and BF96B but less than 20% in APMS6B, IR97B and IR25B (Figure 3b).
A study of the genotype x methods and genotype x location interaction effects (Table 6) brings out that the genotypes BF16B and BF96B top the means and APMS6B and IR97B hit the bottom for TSE, DSE and SSE. However, for NSE the trend was reverse. Also, means of the two top performers did not differ significantly by applying LSD test (Table 6).
Interrelationship analyses
Correlation and Regression
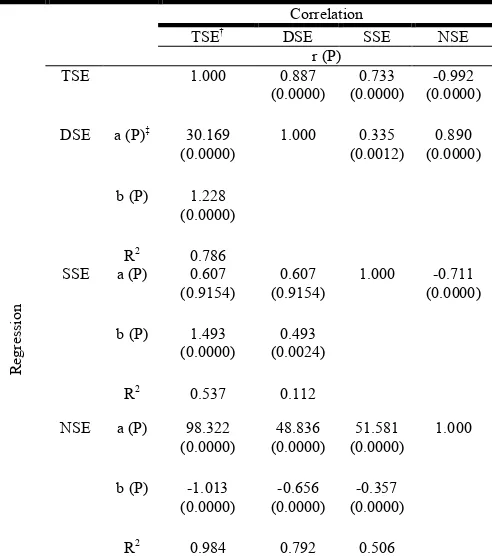
[image:5.595.311.557.163.441.2]The product moment correlation coefficients (r) and regression coefficients (b) are depicted in Table 7.
Table 7. Inter-relationship of the stigma exsertion types in rice (above the diagonal correlation and below the diagonal regression parameters)
Correlation
TSE† DSE SSE NSE
r (P)
TSE 1.000 0.887
(0.0000)
0.733 (0.0000)
-0.992 (0.0000)
Regressi
o
n
DSE a (P)‡ 30.169 (0.0000)
1.000 0.335 (0.0012)
0.890 (0.0000)
b (P) 1.228 (0.0000)
R2 0.786
SSE a (P) 0.607 (0.9154)
0.607 (0.9154)
1.000 -0.711 (0.0000)
b (P) 1.493 (0.0000)
0.493 (0.0024)
R2 0.537 0.112
NSE a (P) 98.322 (0.0000)
48.836 (0.0000)
51.581 (0.0000)
1.000
b (P) -1.013 (0.0000)
-0.656 (0.0000)
-0.357 (0.0000)
R2 0.984 0.792 0.506
†TSE: Total stigma exsertion; DSE: Dual stigma exsertion; SSE: Single stigma
exsertion; and NSE: No stigma exsertion
‡ r: Correlation coefficient; a: intercept; P: Probability; b: Regression
coefficient; R2: Coefficient of determination
Both correlation coefficient (r) as well as regression coefficient (b) were highly significant at 0.01% level of probability. Comparison of the r values showed that the highest positive correlation (r = 0.89) was between DSE and NSE, the largest negative correlation (r = -0.99) was between TSE and NSE. The lowest correlation observed (r = 0.34) was between DSE
13127 International Journal of Current Research, Vol. 7, Issue, 03, pp.13123-13135, March,2015
Table 6. Genotype x Method and Genotype x Location means of stigma exsertion types
Genotype Methoda Locationb
M1 M2 M1 M2 M1 M2 M1 M2 BF DRR BF DRR BF DRR BF DRR
TSEc DSE SSE NSE TSE DSE SSE NSE
BF16B 84.51 82.00 46.81 39.50 37.71 42.50 16.62 18.00 87.81 79.20 50.96 36.81 36.86 42.39 12.19 22.16 BF96B 83.49 77.73 47.09 35.02 36.40 42.71 16.51 22.27 84.95 77.42 43.41 41.10 41.54 36.31 15.05 22.58 DRR6B 59.64 61.55 12.18 17.59 47.46 43.95 40.68 38.45 59.66 61.14 12.56 16.13 47.10 45.01 40.34 39.23 DRR9B 45.81 47.00 10.23 13.00 35.59 34.00 50.18 53.00 53.71 38.87 12.62 10.06 41.09 28.81 46.29 56.32 IR25B 40.48 46.00 9.69 7.00 30.80 39.00 59.52 54.00 40.48 44.90 4.85 12.37 35.63 32.52 59.52 55.10 IR56B 53.66 44.17 11.95 8.67 41.71 35.50 46.34 55.83 50.78 48.94 9.64 11.64 41.14 37.30 49.22 51.06 IR97B 37.60 39.80 7.89 10.18 29.71 29.62 62.40 60.20 42.88 34.09 9.89 7.72 32.99 26.37 57.12 65.91 APMS6B 19.45 11.83 1.49 2.00 17.96 9.83 80.55 88.17 15.85 16.96 1.16 2.23 14.68 14.73 84.15 83.04
LSD (5%)d 9.29 6.24 8.06 7.98 8.46 6.02 7.90 7.42
a Method M1: Whole panicle method, M2: Panicle zone method b Location BF: Barwale Foundation, DRR: Directorate of Rice Research c
TSE: Total stigma exsertion; DSE: Dual stigma exsertion; SSE: Single stigma exsertion; and NSE: No stigma exsertion
[image:5.595.49.560.520.638.2]and SSE. The highest positive regression (b = 1.493) and negative regression (b = -1.013) values were between TSE– SSE, and TSENSE, respectively. The lowest b value (b = -0.357) was between SSE and NSE (Table 7).
Method agreement analyses
The relevant parameters needed for the assessment of agreement between the phenotyping methods by the Bland and Altman approach are tabulated in Table 8 (A, B, C, D).
Comparison of means: Table 8A brings out comparison of
means of the methods employing the t test. The t values for difference of means between the two methods for TSE (0.93), DSE (1.09), SSE (0.01), and NSE (-1.10) were non-significant at 0.05 level of probability.
Comparison of correlation and regression coefficients: Table
8B gives idea about comparison of product moment correlation coefficient (r), regression coefficient (b) and coefficient of
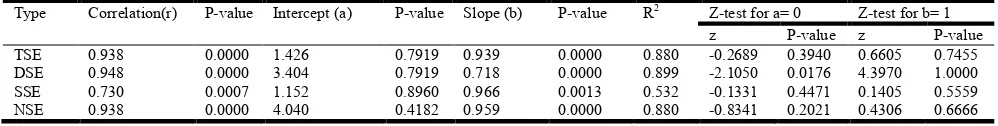
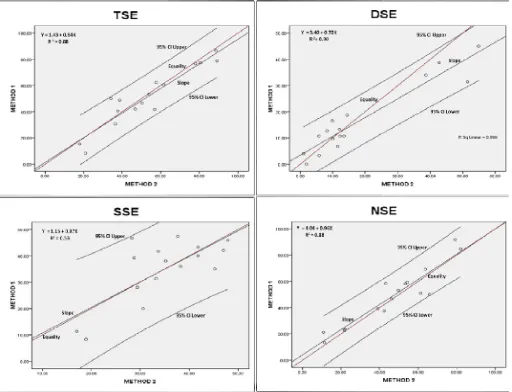
determination (R2) for the exsertion types between the two phenotyping methods. The r values between the methods among the four types of stigma exsertion were very highly significant (P < 0.001), ranging from 0.73 (SSE) to 0.95 (DSE). The intercepts ranged from 1.1 (SSE) to 4.0 (NSE), and the z statistic of them indicated that all of them (except for DSE with P < 0.0018) were significantly different from zero. The scatter plots for the stigma exsertion types and their regression equations are depicted in Figure 4.
The regression coefficients (b) obtained between the two phenotyping methods ranged from 0.72 (DSE) to 0.97 (SSE). The probability values of the z for the b values showed all were not significantly deviating from the unit slope. The coefficient of determination (R2) ranged from 0.53 (SSE) to 0.90 (DSE) (Table 8B).
Intra-class Correlation Coefficients (ICC): Table 8C lists the
[image:6.595.51.550.346.409.2]intra-class correlation coefficients (ICC, rI) between the two
Table 8. Parameters for method agreement comparison
8A. Comparison of Means with one sample t-test
SE type Method Mean SD SEM t-value P
TSEa Whole 53.08 22.362 3.228 0.9304 0.1834
Zones 51.26 22.296 3.941
DSE Whole 18.41 17.320 2.500 1.0910 0.1462 Zones 16.62 13.675 2.417
SSE Whole 34.67 9.862 1.423 0.0129 0.4949
Zones 34.64 12.352 2.184
NSE Whole 46.6 21.513 3.105 -1.1024 0.1438 Zones 48.74 22.293 3.941
8B. Regression equations for correlations between the exsertion types measured by the two phenotyping methods
Type Correlation(r) P-value Intercept (a) P-value Slope (b) P-value R2 Z-test for a= 0 Z-test for b= 1
z P-value z P-value
TSE 0.938 0.0000 1.426 0.7919 0.939 0.0000 0.880 -0.2689 0.3940 0.6605 0.7455
DSE 0.948 0.0000 3.404 0.7919 0.718 0.0000 0.899 -2.1050 0.0176 4.3970 1.0000
SSE 0.730 0.0007 1.152 0.8960 0.966 0.0013 0.532 -0.1331 0.4471 0.1405 0.5559
NSE 0.938 0.0000 4.040 0.4182 0.959 0.0000 0.880 -0.8341 0.2021 0.4306 0.6666
8C. Intra-class Correlation Coefficients (ICC)
SE Type Intra-class correlation coefficient Cronbach's Alpha
ICC Lower bound Upper bound
95% CI
TSE 0.938 0.832 0.978 0.968
DES 0.913 0.769 0.969 0.954
SSE 0.702 0.333 0.885 0.825
NSE 0.938 0.832 0.978 0.968
8D. Comparison of Difference of Means
TSE DSE SSE NSE
Mean Whole Panicle Method 53.08 18.41 34.67 46.6
Panicle Zone Method 51.26 16.62 34.64 48.74
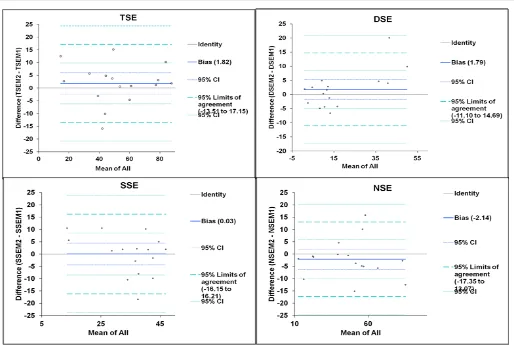
Difference of means (d) 1.82 1.79 0.03 -2.14
Standard Deviation of d (SDd) 7.82 6.58 8.26 7.76
95% Limit of agreement Upper Bound 17.15 14.69 16.21 13.07
95% Limit of agreement Lower Bound -13.51 -11.1 -16.15 -17.35
95% Confidence Interval of Upper Bound 24.42 to 9.87 20.81 to 8.57 23.89 to 8.53 20.30 to 5.85 95% Confidence Interval of Lower Bound -6.23 to -20.79 -4.98 to -17.22 -8.47 to -23.83 -10.13 to -24.58
a TSE: Total stigma exsertion; DSE: Dual stigma exsertion; SSE: Single stigma exsertion; and NSE: No stigma exsertion
phenotyping methods. The ICC were high for all the four stigma exsertion types, the highest being 0.94 for TSE and the lowest for SSE at 0.70. The range of difference between lower and upper bounds of ICC at 95% confidence interval was from 0.15 (TSE-NSE) to 0.55 (TSE-SSE). The Cornbach’s Alpha ranged between 0.83 (SSE) to 0.97 (TSE, NSE), depicting high values of the alpha.
Comparison of difference of means: Table 8D reveals the
characteristics of the difference of means (d) and the combined means for the trait types. While the d value was the highest (-2.14) in NSE, the minimum (0.03) was in SSE. In case of TSE, the d was 1.82 and the SD of the difference of means (SDd) was 7.8, leading to the upper limit (d + 1.96 X SDd) of 17.2, and the lower limit (d – 1.96 X SDd) of
bounds of 24.4 to -20.8 at 95% confidence interval. Similar workings with DSE, SSE, and NSE (Table 8D) indicate that the effective ranges between the lower and upper limits were 20.8 to -17.2, 23.9 to -23.8, and 20.3 to -24.6 for DSE, SSE and NSE, respectively.
Figure 5 shows the scatter-plots of difference of means and combined means for rice stigma exsertion types scored by the
Figure 4. Scatter-plots of rice stigma exsertion types (TSE: Total Stigma exsertion; DSE: Dual Stigma Exsertion; SSE: Single Stigma Exsertion and NSE: No Stigma Exsertion) scored by whole panicle method (Method 1) and panicle zone
13129 International Journal of Current Research,
The ICC were high for all the four exsertion types, the highest being 0.94 for TSE and the lowest for SSE at 0.70. The range of difference between lower and upper bounds of ICC at 95% confidence interval was from SSE). The Cornbach’s Alpha E) to 0.97 (TSE, NSE), depicting high
Table 8D reveals the characteristics of the difference of means (d) and the combined
means for the trait types. While the d value was the highest 2.14) in NSE, the minimum (0.03) was in SSE. In case of
TSE, the d was 1.82 and the SD of the difference of means (SDd) was 7.8, leading to the upper limit (d + 1.96 X SDd) of 1.96 X SDd) of -13.5, with 0.8 at 95% confidence interval. Similar workings with DSE, SSE, and NSE (Table 8D) indicate that the effective ranges between the lower and upper limits were 20.8 24.6 for DSE, SSE and
plots of difference of means and combined means for rice stigma exsertion types scored by the
two methods of phenotyping. All (100%) the scatter points of difference of means were lying within the lower and upper bounds (including 95% CI of u
[image:7.595.48.560.149.541.2]the stigma exsertion types.
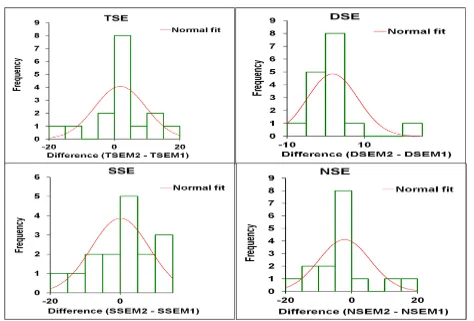
Figure 6 depicts the histograms of distribution of difference of means for the four types of stigma exsertion classes between
the two phenotyping methods, with the normal fit curve added. In all the four types, the distribution tended to be near normal.
DISCUSSION
The stigma exsertion is emphasized as a component increasing the opportunity of pollination (Kato and Namai 1987). Exserted stigmas remain viable up to 6 days with a decrease of 20% in seed set from cross pollination per day (Yan and Li 1987; Xu and Shen 1988). Consequently, the single and dual stigma exsertion types can play vital role in hybrid seed production. The current study on stigma exsertion types and comparison between two phenotyping methods for the trait has produced interesting results as described in the above section.
plots of rice stigma exsertion types (TSE: Total Stigma exsertion; DSE: Dual Stigma Exsertion; SSE: Single Stigma Exsertion and NSE: No Stigma Exsertion) scored by whole panicle method (Method 1) and panicle zone
International Journal of Current Research, Vol. 7, Issue, 03, pp.13123-13135, March,
two methods of phenotyping. All (100%) the scatter points of difference of means were lying within the lower and upper bounds (including 95% CI of upper and lower bounds) in all
Figure 6 depicts the histograms of distribution of difference of means for the four types of stigma exsertion classes between
methods, with the normal fit curve added. In all the four types, the distribution tended to be near normal.
The stigma exsertion is emphasized as a component increasing the opportunity of pollination (Kato and Namai 1987). Exserted main viable up to 6 days with a decrease of 20% in seed set from cross pollination per day (Yan and Li 1987; Xu and Shen 1988). Consequently, the single and dual stigma exsertion types can play vital role in hybrid seed production. gma exsertion types and comparison between two phenotyping methods for the trait has produced interesting results as described in the above section.
plots of rice stigma exsertion types (TSE: Total Stigma exsertion; DSE: Dual Stigma Exsertion; SSE: Single Stigma Exsertion and NSE: No Stigma Exsertion) scored by whole panicle method (Method 1) and panicle zone method (Method 2)
Phenotyping method
Yan et al. (2009) have summarized different observation techniques for stigma exsertion. According to them, stigma exsertion is affected by environmental conditions, so the number of sampled panicles should be reasonable for reliable estimate for a given genotype. In addition, maintaining the stigmatic characters with least distortion during handling for
the phenotyping also becomes a crucial consideration. Yan et al. (2009) removed five spikelets from each panicle whose
lemma and palea stayed open and stored in a tube containing formalin acetic acid for 24 h or more. For each accession, measurements were taken for a total of 75 spikelets. Uga et al. (2003a) collected a total of ten spikelets randomly from one to five plants in each accession and preserved them in aceto-alcohol for measurement of spikelet characteristics. For stigma exsertion phenotyping, Yan and Li (1987) sampled the maximum number of panicles, i.e., 24 per genotype, followed by 18 panicles by Yu et al. (2006a, b), 15 panicles by Virmani and Athwal (1973), 2 panicles by Miyata et al. (2007), 100 spikelets by Takano-Kai et al. (2011), 27 spikelets by Uga et al. (2003b), and 5 spikelets by Marathi et al. (2014). Most of these observations were made on the panicles when all spikelets finished flowering. Flowering from the beginning to the end in a panicle lasts 5 – 7 days (Yan and Li, 1987).
The phenotyping methods presented in this report are better over the earlier reported methods as our methods preserved the sampled panicles and spikelets from infection during storage
due to the use of fungicide and distortion during storage due to use of only water but not the fixatives containing acid-alcohol combinations. The latter is known to induce distortions during the storage period needed between collection and observation processes (Howat and Wilson 2014). The wrapping with moist paper towels and enclosing in plastic zip-lock bag, prevents moisture loss during cold storage. This improved preservation-cum-storage method provides for undistorted phenotyping even after a storage period of about 20 d.
Basic statistical parameters of stigma exsertion types
Though the minimum values for stigma exsertion varied from 0 to 13%, the maximum was in the range of 50 to 93% (Table 2) indicating that there was good amount of variability
[image:8.595.40.554.48.393.2]for the stigma exsertion types, and the selected genotypes represented vast variability available for the trait. This also leads to the inference that inspite of being parental lines of popular rice hybrids, probably not much attention was paid for selection towards high stigma exsertion during the development of these lines. KRH2, DRRH2 and DRRH3 are three of the popular rice hybrids involving IR25A, IR97A and APMS6A as parental lines of the three-line based hybrid production system. Moderate to low total stigma exsertion in these lines as indicated by their maintainer counterparts IR25B, IR97B and APMS6B, respectively, brings out the need for improving their stigma exsertion to address the hybrid seed producibility issues faced. As the first phase of such an Figure 5. Scatter-plots of difference of means and combined means for rice stigma exsertion types scored by the two methods of phenotyping (TSE: Total stigma exsertion; DSE: Dual stigma exsertion; SSE: Single stigma exsertion and NSE: No stigma exsertion)
exercise, high stigma exsertion trait can be introgressed in to these B lines and then horizontally transferred to their respective isogenic A lines. Mean values of TSE and DSE types, both perceived as important factors contributing towards better total exsertion, reveal that BF16B (84%) and BF96B (81%) could be used as good donors for improving the expression of the stigma exsertion trait (Table 5).
Analysis of Variance (ANOVA) for stigma exsertion types
The ANOVA with the methods of phenotyping as source of variation in the panicle zone method (Table 3) indicates that the differences of the four stigma exsertion types seen in the upper, middle and lower zones of the panicle were not significant. Thus, the mean values for the stigma exsertion types from these three zones can represent the value for the entire panicle as well. Hence, the zonal differences were ignored and averaged across the zones for each type of exsertion for further analyses. This in turn led to the sources of variation being common for both the methods, and so to combining the data from both the methods for the exsertion types. Using the combined data, ANOVA for the stigma exsertion types showed that differences due to genotype and its interactions with the methods and locations were the only significant sources of variation (Table 4). Though Yan et al. (2009) have stated that environment plays a crucial role in expression of the trait; our results demonstrate that genotype was the driving factor and the effects of methods and locations did not contribute significantly to the differences due to them. When comparing the CV value differences between the whole panicle method and the panicle zone method, the value was less in the former than in the latter. Hence, the whole panicle method had less experimental variation than the panicle zone method. However, it is no longer considered to be appropriate to use the CV to infer reliability of methods (Rankin and Stokes 1998).
Comparison of mean performance of the genotypes and their interactions with methods and locations clearly indicated that the performance of genotypes remained rather similar across methods and locations (Tables 5 and 6). At either of the locations and by any phenotyping methods, BF16B and BF96B exhibited significantly better stigma exsertion than others, while APMS6B, IR97B and IR25B displayed moderate to least expression. However, for NSE type, the maximum value was shown by APMS6B, while IR25B showed moderate, BF16B and BF96B showed minimum values. This is very much on expected lines as NSE exhibits strong negative relation with the other types of exsertion as indicated by the r and b values (Table 7). The genotypes BF16B and BF96B have not only very high total stigma exsertion (> 80%) but also high proportion of DSE (> 50%) (Figure 3a). The high proportion of DSE to SSE matters a lot in out crossing (Viraktamath, personal communication, 2014). So, the genotypes BF16B and BF96B come out strongly as outstanding donors for high TSE as well as higher proportion of DSE in TSE.
Interrelationship analyses
Correlation and Regression: TSE being a derived parameter
from the combination of DSE and SSE, showed strong association with both of them as indicated from strong r and b
values among them (Table 7). Moreover, the high negative association between TSE and NSE, both independently assessed parameters is also notable and is demonstrative of the fact that selection for TSE types can lead to a probable reduction in NSE. The association between DSE and SSE was moderate, and the larger b value of SSE with TSE (1.49) than with DSE (0.49) is indicative that contribution of SSE towards better TSE is higher than that of DSE.
As scientific analyses advance, new methods are introduced. Too often these new methods are simply introduced with little or no evaluation of how they match-up with what they are to replace. Comparison of a new measurement method with an established one is often needed to see whether they agree sufficiently for the one to replace the other. Therefore, it is important to measure the agreement of the new method with the method being practiced (Zaki et al., 2012).
Method agreement analyses
Stigma exsertion shows a predominant influence on the outcrossing rate in rice. However, the phenotyping methods reported so far are not systematic and well-compared. Therefore, there is a need for development of a phenotyping methodology that would provide accurate assessment for the trait with least amount of error. For certain traits, the phenotypic differences are easy to evaluate accurately; while for the stigma exsertion trait it is relatively complex. Additionally, owing to the possibility of error in evaluating parameters and other factors such as environmental effect, such traits are considerably more difficult to assess. For overcoming this problem, an attempt at comparative assessment of two of the stigma exsertion phenotyping methods has been made in the study presented here. The objective was to assess agreement between the two phenotyping methods for stigma exsertion trait in rice. Various statistical methods have been used to test for agreement of methods with quantitative or continuous outcomes. These involve comparison of means, correlation (r) and regression (b) coefficients, coefficient of determination (R2), intra-class correlation coefficient (rI) and
the difference between the means (Zaki et al., 2012).
Comparison of means: Lee et al. (1989) suggest that for a
good agreement there should be no statistically significant difference between means obtained by the two methods. Paired t-test is usually used to test the significant differences between the least square means of two sets of data, to assess the agreement. Comparison of least square mean values of the stigma exsertion types by the Student ‘t’ test points out that the difference in means determined by the two phenotyping methods was non-significant at P = 0.05, indicating that both the methods of phenotyping gave statistically equal means for the stigma exsertion types (Table 8A). However, the paired t-test with non-significant result need not indicate agreement, as the value of mean is affected by the value of each data point, leading to undue influence by extremely large or small values (Zaki et al., 2012).
Comparison of correlation (r) and regression (b) coefficients
and coefficient of determination (R2): The correlation
coefficient has been one of the favorite statistical methods to
13131 International Journal of Current Research, Vol. 7, Issue, 03, pp.13123-13135, March,2015
measure agreement (Zaki et al., 2012). In our study, significant and high r values were obtained between the two methods (Table 7), indicating apparently a good agreement between the two methods. However, high correlation need not imply close agreement, as correlation will tell us about the validity of the two methods, but not about their agreement and whether they can be used interchangeably (Bland and Altman 2003). Some people proceed to regression analysis as an extension to correlation analysis to answer the question of agreement. A better agreement is supposed to be reflected by the slope line being similar to the line of equality (Y = 0 + 1.0 X, i.e., b = 1), tested by non significance of difference between b of slope line and b = 1; and also significance of difference of slope line intercept from zero (Bland and Altman 2003). In our case, slope lines of TSE, SSE and NSE types did not differ significantly from line of equality and their intercepts were significantly different from zero (Table 8B), thereby indicating that there was strong agreement for TSE, SSE and NSE types between the two methods of phenotyping. For DSE type, though b was not significantly different from 1, its intercept differed non significantly from zero, owing to the heavy concentration of the difference points at the lower quantum of double stigma exsertion as brought out by both the phenotyping methods.
Here, the testing of equivalence of b values (b1 = b2), employing t or z test for the difference between the slopes, as a measure of agreement that is applicable only to two groups of independent samples (Paternoster et al. 1998) was not used. Some also use the coefficient of determination (R2) as a measure of agreement (Peterson and Douglass 2005). The R2 statistic, however, can be interpreted as an estimator of a population parameter only when the regressions are random (Helland 1987).
Intra-class Correlation Coefficients (ICC):Equality of means,
high degree of correlation and regression, are not enough to conclude agreement. Quantitative agreement in individual values can be measured by intra-class correlation (ICC, rI) or
alternatively by limits of disagreement (Indrayan 2013). ICC is used to assess agreement in some cases, so as to overcome some of the limitations of the correlation coefficient (r) (Zaki et al., 2012). In an agreement testing set up, if the two measurements obtained on same subjects by two methods agree then the ICC will be high. An ICC value of 1 represents perfect reliability with no measurement error, whereas 0 indicates no reliability (Rankin and Stokes 1998). When ICC is > 0.7, generally the agreement of methods is considered as good (de Vet et al., 2006). Cronbach’s alpha is the most widely used objective measure or index of reliability (the ability of methods to measure consistently); it provides a measure of internal consistency of methods (Tavakol and Dennick 2011). The ICC values calculated for the stigma exsertion types ranged from 0.70 to 0.94. As an ICC of rI = 0.75 is considered enough to
conclude good agreement, it can be inferred that the averages of stigma exsertion values recorded by the two phenotyping methods agree well with each other for all the four exsertion types. At the same time, the respective Cornbach’s alpha values were higher than 0.8 for all the types of stigma exsertion, thus bringing out high degree of reliability. This implies that the two
methods of phenotyping can be used interchangeably without affecting the outcome significantly.
In view of some evidences suggesting comparison of means, correlation coefficients, coefficient of determination, and regression coefficients are inappropriate for assessing agreement, Bland and Altman (1986) proposed a method to calculate the degree of agreement two methods of measurement, which has become the most popular method (Zaki et al., 2012).
Comparison of difference of means:The first step to evaluate
the difference is to plot the difference of means of the two methods (d) (Method 1 minus Method 2) versus the mean of the two methods [(Method 1 plus Method 2)/2]. Typically a maximum acceptable difference (MAD), i.e., what is the maximum difference between the methods that the researcher would consider acceptable if the new method is to be adopted, needs to be established a priori for evaluation of the difference between the two methods (Peterson and Douglass, 2005). If the methods are in agreement, this difference should be zero for every case. If these differences are randomly distributed around zero and none of the differences is large, then the agreement is considered good (Indrayan 2013).
Next, the mean and SD of these differences (SDd) are calculated and then the mean difference ± 1.96xSDd. Statistically, when the two methods are measuring the same variable, then the difference (d) is mostly measurement error which is known to follow a Gaussian distribution (Indrayan 2013). So, it is expected that 95% of differences between measurements by two methods should lie between these limits called the limits of agreement. The 95% individual difference (d) points should be within the MAD prediction belt.
The 95% limits of agreement depend on certain assumptions about the data: that the mean and SD of the differences are constant throughout the range of measurements, and that these differences are from an approximately normal distribution. To check these assumptions, two plots, viz., a scatter diagram of the difference against the average of the two measurements and a histogram of the differences are generated (Bland and Altman 2003). Residual variances are reported to assess the precision of each method (Peterson and Douglass 2005).
The exercise of Bland and Altman method agreement analyses brought out that for all the four stigma exsertion types, the agreement was quite close (Table 8D and Figures 6, 7). TSE type, between the two methods had a mean difference (d) of 1.82 with 7.8 SDd (Table 8D). At 95% probability, the upper and lower bounds were 17.15 and -13.51, respectively. Similar trend was observed for the rest of the three stigma exsertion types as well. The range between the upper and lower bounds with 95% confidence interval was not very wide considering large values of CV for the four exsertion types (Tables 3, 4 and 8D). In addition, 100% of the difference points fell between the upper and lower bounds with 95% confidence interval (Figure 5). Further, the distribution of the differences for all the four types was near normal as shown by the histograms (Figure 6), ruling out any significant bias.
Even though means from the two methods were nearly equal (Table 8A) and r value was notably high (Table 8B), the limits of agreement ranged from 13% for DSE to 17% for NSE (Table 8D). However, the d values lie within the agreement belt (with 95% confidence interval) and are scattered on both sides of the zero difference line (Figure 5), hence conveying a good agreement between the two phenotyping methods for all the stigma exsertion types studied. The wide confidence intervals (up to 17%) observed can be attributed to small sample size (Bland and Altman 1990).
Thus, the two phenotyping methods showed considerably high degree of agreement for all the counts of method agreement analyses parameters, leading to inference that any of the two methods can be adopted for phenotyping stigma exsertion trait quantitatively.
Having shown this, choice of the phenotyping method out of the two studied herein, can be influenced by other logistic considerations such as efficiency of resource utilization.
Resource utilization
Resource availability and utilization are the two aspects distinguishing these two phenotyping methods from each other. As mentioned earlier, panicle zone method requires only five randomly chosen spikelets from each zone, i.e., only 15 spikelets are to be scored per panicle. Whereas, in the whole panicle method all spikelets from the whole panicle have to be
scored. Consequently, for phenotyping stigma exsertion trait in ricepe, the panicle zone method would require substantially less time and human resource than the whole panicle method; thus making the panicle zone method the method of choice for phenotyping.
Conclusion
In several popular rice hybrids, the parental lines such as APMS6B, IR97B and IR25B have lot of scope for improvement in their stigma exsertion trait. The rice genotypes BF16B and BF96B are outstanding donors for high total stigma exsertion trait along with high proportion of DSE, one of the important features aiding in higher out-crossing.
[image:11.595.66.540.51.372.2]Several features have emerged from this study concerning methodologies for stigma exsertion phenotyping in rice. One of the features includes improvement in sample processing and storage of panicles. Following our practices, the panicles could be sorted for longer periods of time (up to 15 – 20 d) without any deterioration in spikelet characters. This allows for accurate phenotyping of stigma exsertion type even after long term storage. In addition, the whole panicle and the panicle zone methods can be employed interchangeably due to their high degree of method agreement. However, ultimate choice of the method to use would depend upon efficient utilization of resources. From this point of view, the panicle zone method could be the choice of phenotyping method for quantitatively assessing the stigma exsertion types.
Figure 6. Histograms of difference of means for rice stigma exsertion types scored by two methods of phenotyping (M1: Whole panicle method; M2: Panicle zone method); TSE: Total stigma exsertion; DSE: Dual stigma exsertion; SSE: Single stigma exsertion
and NSE: No stigma exsertion)
13133 International Journal of Current Research, Vol. 7, Issue, 03, pp.13123-13135, March,2015
Acknowledgement
The authors are thankful for the guidance and support provided by Dr. Viraktamath (former Project Director, DRR) and Mr. Dinesh Joshi (former Executive Director, BF) during the course of the study. We are also grateful to Drs. K. Govinda Raj, R. Nirmala, and W.H. Freeman, and the invaluable support from the BF management. This work is part of a collaborative project funded by the Department of Biotechnology (DBT), Government of India (BT/PR13466/AGR/02/700/2010), and is thankfully acknowledged.
REFERENCES
Analyse-it. 2009. Analyse-it for Microsoft Excel (version 2.20). Analyse-it Software, Ltd. http://www.analyse-it.com/
Azzini L.E. and Rutger J.N. 1982. Amount of out crossing on different male steriles of rice. Crop Sci., 22: 905–907 Bland J.M. and Altman D.G. 1986. Statistical methods for
assessing agreement between two methods of clinical measurement. Lancet i: 307–310
Bland J.M. and Altman D.G. 1990. A note on the use of the intra-class correlation coefficient in the evaluation of agreement between two methods of measurement. Computational Biol. Med., 20. 5. 337-340
Bland J.M. and Altman D.G. 2003. Applying the right statistics: analyses of measurement studies. Ultrasound Obstet Gynecol 22: 85–93
de Vet H.C.W., Terwee C.B., Knol D.L. and Bouter L.M. 2006. When to use agreement versus reliability measures. Journal of Clinical Epidemiology, 59: 1033–1039
FAO. Food and Agriculture Organization. . 2004. Rice is life. International Year of Rice. Rome, Italy
Helland IS. 1987. On interpretation and use of R2 in regression analysis. Biometrics, 43: 61-69
Indrayan A. 2013. Limits of Disagreement and the Intra-class Correlation. Chapter 2 in Doi SAR and Williams GM. eds.. , Methods of Clinical Epidemiology, Springer Series on Epidemiology and Public Health, Springer-Verlag Berlin Heidelberg pp 17-27
INGER (International Genetic Evaluation of Rice). 1996. Standard Evaluation System for Rice. 4th Edition. International Rice Research Institute (IRRI), Manila, Philippines. p 6
IRRI (International Rice Research Institute). 2007. Crop Stat for Windows version 7.2.2007.3. Int’l Rice Research Institute, Manila, Philippines.
Kato H and Namai H. 1987. Floral characteristics and environmental factors for increasing natural out crossing rate for F1 hybrid seed production of rice Oryza sativa L.
Jpn J Breed, 37: 318–330.
Lee J, Koh D, and Ong CN. 1989. Statistical evaluation of agreement between two methods for measuring a quantitative variable. Comput. Biol. Med., 19: 61-70 Marathi B. Ramos J, Hechanova SL, Oane RH and Jena KK.
2014. SNP genotyping and characterization of pistil traits revealing a distinct phylogenetic relationship among the species of Oryza. Euphytica. DOI 10.1007/s10681-014-1213-2
Miyata M, Yamamoto T, Komori T and Nitta N. 2007. Marker assisted selection and evaluation of the QTL for stigma exsertion under japonica rice genetic background. Theor Appl Genet., 114: 539–548
Paternoster R, Brame R, Mazerolle P and Piqueroa A. 1998. Using the correct statistical test for the equality of regression coefficients. Criminology, 4: 859-866
Peterson AB and Douglass LW. 2005. Adopting new techniques: Statistical procedures to determine the agreement between two laboratory methods. SAS Conference Proceedings. Portland, USA, September 11-14, 2005 pp 13
Ramesha MS, Ahmed MI, Viraktamath BC, Vijayakumar CHM and Singh S. 1998. New cytoplasmic male sterile lines with diversified CMS source and better outcrossing traits in rice. IRRN 23(2): 5
Rankin G and Stokes M. 1998. Statistical analysis of reliability studies. Clinical Rehabilitation, 12: 187-99
Sheeba A, Vivekanandan P and Ibrahim SM. 2006. Genetic variability for floral traits influencing out crossing in the CMS lines of rice. Indian J Agric Res., 40 (4): 272 – 276 Sidharthan B, Thiyagarajan K and Manonmani S. 2007.
Cytoplasmic male sterile lines for hybrid rice production. J Appl Sci Res., 3: 935–937
Singh AK, Khera P, Priyadarshi R, Patil V, Dhasmana M and Shenoy V. 2012. Occurrence of trifid stigma morphotype in a maintainer line of rice. (Oryza sativa L.). Intl J Pl Breed Genet., 6(4): 252-255
Singh S, Madhavi Latha K and Ilyas Ahmed M. 2006. Genotypic differences for flowering behaviour in different varietal types in rice. (Oryza sativa L.). Indian J Crop Science,1(1-2): 203-204
SPSS. (Statistical Package for Social Sciences). 2007. SPSS for Windows, Version 16.0, Released 2007. SPSS Inc., Chicago, USA
Takano-Kai N, Doi K and Yoshimura A. 2011. GS3 participates in stigma exsertion as well as seed length in rice. Breeding Science, 61: 244–250
Tavakol M and Dennick R. 2011. Making sense of Cronbach’s alpha. International Journal of Medical Education, 2: 53-55
Uga Y, Fukuta Y, Cai HW, Iwata H, Ohsawa R, Morishima H and Fujimura T. 2003a. Mapping QTLs influencing rice floral morphology using recombinant inbred lines derived from a cross between Oryza sativa L. and Oryza rufipogon Griff. Theor Appl Genet., 107: 218–226
Uga Y, Fukuta Y, Ohsawa R and Fujimura T. 2003b. Variations of floral traits in Asian cultivated rice. Oryza sativa L. and its wild relatives. O. rufipogon Griff. Breed Sci., 53: 345–352
Virmani SS and Athwal DS. 1973. Genetic variability in floral characteristics influencing out crossing in Oryza sativa L. Crop Sci., 13: 66–67
Virmani SS. 1994. Heterosis and hybrid rice breeding. Monograph Theor Appl Gent. 22. Springer-Verlag
Williams LJ and Abdi H. 2010. Fisher's Least Significant Difference. LSD. Test. In: Salkind N. Ed.. , Encyclopedia of Research Design. Thousand Oaks, CA, USA. pp 6 Xu YB and Shen ZT. 1988. Receptivity of exserted stigma.
Int’l Rice Res Newsl. 13(3): 7–8
Xu YB. 2003. Developing marker-assisted selection strategies for breeding hybrid rice. In: Janick J. Ed. Plant breeding reviews. ISBN0–471-35421-X 23:73–174. Wiley, New York, USA.
Yan WG and Li SF. 1987. Study on out-crossing characteristics among male sterile lines containing same nucleus in rice. Hybrid Rice. 4: 8–11
Yan WG, Li Y, Agrama HA, Luo D, Gao F, Lu X and Ren G. 2009. Association mapping of stigma and spikelet characteristics in rice (Oryza sativa L). Mol Breeding, 24: 277–292
Ying C and Zang S. 1989. Studies on the character of stigma exsertion among some of Oryza species. Chinese J Rice Sci., 3(2): 62-69
Yu J, Pressoir G, Briggs W, Vroh BI, Yamasaki M, Doebley JF, McMullen MD, Gaut BS, Nielsen DM, Holland J, Kresovich S and Buckler ES. 2006a. A unified mixed-model method for association mapping that accounts for multiple levels of relatedness. Nat Genet., 38: 203–208
Yu XQ, Mei HW, Luo LJ, Liu GL, Zou GH, Hu SP, Li MS and Wu JH. 2006b. Dissection of additive, epistatic and Q 9 E interaction of quantitative trait loci influencing stigma exsertion under water stress in rice. Acta Genetica Sin., 33(6): 542–550
Yuan LP and Fu XQ. 1995. Technology of hybrid rice production. Food and Agriculture Organization of the United Nations, Rome, Italy
Yuan LP. 1981. Hybrid rice. United States patent and trademark office 4305225
Zaki R, Bulgiba A, Ismail R and Ismail NA. 2012. Statistical methods used to test for agreement of medical instruments measuring continuous variables in method comparison studies: A systematic review PLoS ONE 7(5): e37908. doi:10.1371/journal.pone.0037908
Zetian, H. and Yanrong W. 2010. Advances in japonica hybrid rice breeding. In: Accelerating Hybrid Rice Development, IRRI, Manila, Philippines, pp 139–149
*******
13135 International Journal of Current Research, Vol. 7, Issue, 03, pp.13123-13135, March,2015