© 2019, IRJET | Impact Factor value: 7.211 | ISO 9001:2008 Certified Journal | Page 2280
A Comparative Study of Design of Dam
Priyadarshini Maitra
1, Rajashree Lodh
21
B.Tech, Dept. of Civil Engineering, Heritage Institute Of Technology, W.B, India
2
Asst. Professor, Department of Civil Engineering, Heritage Institute of Technology, Kolkata, India
---***---Abstract
-A gravity dam is an obstruction usually built across a river in which all the major forces if acting on it including the water pressure, uplift pressure, earthquake forces, silt pressure, ice pressure, wave pressure are resisted by the self weight of the dam itself. This implies that concrete (type, grade, etc) is the factor playing the most important role in maintaining the stability and safety of the dam. Researchers have spent years in finding theories to design a dam which will stand the test of time. The goal of this paper is to compare, whether a dam designed solely on the basis of theoretical concepts stand safe in the practical field. A study area has been considered for comparison of the theoretical design of dam with the practical values. Kangsabati Dam is a dam located in the Mukutmanipur district of Bankura whose prime values such as design flood level, R.L of the top and bottom of dam, unit weight of material used have been considered.Key Words: Base width, drainage gallery, gravity Dam, Kangsabati Dam, upstream slope.
1.
INTRODUCTION
A gravity dam relies mostly on concrete for providing resistance to external forces. A gravity dam has to be designed in such a way it is safe in tension, compression, sliding, overturning and in shear friction factor. An elementary dam profile differs from a practical profile in certain ways. A practical dam profile considers a certain top width for construction of road over the dam, as well as a freeboard to prevent spilling of water over the maximum waterlevel (M.W.L). Both the freeboard, and the top width are assumed, and checked if it holds true for the safety of the dam. A certain slope is provided on the upstream side and downstream side, as the direct water pressure is always greater than the inclined water pressure which gets divided into vertical and horizontal water pressure components. A trial and error method is used to check whether the upstream and downstream slope provided makes the dam stable. The main criteria of dam design is to check that tension is developed at any point in the dam, and the resultant remains near the outer-third point for full reservoir condition and near the inner-third point for the empty reservoir condition.
The data collected from Kangsabati Dam is used to design a dam in the most practical way possible using these theoretical concepts and an optimum dam section is found out. The stability of the dam section is further examined. Finally, the main aim of this paper is served to compare the dam so designed with the existing practical values of Kangsabati Dam.
2. OBJECTIVE AND SCOPE OF WORK
The main objective is to design a concrete gravity dam considering all the design parameters involved, using data collected for Kangsabati Dam and check it’s stability. The dam so designed on the basis of theoretical concepts, the theoretical results so obtained are compared with the practical design of Kangsabati Dam.
3. LITERATURE SURVEY
As stated before, study of dam has covered a vast area of research in the field of civil engineering. The design of dam, the failure modes of dam, the seismic effect on dam, the effect of uplift pressure on dam, have been a matter of concern for researchers.
An experimental study was conducted by Pina et.al for the study of failure of a gravity dam on a jointed rock foundation to compare the experimental results with the analytical or theoritical ones.[1]
Ghanaat investigated the “Failure Modes Approach To Safety Evaluation Of Dams”. He evaluated the seismic performance of gravity dams with the help of analysis-both linear elastic and non-linear, of the different failure modes that are formed in a dam. This method outstripped the conventional method of conducting the stress checks alone where the magnitude of stress used to be the base for the measurements.[2]
© 2019, IRJET | Impact Factor value: 7.211 | ISO 9001:2008 Certified Journal | Page 2281
find the maximum drainage reduction factor and as a result the position where the seepage discharge entering the gallery is highest. [3]Mansouri et.al. conducted a fracture analysis of concrete gravity dam under earthquake induced loads and made it clear that as stress increases, inelastic strains come into play and concrete becomes soft.[4]
Salmasi found the procedure to design a dam with the help of genetic algorithm. He found in his procedure that an optimum dam section has base width to height ratio of 0.85 and the ratio of top width to height as 0.13. [5]
4. PROBLEM DEFINITION
Data collected about Kangsabati Dam:
Design flood level= 135.63m
Height of the dam= 41.15m
R.L of bottom of the dam= 135.63-41.15=94.48m
Unit Weight of concrete= 24KN/m3 (P.C.C)
Assuming free board to be 3m, since we do not have the wave height and other factors for calculation of free board.
R.L of top of dam= 135.63+3=138.63m
In order to find out whether Kangsabati dam is a low gravity or high gravity dam, we use the formula :
Therefore,
Since H1 is greater than the height of Kangsabati Dam, we can state that it is a low gravity dam.
Top Width required = a =
Base Width required = or
Projection on the upstream side from the vertical face = 2.6m (assumption)
Total Base Width provided = 34.77+2.6= 37.37m
The upstream sloping starts at a depth of
from below the M.W.L.
Slope on downstream side = 28.36(H):33.57(V) = 0.84:1
© 2019, IRJET | Impact Factor value: 7.211 | ISO 9001:2008 Certified Journal | Page 2282
6.41
3
15.1
7
25.9
8
41.1
5
7.5
8
33.5
7
28.36 R.L=94.48
R.L=135.63
R.L=138.63
2.6
37.37 6.24
[image:3.595.52.550.50.475.2]Drainage Gallery(1.8x2.4)
Fig 5.4: Side view of the dam designed
10098
10.
5
8
33.
5
[image:3.595.73.523.497.699.2]7
Fig 5.5: Front View of the dam
Force Calculations
Weight of Dam Calculation
W1
=6,792.036
31.57 2,14,424.57
W2
=11,424.54
18.91 2,16,038.09
W3
=810.88
35.64 28,899.76
© 2019, IRJET | Impact Factor value: 7.211 | ISO 9001:2008 Certified Journal | Page 2283
Water Pressure CalculationDesignation
Vertical Water
Pressure Pv1
=337.87
36.50 12,332.26
Pv2
=394.16
36.07 14,217.35
(+)∑V2=732.03 (+)∑M2=26,549.61
Horizontal Hydrostatic
Pressure PH
=8466.61
13.72 116161.88
(-)∑H1=8466.61 (-)∑MH1=116161.88
Uplift Pressure when there is no drainage gallery
37.37m
[image:4.595.208.364.369.459.2]
411.5KN/m2
Fig 5.6: Uplift pressure diagram when no drainage gallery is provided
Uplift pressure= KN/m2
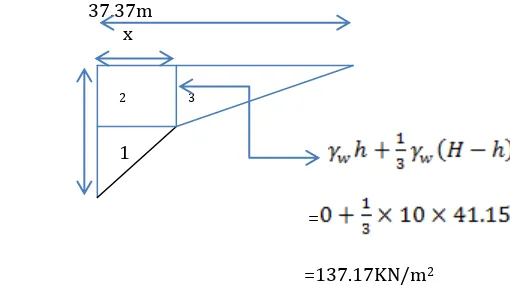
Uplift Pressure with drainage gallery
37.37m x
411.5KN/m2 2 3
1
=
[image:4.595.190.445.552.695.2]=137.17KN/m2
Fig 5.7: Uplift pressure diagram when drainage gallery is provided
It has been found from experience and observation that drainage gallery should be towards the left, with optimum
© 2019, IRJET | Impact Factor value: 7.211 | ISO 9001:2008 Certified Journal | Page 2284
Hence the optimum position of drainage gallery for Kangsabati dam is approximately found to beUplift Pressure Calculation
Designation )
U1
=855.91
35.29 30,205.06
U2
=855.94
34.25 29,315.95
U3
=2,135.05
20.75 44,302.28
(-)∑V3=3846.9 (-)∑M3=1,03,823.29
Earthquake Forces
Horizontal acceleration (αh) is assumed as 0.1g and vertical acceleration (αv) as 0.05g.
Horizontal Earthquake Forces
Designation Force Calculation(KN) Lever Arm(m) Moment(KNm)
PW1 0.1W1
=0.1×6,792.036 =679.20
22.075 14993.34
PW2 0.1W2
=0.1×11,424.54 =1,142.45
11.19 12,784.02
PW3 0.1W3
=0.1×810.88 =81.09
8.66 709.254
(-)∑H2=1902.74 (-)∑MH2=28,486.614
Vertical Earthquake Forces
Designation Force(KN) Moment(KNm)
Pev 0.05×∑V1
=0.05×19,027.46 =951.37
0.05×∑M1
=0.05×4,59,362.83 =22,968.14
© 2019, IRJET | Impact Factor value: 7.211 | ISO 9001:2008 Certified Journal | Page 2285
Horizontal Hydrodynamic Pressure
Pe (-)∑H3=866.67 (-)∑MH3=14,693.35
When the self weight, water pressure, uplift and earthquake force is considered.
V=V1+V2-V3-V4
=19,027.46+732.03-3846.9-951.37=14,961.22KN
∑H= H1+H2+H3
=-8466.61-1902.74-866.67=-11,236.02KN
∑M=M1+M2−MH1−M3 – MH2−M4−MH
=4,59,362.83+26,549.61−1,16,161.88−1,03,823.29−28,486.614−22,968.14−
=1,99,779.17KNm
Pmax/min=
Pv at toe=744.65KN/m2<3000(safe)
Pv at heel=56.05KN/m2<3000(safe)
The allowable compressive stresses are not exceeded, hence safe in compression.
© 2019, IRJET | Impact Factor value: 7.211 | ISO 9001:2008 Certified Journal | Page 2286
0.7056); where tanα=0.84=1270.07KN/m2<3000 (Safe)
Principal stress at heel=
; where tanφ=0.1
=56.61KN/m2<420 (Safe)
Shear stress at toe=
=625.51KN/m2
Shear stress at heel=
=5.61KN/m2
Checks
Factor of safety against overturning =
FOS= (safe)
Factor of safety against sliding =
FOS= 1(Safe)
Shear friction factor =
S.F.F=0.7×
=5.5>3(Hence, safe)
Pile foundation :
From the above design analysis
Length of base width = 37.37 m
Total vertical weight of gravity dam =
Total vertical uplift pressure on dam =
Total vertical Earthquake force on dam =
Now , the total vertical force applied by the dam on the base of foundation
=
© 2019, IRJET | Impact Factor value: 7.211 | ISO 9001:2008 Certified Journal | Page 2287
Design of pile foundationTaking F.O.S = 2
Design load =
Kangsabati Dam built over the soil , whose the soil properties are –
Adhesion factor (á) = 0.75
Cohesion factor (ć) = 145 kpa
Ultimate bearing capacity of single pile
Where ,
and,
For group piling ultimate bearing capacity
Taking the diameter of pile ( D ) = 2m
And , , ,
Ultimate load bearing of group
Therefore , design load = 34206.62 ⨯ 10 per 10m length of dam =
length of pile
For group pile failure check:
KN
Therefore , ( safe )
© 2019, IRJET | Impact Factor value: 7.211 | ISO 9001:2008 Certified Journal | Page 2288
5. RESULTS AND DISCUSSIONS
1) After certain trials, it has been found that the base width that has been obtained is nearly equal to 38m, which is the actual base width of Kangsabati Dam.
2) In the dam section that has finally been designed, the ratio of base width to height of dam is nearly equal to 0.85 as should be in an optimum dam section. Also, the ratio of top width to height of dam is also nearly equal to 0.13. Thus, we can safely assume that the upstream side slope can be 1 in 10.
3) For practical considerations, the downstream slope has not been reduced.
6. CONCLUSION
The main aim of the project was to compare the values obtained by the theories provided by researchers to design a dam with a dam existing in real life proven to stable. This particular dam section designed above, not only proves that a dam designed on the basis of theoretical considerations can be used in the practical field, but it also stands stable against tension, compression, sliding, overturning and shear friction. It can be concluded that an optimum dam section has ratio of base width to height of dam nearly about 0.85 and ratio of top width to height about 0.13. Also, the best position for the drainage gallery in a gravity dam is at 0.167 times the base width of the gravity dam. To prevent settlement of the dam, a pile foundation has been designed as well.
7. REFERENCES
C.A.B. Pina, C.P. Costa, J.V. Lemos, J.M.P. Gomes(1993), An experimental study of failure of a gravity dam on a jointed rock foundation, Transactions on Modelling and Simulation,Vol 5,1993.
Yusof GHANAAT (2004),Failure modes approach to safety evaluation of dams, 13th World Conference on Earthquake Engineering Vancouver, B.C., Canada August 1-6, 2004 Paper No. 1115.
Uday A.M and Hasan H.M (2016), Optimal Location of Drainage Gallery Under Gravity Dam by using Finite Element Method,International Journal of Multidisciplinary Research and Modern Education (IJMRME),Volume II, Issue I, 2016.
Abbas Mansouri, Mir Ahmad Lashteh Neshaei, Reza Aghajany (2011). Fracture analysis of concrete gravity dam under earthquake induced loads, Journal of Applied Sciences and Environment Management June, 2011 Vol. 15 (2) 317 – 325.