ANALYTICAL METHOD DEVELOPMENT AND VALIDATION OF
ILAPRAZOLE IN PHARMACEUTICAL DOSAGE FORMS
Shital S. Patil*, Sheetal V. Patil, Rupali S. Wagh, Dr. S.D. Barhate
Shree Sureshdada Jain Institute of Pharmaceutical Education and Research, Jamner-424106.
ABSTRACT
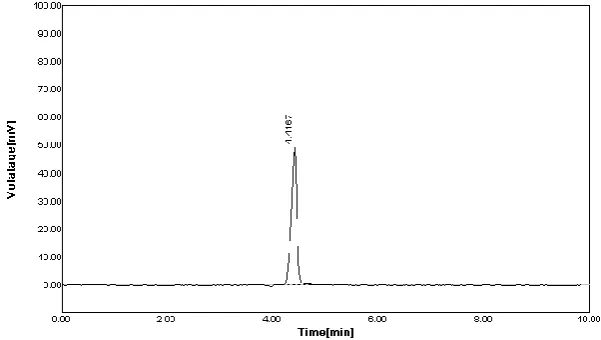
A simple, rapid, accurate and precise RP-HPLC method was developed and validated for the estimation of Ilaprazole in pharmaceutical dosage form. Chromatographic separation was carried out by using Hypersil BDS C18 (4.6 x 250 mm) column using a mobile phase consisting of a mixture of Methanol: Water 70:30 pH-3.0 with anhydrous disodium hydrogen phosphate buffer by using an isocratic elution. The following system conditions were maintained throughout development and validation i.e., flow rate 1.0 ml/min, column was maintained at room temperature and the detected by a UV wavelength 237 nm. The Ilaprazole was well resolved and detected at 237nm with retention time 4.4 minutes. Ilaprazole was shown to be linear over a range of 5-25 µgm/ml. The method was validated as per ICH guidelines.
KEYWORDS: Ilaprazole, RP-HPLC, Method validation and C18 Column. W
INTRODUCTION
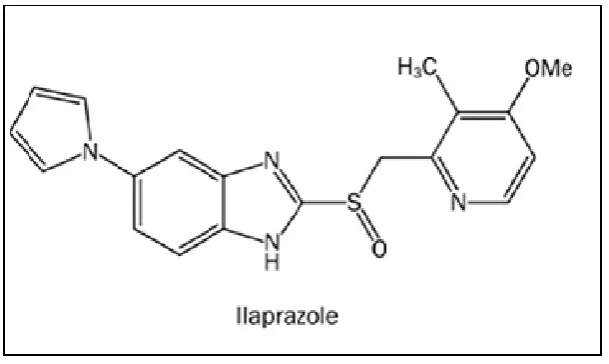
Ilaprazole[-[(4-methoxy-3-methyl-pyridin-2-yl)methylsulfinyl]-6-pyrrol-1-yl-1H
-benzoimidazole], a substituted benzimidazole, is a new candidate drug that is an H+/K+ -ATPase inhibitor designed for the treatment of gastric ulcers.[1, 2] Ilaprazole was under development by IIYang Pharmacy Co (Seoul, Korea) and has been proven by a series of animal studies to be a potent and safety antiulcer agent. Seung-Woon Myung et al found two metabolites of Ilaprazole using liquid chromatography/tandem mass spectrometry (LC/MS/MS) in rat plasma, the major one being Ilaprazole sulfone.[3] Recently, a new metabolite of Ilaprazole, Ilaprazole thiol ether, was identified.
Volume 3, Issue 4, 1569-1576. Research Article ISSN 2277 – 7105
Article Received on 29 April 2014, Revised on 20 May 2014,
Accepted on 10 Jun 2014
*Correspondence for
Author
Shital S. Patil
Shree Sureshdada Jain Institute
of Pharmaceutical Education
Quantification of drugs in biological matrices by LC/MS/MS is becoming an increasingly common technology today due to the improved sensitivity and selectivity of these methods. Li et al reported that Ilaprazole was metabolized by CYP3A5 and CYP2C9 in Chinese healthy subjects using a LC-MS/MS method to determine Ilaprazole and Ilaprazole sulfone concentrations. [4] B. Satheesh et al reported a stability indicating UPLC method was developed and validated for simultaneous determination of Ilaprazole and its impurities in tablets.[5] The proposed RP HPLC method was found to be sensitive, accurate and precise for determination of Ilaprazole in tablets. The method utilizes easily available and cheap solvent for analysis of Ilaprazole hence the method was also economic for estimation of Ilaprazole from tablet dosage form. Hence it can be conveniently adopted for routine quality control analysis of the drugs in pharmaceutical formulation.
Figure 1 Chemical structure of Ilaprazole
MATERIAL AND METHODS Reagents and Chemicals
Ilaprazole bulk powder was gifted by Lupin Pharmaceuticals Ltd. Aurangabad, Maharashtra, India. Tablets of Ilaprazole were purchased from local pharmacies. Purified water was obtained from Millipore system. Methanol (HPLC grade) was obtained from E-Merck. All other chemicals used in the analysis were AR grade.
Instrumental and analytical conditions
EXPERIMENTAL
Preparation of standard stock solution
10.0 mg of Ilaprazole was weighed accurately and transferred into a clean, dry 10ml volumetric flask. 5 ml of Methanol was added and sonicated to dissolve. Volume was
adjusted to 10 ml with diluents.
Selection of detection wavelength
The standard solution of Ilaprazole was scanned over the range of 200 nm to 400 nm wavelengths. From overlay spectra, 237nm wavelength was selected for the determination of Ilaprazole.
Selection of mobile phase
The mobile phase was selected on the basis of best separation, peak purity index, peak symmetry, theoretical plate etc. So no. of trials was taken for the selection of mobile phase. So also for this Ilaprazole, the same mobile phase in different ratio was used to optimize best result. Also different solvent mixtures were used to optimize best result.
Assay
Weigh 20 tablets and determine average net content of blend. Accurately weigh and transfer quantity of tablet contents equivalent to about 10.0 mg of Ilaprazole into 10 ml amber colored volumetric flask. Add 10ml of Methanol and sonicated for about 20 minutes. Dilute to volume with Methanol and mix. Filter resulting solution with what man’s filter paper
discarding first few ml of filtrate. Further dilute 0.25 ml of this solution to 10.0 ml with mobile phase and mix.
[image:3.595.149.450.557.727.2]METHOD VALIDATION
The proposed method has been developed and validated for the determination of Ilaprazole in pharmaceutical dosage forms. According to International Conference on Harmonization (ICH) guidelines, validation of the method was carried out by using accuracy, linearity, LOD, LOQ, precision, ruggedness and robustness, and system suitability parameters.
System suitability
A standard solution was prepared by using Ilaprazole working standards as per test method and was injected 5 times into the HPLC system. The system suitability parameters were evaluated from the USP tailing and USP plate count values obtained from standard chromatograms.
System Suitability Component Parameter Ilaprazole
Retention times (RT) min 4.4
Theoretical plates (N) 8007.5
Tailing factor (AS) 0.9375
Slope 14.1
Intercept 1.3
Coefficient of variance 0.999
Linear range 5-25 mg/ml
Linearity of test solution
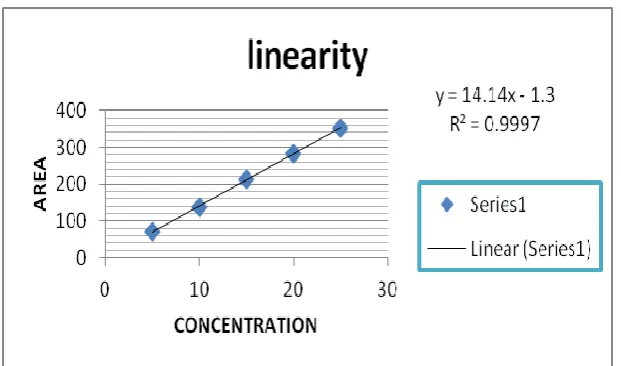
[image:4.595.144.455.563.746.2]A series of solutions were prepared from standard stock solution at concentration levels from 5-25μg/ml for Ilaprazole. The linearity of the method was determined for the formulation at five concentration levels ranging from 5-25 µgm/ml Ilaprazole. The equation for regression line was y = 14.14x-1.3 R² = 0.999 for Ilaprazole.
Table 1 Linearity of Ilaprazole by RP-HPLC method
Sr No. Concentration (µgm/ml) Area I II Mean area
1 5 71.94 71.71 71.825
2 10 137 138 137.5
3 15 212 213 212.5
4 20 282 283 282.5
5 25 348 356 352
Recovery study
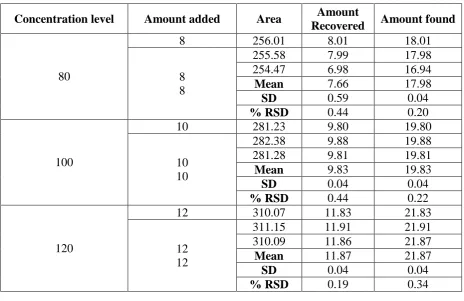
The recovery studies were carried out at three levels of 80, 100 and 120% and the percentage recovery was calculated and presented in Table 2.
Accuracy
The accuracy of the method was determined by recovery experiments. Drug assay was performed in triplicate as per test method with equivalent amount of drugs into each volumetric flask for each spike level to get the concentration of drugs equivalent to 80%, 100% and 120% of the labelled amount as the test method.
Table 2 Accuracy and Recovery
Concentration level Amount added Area Amount
Recovered Amount found
80
8 256.01 8.01 18.01
8 8
255.58 7.99 17.98
254.47 6.98 16.94
Mean 7.66 17.98
SD 0.59 0.04
% RSD 0.44 0.20
100
10 281.23 9.80 19.80
10 10
282.38 9.88 19.88
281.28 9.81 19.81
Mean 9.83 19.83
SD 0.04 0.04
% RSD 0.44 0.22
120
12 310.07 11.83 21.83
12 12
311.15 11.91 21.91
310.09 11.86 21.87
Mean 11.87 21.87
SD 0.04 0.04
% RSD 0.19 0.34
Precision
solution used, which was prepared from working standard solution for six replicate injections. This was analyzed for intraday precision and inter-day precision. Observation is shown in the [Table 3] which reveals that %RSD is well within the given criteria of 2%.
Table 3 Repeatability of Ilaprazole by RP-HPLC method
Sr No. Conc. Area II III Mean SD %RSD
1 10 138.58 137.13 136.98 137.56 1.03 0.75 2 15 215.41 213.87 215.37 214.88 0.88 0.41 3 20 285.52 282.95 284.63 284.37 1.31 0.46
Limit of Detection and Limit of Quantitation
The parameters LOD and LOQ were determined on the basis of standard deviation and slope of the regression equation as per International Conference on Harmonization (ICH) guidelines.
Limit of detection (LOD)
As per guideline detection limit can be calculated by using the formula: LOD = 3.3xσ/S
Where, ‘σ’ is the standard deviation of response, and ‘S’ is the Slope of the calibration curve.
LOD of the method is given in the [Table 4].
Limit of Quantitation (LOQ)
As per guideline Quantitaion limit can be calculated by using the formula: LOQ = 10 xσ /S
Where, ‘σ’ is the standard deviation of response, and ‘S’ is the Slope of the calibration curve.
[image:6.595.153.447.595.686.2]LOQ of the method is given in the [Table 4]
Table 4 LOD and LOQ of Ilaprazole
Sr No. Conc. Area I II III %RSD
1 6 67 67.5 68 0.74
2 8 99 99.5 100 0.5
3 10 131 130.5 130 0.38
4 12 163.2 163.6 164 0.24 5 14 190.4 190.7 191 0.16
Robustness
Table 5 Robustness of Ilaprazole by RP-HPLC method
Parameters Variations Area T.P. T.F.
Mobile phase
69:31 210.2 9256 0.8500
71:29 211.78 9321.5 1.0000
70:30 213.26 8007.3 0.9375
MEAN 211.75
SD 1.53
%RSD 0.72
Flow rate change
0.9 222.77 11016.2 0.9375
1.0 223.77 11086.9 0.8889
1.1 221.37 11037.4 0.9476
MEAN 222.63
SD 1.22
%RSD 0.55
Wavelength
235 222 9397.4 0.9286
237 223 8007.3 0.9375
239 225 8937.6 0.9189
MEAN 223.33
SD 1.53
%RSD 0.68
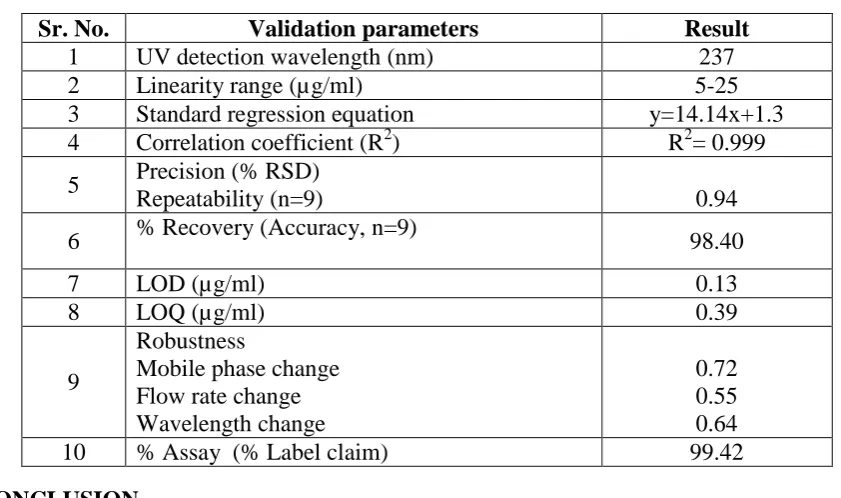
RESULTS AND DISCUSSION Table 6 Result and discussion
CONCLUSION
The method describes the quantification of ilaprazole in tablet dosage form. The validation data demonstrate good precision and accuracy which proves the reliability of proposed method. Hence this method can be used routinely for quantitative estimation of Ilaprazole in solid dosage forms.
Sr. No. Validation parameters Result
1 UV detection wavelength (nm) 237
2 Linearity range (µg/ml) 5-25
3 Standard regression equation y=14.14x+1.3 4 Correlation coefficient (R2) R2= 0.999 5 Precision (% RSD)
Repeatability (n=9) 0.94
6 % Recovery (Accuracy, n=9) 98.40
7 LOD (µg/ml) 0.13
8 LOQ (µg/ml) 0.39
9
Robustness
Mobile phase change Flow rate change Wavelength change
0.72 0.55 0.64
[image:7.595.84.505.420.669.2]ACKNOWLEDGEMENT
The authors are thankful to each person who involved in this project. Also a special thanks to Shree industrial training centre, Jalgaon for support and guidance regarding the same.
REFERENCES
1. Gan Zhou, Zhi-rong Tan, Wei Zhang. An improved LC-MS/MS method for quantitative determination of ilaprazole and its metabolites in human plasma and its application to a pharmacokinetic study. Acta Pharmacologica Sonica, 2009; 1330-1336.
2. Kim EJ, Lee RK, Lee SM, Kim DY. General pharmacology of IY-81149, a new proton pump inhibitor. Arzneimittelforschung 2001; 51: 51–9.
3. Myung SW, Min HK, Jin C, Kim M, Lee SM, Chung GJ, et al. Identification of IY81149 and its metabolites in the rat plasma using the on-line HPLC/ESI mass spectrometry. Arch Pharm Res 1999; 22: 189–93.
4. Li Y, Zhang W, Guo D, Zhou G, Zhou H, Xiao Z. Pharmacokinetics of the new proton pump inhibitor ilaprazole in Chinese healthy subjects in relation to CYP3A5 and CYP2C19 genotypes. Clin Chim Acta 2008;39: 60–7.
5. B. Satheesh, K. K. Sree Ganeshb, D. Saravanana, K. Gundu Ramakantb & Sivaraman Sivananthan, Simultaneous determination of Ilaprazole and its related compounds in pharmaceutical dosage forms by UPLC. Journal of Liquid Chromatography & Related Technologies 2013; 2968-2981.
6. Taylor PJ. Matrix effects: the Achilles heel of quantitative high-performance liquid chromatography-electrospray-tandem mass spectrometry. Clin Biochem 2005; 38: 328– 34.
7. Karnes HT, March C. Precision, accuracy, and data acceptance criteria in biopharmaceutical analysis.Pharm Res 1993; 10: 1420–6.
8. Food and Drug Administration. Guidance for Industry on Bioanalytical Method Validation. Federal Register, 2001; 66: 28526–7.
9. Shah VP, Midha KK, Findlay JW, Hill HM, Hulse JD, McGilveray IJ, et al. Bioanalytical method validation — a revisit with a decade of progress. Pharm Res 2000; 17: 1551–7. 10. Periclou AP, Goldwater R, Lee SM, Park DW, Kim DY, Cho KD, et al. A comparative