DESIGN & INVITRO CHARACTERIZATION OF GLIBENCLAMIDE
CONTROLLED RELEASE TABLETS
H. Padma Latha*1, R. Ramya2 and M. Phani Sri3
Gyana Jyothi College of Pharmacy, Uppal, Hyderabad-500098, Telangana.
ABSTRACT
The aim of the present study is to formulate and evaluate Glibenclamide controlled release tablets and to evaluate various parameters of prepared formulation. The tablet containing guar gum, xanthan gum, microcrystalline cellulose, karaya gum, talk in combination was prepared by direct compression method. The incompatibility between drug and Excipient was tested by FTIR and UV and was found to be compatible. Tablets were subjected to evaluation parameters such as dimensions, hardness, friability, weight variation, drug content, in-vitro drug release study and have shown satisfactory results. Batch F6 showed promising results of in-vitro drug
release as it matched with standard USP specification for dissolution of controlled release Glibenclamide tablet. The formulations prepared with Karaya gum retarded the drug release in the concentration of 18 mg (F6 Formulation) showed required release pattern i.e., retarded
the drug release up to 10 hours and showed maximum of 97.47% in 12 hours with good retardation. Dissolution data was fitted to various mathematical models to analyze the release kinetics and F6 formulation was found to be best fitted to zero order kinetic followed by
Higuchi model and exhibited anomalous diffusion release mechanism.
KEYWORDS: Glibenclamide, FTIR, Karaya gum.
INTRODUCTION
Glibenclamide is an oral anti hyperglycemic agent used for the treatment of non-insulin-dependent diabetes mellitus (NIDDM). It belongs to the sulfonylurea class of insulin secretagogues, which act by stimulating β cells of the pancreas to release insulin. Sulfonylurea increase both basal insulin secretion and meal-stimulated insulin release. Medications in this class differ in their dose, rate of absorption, duration of action, route of
Volume 6, Issue 16, 1479-1496. Research Article ISSN 2277– 7105
Article Received on 21 October 2017,
Revised on 12 Nov. 2017, Accepted on 02 Dec. 2017
DOI: 10.20959/wjpr201716-10327
*Corresponding Author
H. Padma Latha
Gyana Jyothi College of
Pharmacy, Uppal,
Hyderabad-500098,
elimination and binding site on their target pancreatic β cell receptor. Sulfonylureas also increase peripheral glucose utilization, decrease hepatic gluconeogenesis and may increase the number and sensitivity of insulin receptors. Sulfonylurea are associated with weight gain, though less so than insulin. Due to their mechanism of action, sulfonylurea may cause hypoglycemia and require consistent food intake to decrease this risk. The risk of hypoglycemia is increased in elderly, debilitated and malnourished individuals. Glibenclamide has been shown to decrease fasting plasma glucose, postprandial blood glucose and glycosolated hemoglobin (HbA1c) levels (reflective of the last 8-10 weeks of glucose control). Glibenclamide appears to be completely metabolized, likely in the liver. Although its metabolites exert a small hypoglycemic effect, their contribution to Glibenclamide hypoglycemic effect is thought to be clinically unimportant. Glibenclamide metabolites are excreted in urine and feces in approximately equal proportions. The half-life of Glibenclamide appears to be unaffected in those with a creatinine clearance of greater than 29 ml/min/1.73m2.
Structure
Mechanism of Action
Sulfonylurea’s such as Glibenclamide bind to ATP-sensitive potassium channels on the pancreatic cell surface, reducing potassium conductance and causing depolarization of the membrane. Depolarization stimulates calcium ion influx through voltage-sensitive calcium channels, raising intracellular concentrations of calcium ions, which induces the secretion, or exocytosis, of insulin.
EXCIPIENT PROFILE
1. XANTHAN GUM
Xanthan gum is a polysaccharide secreted by the bacterium Xanthomonas campestris, used
Structural Formula
Structure of xanthum Gum
2. TALC
Talc is a purified, hydrated, magnesium silicate, approximating to the formula mg6(si2o5)6(OH)
Molecular structure
3. MAGNESIUM STERATE
Functional category: Tablet and capsule lubricant.
Structure
4. MICROCRYSTALLINE CELLULOSE
Functional category: Adsorbent, suspending agent diluent, disintegrant.
5. KARAYA GUM
Gum karaya is a vegetable gum produced as an exudate by trees of the genus Sterculia. Gum karaya can be obtained from the tree of the same name, Sterculia urens.
Functional categories: Emulsifier, stabilizer, thickening agent.
Structural Formula
Structure of karaya gum
6. GUAR GUM
Guar gum is a galactomannan, obtained from plant Cyamopsis tetragonolobus.
Structural formula
Structure of Guar Gum
Functional categories: binder and disintegrant, suspending, thickening and stabilizing Agent.
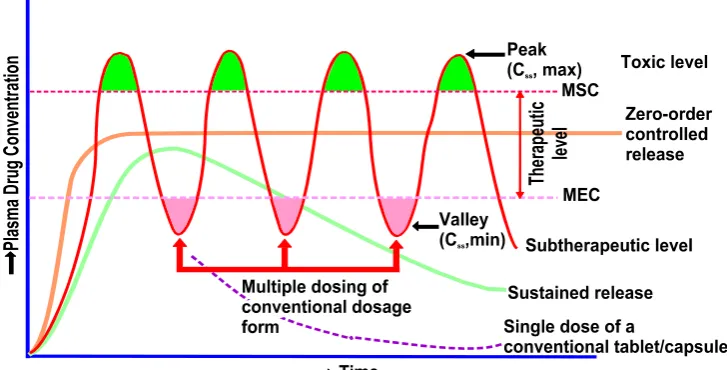
Oral controlled release drug delivery is a system that provides continuous oral delivery of drugs at predictable and reproducible kinetics for a predetermined period throughout the course of GI transit and also the system that target the delivery of a drug to a specific region within the GI tract for either a local or systemic action.
system provides a uniform concentration or amount of the drug at the absorption site and thus, after absorption allow maintenance of plasma concentrations within a therapeutic range, which minimizes side effects and also reduces the frequency of administration.
Fig: - A hypothetical plasma concentration-time profile from conventional multiple
dosing and single doses of sustained and controlled delivery formulations. (MSC =
maximum safe concentration, MEC = minimum effective concentration).
MATERIALS
Table 1: List of Materials Used.
Name of the material Source
Glibenclamide NATCO PHARMA PVT LTD
Guar gum Merck Specialities Pvt Ltd, Mumbai, India Gum karaya Merck Specialities Pvt Ltd, Mumbai, India Xanthan gum Merck Specialities Pvt Ltd, Mumbai, India MCC Merck Specialities Pvt Ltd, Mumbai, India Magnesium stearate Merck Specialities Pvt Ltd, Mumbai, India Talc Merck Specialities Pvt Ltd, Mumbai, India
Table 2: List of Equipment’s used.
Name of the Equipment Manufacturer
Weighing Balance Wensar
Tablet Compression Machine (Multistation) Karnavathi, India.
Hardness tester Monsanto, Mumbai, India. Verniercallipers Mitutoyo, Japan.
Roche Friabilator Labindia, Mumbai, India Dissolution Apparatus Labindia, Mumbai, India UV-Visible Spectrophotometer Labindia, Mumbai, India pH meter Labindia, Mumbai, India
[image:5.595.115.479.155.340.2]METHODOLOGY
1. Analytical method development
a) Determination of absorption maxima
A solution containing the concentration 10 µg/ ml drug was prepared in 0.1NHCl and pH 6.8 Phosphate buffer UV spectrums was taken using Double beam UV/VIS spectrophotometer. The solution was scanned in the range of 200 – 400.
b) Preparation calibration curve
100mg of Glibenclamide pure drug was dissolved in 100ml of Methanol (stock solution)10ml of above solution was taken and make up with100ml by using 0.1 N HCl (100μg/ml). From this 10ml was taken and make up with 100 ml of 0.1 N HCl (10μg/ml). The above solution was subsequently diluted with 0.1N HCl to obtain series of dilutions Containing 5,10,15,20,25,30,35 and 40μg/ml of Glibenclamide per ml of solution. The absorbance of the above dilutions was measured at 228 nm by using UV-Spectrophotometer taking 0.1N HCl as blank. Then a graph was plotted by taking Concentration on X-Axis and Absorbance on Y-Axis which gives a straight line Linearity of standard curve was assessed from the square of correlation coefficient(R2) which determined by least-square linear regression analysis. The above procedure was repeated by using pH 6.8 phosphate buffer solutions. The absorbance was found to be 232nm.
2. Drug – Excipient compatibility studies
Fourier Transform Infrared (FTIR) spectroscopy
The physical properties of the physical mixture were compared with those of plain drug. Samples was mixed thoroughly with 100mg potassium bromide IR powder and compacted under vacuum at a pressure of about 12 psi for 3 minutes. The resultant disc was mounted in a suitable holder in Perkin Elmer IR spectrophotometer and the IR spectrum was recorded from 3500 cm to 500 cm. The resultant spectrum was compared for any spectrum changes.
3. Pre formulation parameters
a. Angle of repose b. Bulk density c. Tapped density
4. Formulation development of Tablets
Procedure
1) Glibenclamide and all other ingredients were individually passed through sieve no 60. 2) All the ingredients were mixed thoroughly by triturating up to 15 min.
3) The powder mixture was lubricated with talc.
4) The tablets were prepared by using direct compression method.
5) Table 3: Formulation composition for tablets.
INGREDIENTS F1 F2 F3 F4 F5 F6 F7 F8 F9
Drug 5 5 5 5 5 5 5 5 5
Guar Gum 5 10 15 - - - -
Gum karaya - - - 5 10 15 - - -
Xanthan gum - - - 5 10 15
Talc 3 3 3 3 3 3 3 3 3
Magnesium stearate 3 3 3 3 3 3 3 3 3
Microcrystalline cellulose Q.S Q.S Q.S Q.S Q.S Q.S Q.S Q.S Q.S
All the quantities were in mg.
5. Evaluation of post compression parameters for prepared Tablets:
a. Weight variation test b. Hardness
c. Thickness d. Friability
e. Determination of drug content:
In vitro drug release studies
Dissolution parameters:
Apparatus -- USP-II, Paddle Method
Dissolution Medium -- 0.1 N HCl, pH 6.8 Phosphate buffer RPM -- 50
Sampling intervals (hrs) -- 0.5,1,2,3,4,5,6,7,8,10,11,12 Temperature -- 37°c + 0.5°c
Procedure
then the medium 0.1 N HCl was removed and pH 6.8 phosphate buffer was added process was continued from up to 12 hrs at 50 rpm. At definite time intervals of 5 ml of the receptors fluid was withdrawn, filtered and again 5ml receptor fluid was replaced. Suitable dilutions were done with receptor fluid and analyzed by spectrophotometricallyat238 nm using UV-spectrophotometer.
6. Application of Release Rate Kinetics to Dissolution Data
a. Zero order release rate kinetics b. First order release rate kinetics c. Higuchi release model
d. Korsmeyer and Peppas release model
RESULTS AND DISCUSSION
1. Analytical Method
[image:8.595.87.476.400.750.2]Graphs of Glibenclamide were taken in Simulated Gastric fluid (pH 1.2) and in p H 6.8 phosphate buffer at 228 nm and 232 nm respectively.
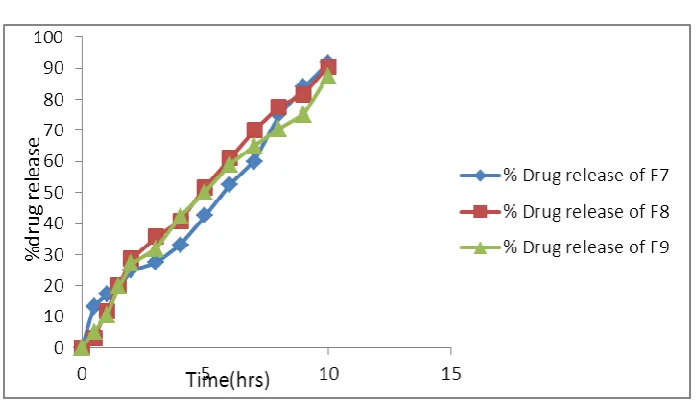
Table 4: Observations for graph of Glibenclamide in 0.1N HCl (228nm).
Concentration [µg/l] Absorbance
0 0
5 0.104
10 0.205
15 0.302
20 0.411
25 0.503
30 0.608
35 0.710
40 0.808
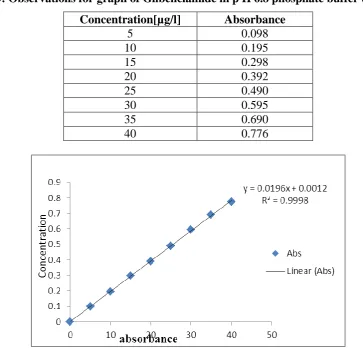
Table 5: Observations for graph of Glibenclamide in p H 6.8 phosphate buffer (232nm).
Concentration[µg/l] Absorbance
5 0.098
10 0.195
15 0.298
20 0.392
25 0.490
30 0.595
35 0.690
40 0.776
Figure 2: Standard graph of Glibenclamide pH 6.8 phosphate buffer (232nm).
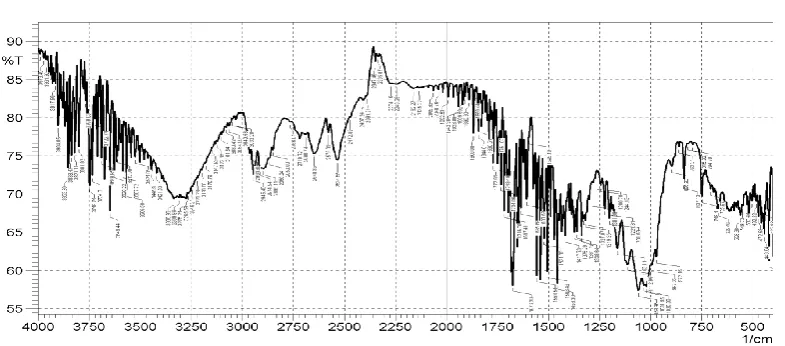
2. Drug and Excipient compatibility studies
[image:9.595.102.493.529.679.2]a. FTIR Spectrum of Pure Drug
b. FTIR Spectrum of Optimized formulation
Fig 4: FTIR Spectrum of optimized formulation.
[image:10.595.63.532.407.570.2]3. Pre formulation parameters of powder blend
Table 6: Pre-formulation parameters of Core blend.
Formulation Code
Angle of Repose
Bulk density (gm/ml)
Tapped density (gm/ml)
Carr’s index (%)
Hausner’s Ratio
F1 25.11 0.49±0.04 0.54±0.04 16.21±0.06 0.86±0.06 F2 25.67 0.52±0.09 0.52±0.04 16.87±0.05 0.98±0.05 F3 25.54 0.50±0.05 0.58±0.05 17.11±0.01 0.64±0.03 F4 25.43 0.51±0.06 0.54±0.07 17.67±0.08 1.12±0.04 F5 25.34 0.52±0.03 0.57±0.03 16.92±0.04 1.2±0.08 F6 24.22 0.53±0.04 0.56±0.06 17.65±0.09 1.06±0.09 F7 25.18 0.54±0.06 0.59±0.04 16.43±0.05 0.76±0.03 F8 24.22 0.58±0.04 0.67±0.02 17.97±0.02 1.15±0.09 F9 25.05 0.55±0.08 0.5 2±0.03 17.54±0.09 1.17±0.02
4. Quality control parameters for tablets
[image:11.595.67.532.165.327.2]Tablet quality control tests such as weight variation, hardness, and friability, thickness and drug release studies in different media were performed on the compression coated tablet.
Table 7: Invitro quality control parameters for tablets.
Formulation codes
Weight
variation(mg) Hardness(kg/cm2)
Friability (%loss) Thickness (mm) Drug content (%)
F1 82.5 4.5 0.50 1.8 99.76 F2 85.4 4.5 0.51 1.9 99.45 F3 78.6 4.4 0.51 1.9 99.34 F4 81.6 4.5 0.55 1.9 99.87 F5 89.4 4.4 0.56 1.7 99.14 F6 89.7 4.5 0.45 1.7 98.56 F7 78.3 4.1 0.51 1.4 98.42 F8 81.2 4.3 0.49 1.7 99.65 F9 78.3 4.5 0.55 1.6 99.12 All the parameters such as weight variation, friability, hardness, thickness and drug content were found to be within limits.
[image:11.595.23.573.421.654.2]5. In-Vitro Drug Release Studies
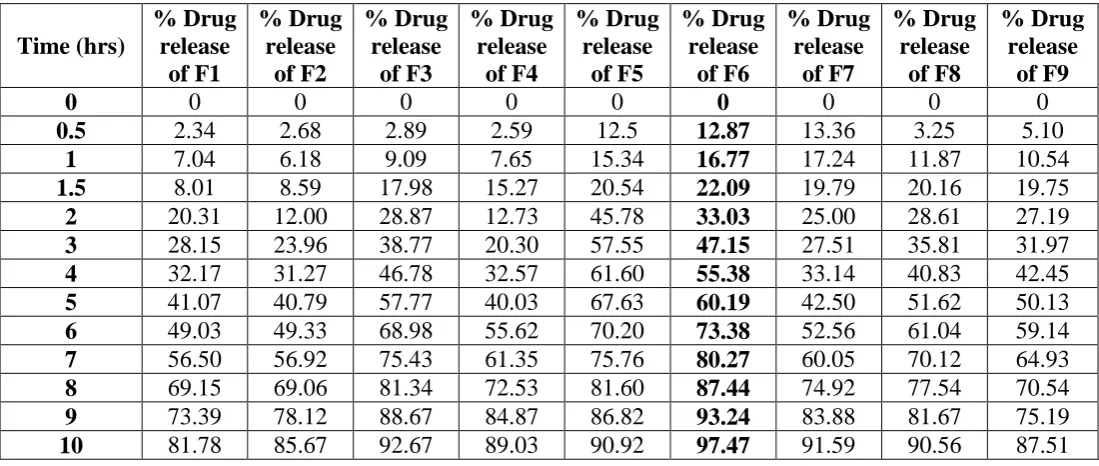
Table 8: Cumulative percent drug release of Glibenclamide Tablets.
Time (hrs) % Drug release of F1 % Drug release of F2 % Drug release of F3 % Drug release of F4 % Drug release of F5 % Drug release of F6 % Drug release of F7 % Drug release of F8 % Drug release of F9
0 0 0 0 0 0 0 0 0 0
0.5 2.34 2.68 2.89 2.59 12.5 12.87 13.36 3.25 5.10
1 7.04 6.18 9.09 7.65 15.34 16.77 17.24 11.87 10.54
1.5 8.01 8.59 17.98 15.27 20.54 22.09 19.79 20.16 19.75
2 20.31 12.00 28.87 12.73 45.78 33.03 25.00 28.61 27.19
3 28.15 23.96 38.77 20.30 57.55 47.15 27.51 35.81 31.97
4 32.17 31.27 46.78 32.57 61.60 55.38 33.14 40.83 42.45
5 41.07 40.79 57.77 40.03 67.63 60.19 42.50 51.62 50.13
6 49.03 49.33 68.98 55.62 70.20 73.38 52.56 61.04 59.14
7 56.50 56.92 75.43 61.35 75.76 80.27 60.05 70.12 64.93
8 69.15 69.06 81.34 72.53 81.60 87.44 74.92 77.54 70.54
9 73.39 78.12 88.67 84.87 86.82 93.24 83.88 81.67 75.19
Fig 5: Dissolution graphs for the formulations F1, F2, F3.
Fig 6: Dissolution graphs for the formulations F4, F5, F6.
Fig 7: Dissolution graphs for the formulations F7, F8, F9.
[image:12.595.124.473.466.670.2]Whereas the formulations prepared with Karaya gum retarded the drug release in the concentration of 18 mg (F6 Formulation) showed required release pattern i.e., retarded the drug release up to 10 hours and showed maximum of 97.47% in 12 hours with good retardation.
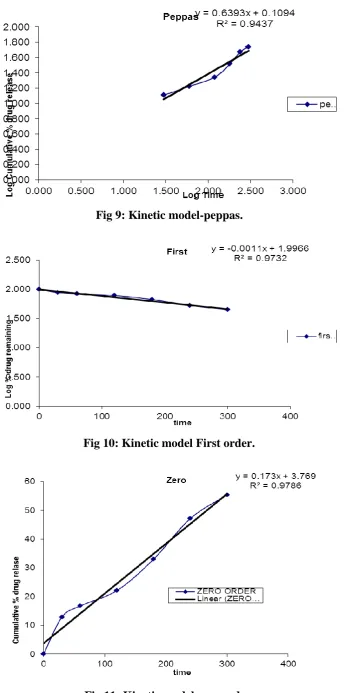
6. Application of Release Rate Kinetics to Dissolution Data
[image:13.595.28.569.218.677.2]7. Table 9: Different kinetic models for Glibenclamide tablets.
Fig 8: Kinetic model-higuchi. Code
Zero order First order Higuchi Peppas
Best fit model
R2 K0
mg/h−1 R
2
K1 (h−1) R2
K
(mg h−1/2) R
2
N
F1 0.9474 10.063 0.8592 0.1938 0.8334 23.8548 0.9830 1.9166 Peppas
F2 0.9700 9.4137 0.9021 0.1766 0.8712 23.6698 0.9656 1.7465 Zero-order
F3 0.9820 8.2020 0.9157 0.1455 0.8820 21.6151 0.9781 1.5340 Zero-order
F4 0.8785 10.209 0.7772 0.1920 0.8285 24.6881 0.7632 1.2412 Zero-order
F5 0.9664 9.1268 0.9041 0.1668 0.8594 22.8722 0.9841 1.7415 Peppas
F6 0.9724 4.6413 0.9471 2.0504 0.8364 13.945 0.9798 1.4375 Zero-order
F7 0.9699 8.3884 0.9632 0.1422 0.9049 22.3442 0.9419 1.4277 Zero-order
F8 0.9786 3.769 0.9349 0.1938 0.9732 23.8548 0.9437 1.9166 Peppas
Fig 9: Kinetic model-peppas.
[image:14.595.128.475.66.760.2]Fig 10:Kinetic model First order.
CONCLUSION
Aim of the present study was to develop controlled release formulation of Glibenclamide to maintain constant therapeutic levels of the drug for over 10 hrs. xanthan gum, Gum karaya, guar gum. Glibenclamide dose was fixed as 5 mg. Total weight of the tablet was considered as 80 mg. Polymers were used in the concentration of 5mg, 10mg and 15 mg concentration. All the formulations were passed various physicochemical evaluation parameters and they were found to be within limits. Whereas from the dissolution studies it was evident that the formulation (F6) showed better and desired drug release pattern i.e., 97.47% in 10 hours. It contains the natural polymer Glibenclamide as controlled release material. It followed zero order release kinetics mechanism. The best formulation was repeated again for reproducibility, and all the quality control tests were done for conformation. The results were found to be super imposable with each other. The optimized formula shall be utilized for the formulation development and other studies like bio-equivalence study, for successful launching of the product.
The best formulation was repeated again for reproducibility, and all the quality control tests were done for conformation. The results were found to be super imposable with each other.
The optimized formula shall be utilized for the formulation development and other studies like bio-equivalence study, for successful launching of the product.
REFERENCES
1. Awen Bz, Dasari V, Chandu Br, Katakam P, Gindi S Formulation And In Vitro Evaluation Of Controlled Release Valganciclovir Tablets Res Pharmaceutica |Jan.-Feb. 2011 | Vol. 2 | Issue 1|.
2. R.Prashanthi, P.Naga Haritha, E.Hima Bindu, P.Sunil Kumar Chaitanya, Akram Khan Formulation And In – Vitro Evaluation Of Controlled Release Matrix Tablets Of Flurbiprofen IAJPR. 2014; 4(12): 5686-5697.
3. Anjan Paudel Sumit Chandra Shrestha, Yogendra Raj Pandey, Subash Tha Shrestha, Formulation And In-Vitro Evaluation Of Controlled Release Tablet Of Bupropion Hydrochloride By Direct Compression Technique And Stability Study Ijpsr Vol 5 No 05 May 2014.
5. Patel Mubarak Husen, P Ashok Kumar, Suresh V Kulkarni, Someshwara Rao B Design And Evaluation Of Controlled Release Matrix Tablets Of Metoclopramide Hydrochloride Using Hydrophilic Polymers Int J Curr Pharm Res, 4(3): 64-69.
6. Mohammad Usman, Irshad Ali, Hafsa Bibi, Javeid Iqbal And Kashif Iqbal Preparation And Evaluation Of Controlled Release Tablets Containing Mefenamic Acid Clin Exp Pharmacol, 2012, 2: 1.
7. Praveen K, Khar Rk, Agarwal Sp (1998) Evaluation Of Guar Gum In The Preparation Of Sustained Release Matrix Tablets. Drug Dev. Ind. Pharm., 24: 1095-99.
8. Krishna K. Panchal and Narendra P. Chotai Formulation Development and In Vitro Evaluation of Controlled Release Matrix Tablet of Etodolac Indian Journal of Pharmaceutical Education and Research, 2013; 47(4): 39-48.
9. Lachman L, Lieberman Ha, Kanig Jl (1987) In: The Theory And Practice Of Industrial Pharmacy, 3rd Edn. Varghese Publishing House, Mumbai, India. P. 430.
10.Chien Yw, Wearley Ll (1989) Aids And Chemotherapy. Drugs Today, 25: 19-25.
11.Jain S, Umamaheshwari Rb, Bhadra D, Jain Nk (2004) Ethosomes: A Novel Vesicular Carrier For Enhanced Transdermal Delivery Of An Antihiv Agent. Ind. J. Pharm. Sci., 66: 72-81.
12.Patra Chn., Bhanoji Rme, Yadav Ks, Prakash K (2004) Influence Of Some Cellulose Ethers On The Release Of Propranolol Hydrochloride From Guar Gum Matrix Tablets. Ind. J. Pharm. Sci., 66: 636-41.
13.Valganciclovir.Http://Www.Medicines.Org.Uk/Emc/Medicine/9315#Posology. (Retrieved On 04- 01-2011).
14.Stockwell Af, Davis Ss, Walker Se (1986) In Vitro Evaluation Of Alginate Gel System As Sustained Release Drug Delivery Systems. J. Control. Rel., 3: 167-75.
15.Chickering De, Jacob Js And Mathowitz E (1995) Bio Adhesive Microspheres Ii: Characterization And Evaluation Of Bio Adhesion Involving Hard, Bio Erodible Polymers And Soft Tissues. Reactive Polymers. 25: 189-206.
16.Neha M Dembla, Arun Pandian Maniyam2 and Surendra Agarwal3 Formulation Development and Evaluation of Gabapentin Controlled Release Tablets Pharm Pharmacol Int J., 2015; 2(3): 00021.
17.Awen BZ Dasari VChandu BR Katakam P, Gindi S Formulation and In vitro Evaluation of Controlled Release Valganciclovir Tablets ISSN 2230‐9470.
19.Hiremath SP, Ranendra N S. 2008 “Oral Controlled Release Formulations of Rifampicin. Part II: Effect of Formulation Variables and Process Parameters on In Vitro Release”. Drug. Deli, 15: 159-68.
20.Nakano M, Ogata A. In vitro release characteristics of matrix tablets: Study of karaya gum and guar gum as release modulators. Ind J Pharm Sci., 2006; 68(6): 824- 6.
21.R. Chang, J. R. Robinson. Sustained release from tablets and particles through coating In: H. A. Libreman, L. Lachman and J. B. Schwartz (Eds), Phamaceuticls dosage form: Tablets, 2nd.
22.T. P. Hadjiioannou, G. D. Christian, M. A. koupparis. Quantitative calculations in pharmaceutical practices and research New Dehli, NY- VCH publishers Inc, 1993, pp. 345- 348. Edn, vol.3, Marceel Dekker, 1990; 199-302.
23.D. W. Bourne. Pharmacokinetics. In: G. S. Banker, C. T. Rhodes, eds. Modern Pharmaceutical, 4th ed. New York, NY, Marcel Dekker Inc, 2002; 67-92.
24.T. Higuchi. Mechanism of sustained action medication, Theoretical analysis of rate of release of solid drugs dispersed in solid matrices, J. Pharm. Sci., 1963; 52: 1145-1149. 25.Korsmeyer R W, Gurny R, Doelker E, P. Buri and N. A. Peppas. Mechanism of solute
release from porous hydrophilic polymers. Int. J. Pharm., 1983; 15: 25-35.
26.Ropper AH, Samuels MA (2009) Chapter 33. Viral Infections of the Nervous System, Chronic Meningitis and Prion Diseases. In: Ropper AH & Samuels MA (Eds.), Adams and Victor’s Principles of Neurology. McGraw-Hill Medical, New York, USA.
27.Rappaport BA, Hertz S, Roca R, Racoosin J, Lin A, et al. (2011) Division of Anesthesia, Analgesia and Addiction Products (DAAAP). FDA & Center for drug evaluation and research, USA.
28.M. Kushal, M. Monali, M. Durgavati, P. Mittal, S. Umesh, S. Pragna. Oral controlled release drug delivery system: an overview, Int. Res. J Pharmacy. 2013; 4(3): 70- 76. 29.K.P.R. Chowdary, G.S. Kalyani. Recent research on matrix tablets for controlled release:
a review, Int. Res. J Pharma. Applied Sci., 2013; 3(1): 142-148.
30.L. Shargel, S. Wu-Pong, A. Yu. Applied biopharmaceutics & pharmacokinetics, Sixth Edition. 2012; 35-39.
31.M. Gibaldi. Biopharmaceutics and clinical pharmacokinetics, Published by Pharma Med Press, Fourth Edition. 126.
33.S. Dash, P.N. Murthy, L. Nath, P. Chowdhury. Kinetic modeling on drug release from controlled drug delivery systems, Acta Poloniae Pharma. Drug Res., 2010; 67(3): 217-223.
34.G. Singhvi, M. Singh. Review: in-vitro drug release characterization models, Int. J Pharma. Studi. Res., 2011; 2(1): 77-84.
35.H. Lokhandwala, A. Deshpande, S. Deshpande. Kinetic modeling and dissolution profiles comparison: an overview, Int. J Pharma. Biosci. 2013; 4(1): 728-737.
36.G. Yadav, M. Bansal, N. Thakur, S. Khare, P. Khare. Multilayer tablets and their drug release kinetic models for oral controlled drug delivery system, Middle East J Sci. Res., 2013; 16(6): 782-795.
37.S.A. Chime, G.C. Onunkwo, I.I. Onyishi. Kinetics and mechanisms of drug release from swellable and non swellable matrices: a review, Res. J Pharma. Bio. Chemical Sci., 2013; 4(2): 97-103.
38.Indian Pharmacopoeia, Government of Indian Ministry of Health & Family Welfare’, Published by The Indian Pharmacopoeia Commission Ghaziabad. 1(2007).
39.Brahmannkar DM and Jaiswal SB. Controlled released medication, Biopharmaceutics and Pharmacokinetics. Vallabh Prakashan, Delhi, 1985, 1st Edn, 335-346.
40.Kumar V, Prajapati SK, Soni GC, Singh M. Sustained release matrix type drug delivery system: A Review. W. J. Pharm. Pharma. Sci, 2012; 1(13): 934-960.
![Table 4: Observations for graph of Glibenclamide in 0.1N HCl (228nm). Concentration [µg/l] 0](https://thumb-us.123doks.com/thumbv2/123dok_us/847142.595248/8.595.87.476.400.750/table-observations-graph-glibenclamide-n-hcl-concentration-ug.webp)